Rotation Gold to BTCEvery time gold reaches the top, Bitcoin has a 20% correction. Then money flows from gold to the Bitcoin market, and Bitcoin starts a rally.
Bitcoinprediction

BITCOIN SIGNAL: THIS IS WHAT WILL HAPPEN NEXT!!!(smash it) Yello Paradisers! Enjoy the video!!
And Paradisers! Keep in mind to trade only with a proper professional trading strategy. Wait for confirmations. Play with tactics. This is the only way you can be long-term profitable.
Remember, don’t trade without confirmations. Wait for them before creating a trade. Be disciplined, patient, and emotionally controlled. Only trade the highest probability setups with the greatest risk to reward ratio. This will ensure that you become a long-term profitable professional trader.
Don't be a gambler. Don't try to get rich quick. Make sure that your trading is professionally based on proper strategies and trade tactics.

BTC/USDT Analysis. Expected Range-Bound Movement
Hello everyone! This is the trader-analyst from CryptoRobotics, and here’s your daily market analysis.
Yesterday, Bitcoin rebounded from the lower boundary of the high-volume zone at $113,600–$110,600, showing a modest upward move. Upon reaching local resistance, selling pressure returned — currently, sell-side activity dominates according to delta data. However, the absence of strong bearish candles suggests that price action is more likely to drift toward the upper boundary of the current range.
For now, the scenario remains unchanged: we expect continued rotation within the $110,000–$116,000 range. The breakout priority remains to the upside, supported by several factors — stop-hunting below key levels, preservation of the broader flat structure, and evidence of selling absorption in delta.
The bearish alternative would be a firm consolidation below the local low of $109,500, which could open room for a deeper decline toward $97,000.
Buying Zone:
$113,600–$110,600 (high-volume area)
Selling Zone:
$120,900–$124,000 (volume zone)
This publication does not constitute financial advice.

$107,551 Will be a Critical Area for BitcoinGiven that the price of Bitcoin BITSTAMP:BTCUSD is falling below the 8-EMA, 21-EMA, and 200-EMA, technical analysis employing the H4 period suggests that the cryptocurrency is in a downward trend.
The current price of Bitcoin is between $107,551 and $122,007, which is both a traditional support and a demand area. Many traders who established long positions were liquidated in the $108,261 range, according to Coinglass's liquidity data. Consequently, the $107,551–$108,261 range is regarded as a long-term area to monitor.
If the price stays steady above the $107,551–$108,261 area, with a price increase towards the $116,108 region, Bitcoin could continue its upward trajectory.
The price of Bitcoin will continue to drop, testing the $102,000 mark, if it breaks out below $107,551.

Bitcoin - First Signs of the Bear AwakeningBitcoin recently swept the previous all-time high, taking liquidity from the major external range. After that sweep, price reacted sharply downward, leaving behind a significant daily imbalance. This gap is now acting as resistance, with clear rejection seen on the daily timeframe. The move signals exhaustion from buyers and an early sign that the market could be preparing for a deeper retracement phase.
Consolidation Structure
Following the rejection, Bitcoin is moving within a short-term consolidation range, sitting between the daily imbalance above and a major demand zone below. This structure represents indecision as the market transitions from expansion to a potential reaccumulation or redistribution phase. The large wick left behind during the last drop suggests that liquidity was collected below the previous range, but it remains unfilled, hinting at unfinished business in that area.
Bullish Scenario
In the short term, a bounce from the lower zone could play out as the market attempts to correct the imbalance. This would align with a 50% fill of the previous large wick, providing the liquidity needed before resuming any sustained downside movement. If buyers manage to reclaim control temporarily, the move would likely target the unfilled 4-hour gaps sitting above current price.
Bearish Scenario
However, any upside reaction is expected to face resistance at the daily imbalance. Once those 4-hour gaps are filled, the likelihood of another rejection increases. If that rejection confirms, it could trigger a larger selloff targeting the strong support area below, where the next round of liquidity rests. The reaction from that zone will determine whether the market continues lower or begins forming a new base for accumulation.
Price Target and Expectations
The ideal flow would see Bitcoin dip to fill 50% of the large wick, find temporary support, then stage one final bounce into the 4-hour imbalance zone before resuming its bearish leg. This structure keeps the overall narrative intact, combining liquidity behavior with efficient price delivery.
Conclusion
Bitcoin’s current setup remains technically balanced between two key inefficiencies. A short-term bounce is likely before continuation lower, with the daily gap rejection acting as the main pivot point in this structure. Until the wick fill and 4-hour gaps are resolved, the path of least resistance remains to the downside.
___________________________________
Thanks for your support!
If you found this idea helpful or learned something new, drop a like 👍 and leave a comment, I’d love to hear your thoughts! 🚀

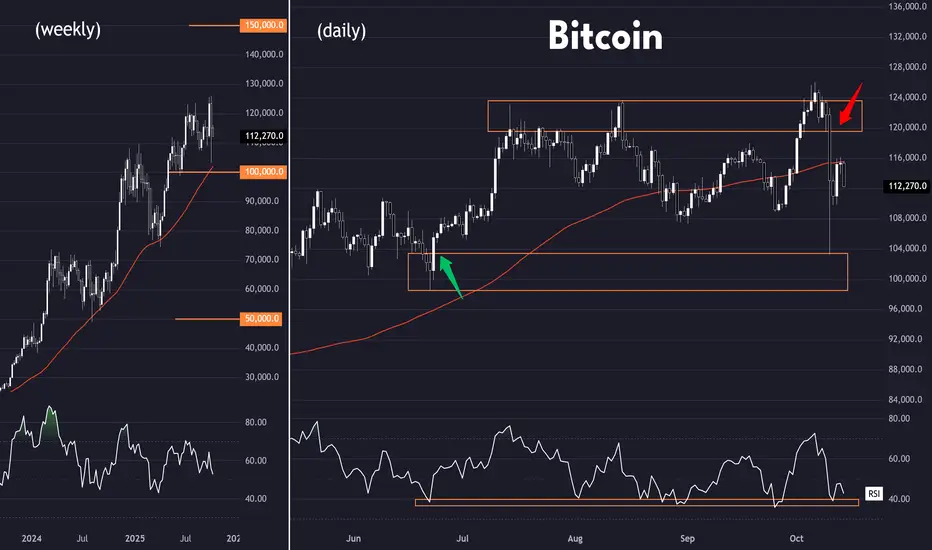
Bitcoin - It is either $50.000 or $1.000.000!🪅Bitcoin ( CRYPTO:BTCUSD ) remains undecided:
🔎Analysis summary:
For the past couple of months, Bitcoin has been consolidating. With the two recent all time highs, we could see a similar pattern to what we saw back in 2021, followed by a bear market. But so far, Bitcoin remains bullish with the underlying trend continuation.
📝Levels to watch:
$1.000.000, $50.000
SwingTraderPhil
SwingTrading.Simplified. | Investing.Simplified. | #LONGTERMVISION

BTC/USDT Analysis. Post-Dump Outlook
Hello everyone! This is the trader-analyst from CryptoRobotics, and here’s your daily market analysis.
Yesterday, Bitcoin tested the upper boundary of the volume profile at $113,600–$110,600, showing a brief rebound, but the local high couldn’t be broken — sellers quickly regained control.
At the moment, price has reached the lower edge of this zone. The fast-recovery scenario, unfortunately, hasn’t materialized, shifting our expectations toward a neutral outlook.
We expect a rotation within the $110,000–$116,000 range, which may continue until the end of the week. The breakout priority remains to the upside — supported by factors such as stop-hunting below, the preservation of the broader flat structure, and evidence of selling absorption in delta.
However, a bearish alternative remains possible: if Bitcoin consolidates firmly below $113,600–$110,600, the downside target would extend toward $97,000.
Buying Zone:
$113,600–$110,600 (high-volume area)
Selling Zone:
$120,900–$124,000 (volume zone)
This publication does not constitute financial advice.

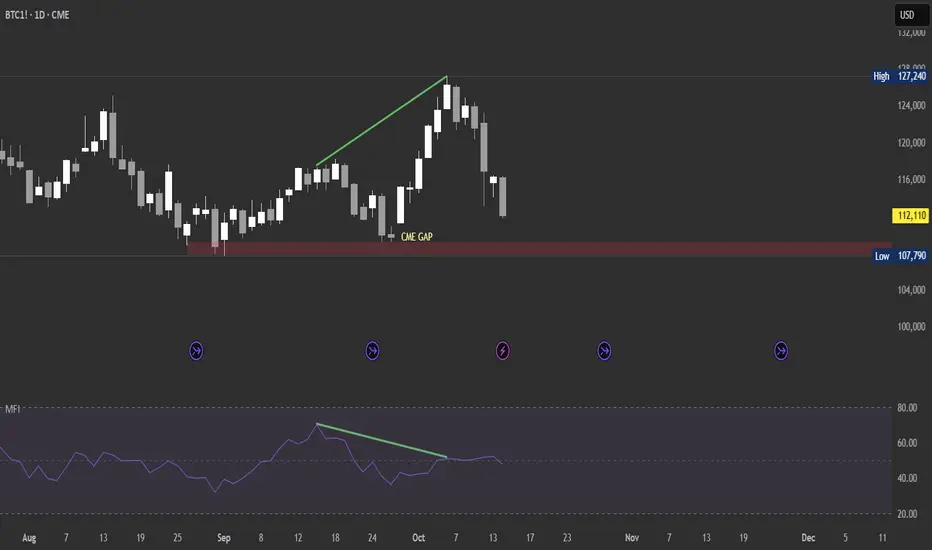
BTC heading to fill the CME GAPBTC looks like it's heading to fill the CME gap on the daily timeframe. That red zone could act as a strong support and a good level to go long under ideal conditions — unless our orange head decides to rig it again. Peace
Operating within Supply & Demand zones (Bitcoin)Setup
Bullish. Correction
Bearish engulfing candle (but long lower wick)
False breakout after record high over $125,000.
Stay bullish while over 100k
Signal
Price has rebounded from demand zone around 104,000
a) Deamnd zone needs to hold to take next bullish signal
b) Looking for similar drop from supply zone near 120,000
BTC — Targets for the Current CycleIt looks like BTC is completing its growth phase. The current structure points to a distribution stage and a gradual rotation of liquidity into ETH and altcoins.
Still, our key levels for this move remain:
🎯 Target 1: $102,000 — key support and possible first reaction zone.
🎯 Target 2: $87,000 — deeper retracement
🎯 Target 3: $64,000

BTC Trade Idea: Will Support Hold or Is a Reversal Coming? Bitcoin has broken structure to the upside and is showing early bullish signs 🟢. I’m watching closely for a long opportunity if price holds above the current support level and we see a confirmed break of structure from the current low.
However ⚠️ — if this level fails to hold and price breaks below the previous low, we could shift bias and look for a short opportunity 🔻.
📊 Not financial advice — for educational purposes only.

Chart Analysis: Bitcoin Holds Critical Support at $107,450Bitcoin has dropped by almost 10% after Trump announced that he would impose 100% tariffs on China. The largest liquidation event in cryptocurrency history to date, totaling $19 billion, has also occurred.
On the weekly timeframe, there is a chance for a breakout below the 8-day moving average (EMA8) even though the price movement of Bitcoin has rejected the 21-day moving average (EMA21). As a result, traders and long-term investors will be able to predict whether the price will reject the typical support area at $107,450 and continue its upward trajectory, or whether it will breakout below it and start a bear market.

BTC/USD: Danger Zone Ahead—Here’s What I’m Watching Take a close look at what’s happening now. BTC/USD is on the edge at 111,060, and if that breaks, the next major levels are 106,470, 103,200, then possibly even 100,000. Markets can shift fast; are you prepared with clear levels and a plan, or will you get caught reacting?
If you’ve ever felt unsure about how to spot big moves before they happen, or wondered how some traders seem to always stay one step ahead, you’re not alone. What’s the one thing you wish someone had told you when the market started moving fast? What’s your biggest struggle when the price gets volatile?
Drop your thoughts or questions in the comments
Or if you want to dig deeper, my inbox is always open for a real conversation. Sometimes the right question is all it takes to unlock a breakthrough. What do you want to see covered next?

BITCOIN COME BACK TO 125.000 Lets Gooo Hey ,
After A Big Crash In Crypto We Follow Now Our Technical Analysis And Market Structure And We Have A Find A Bullish Bitcoin Setup For Longterm Holding
Buy Reason : QM
Buy Zone : 112.937 to 112.091
Target Old High : BSL
Hope You Gpt The Trade And Understand It

Bitcoin Price Nears $115,000 as Investors Refrain From SellingBitcoin is currently trading around $114,553, just below the critical $115,000 resistance level. It briefly surpassed this mark during the intra-day high but failed to maintain momentum, indicating ongoing selling pressure near this threshold.
In the short term, Bitcoin’s outlook remains cautiously bullish, supported by strong holder sentiment. A successful reclaim of $115,000 could pave the way toward $117,261 and eventually $120,000. However, a full recovery would require a sustained push back to $122,000.
But, if the bearish pressure from traders outweighs investor restraint, Bitcoin could slip below $112,500. This could result in the crypto king testing the $110,000 support level and invalidating the bullish outlook.

Bitcoin BTC price analysis after crash📈 OKX:BTCUSDT held above the key psychological level of $100,000, remaining within the long-term uptrend 💪
💀 Altcoins suffered heavy losses — liquidity vanished across the board.
This highlights the importance of balance:
🔸 20% in low-cap alts
🔸 80% in resilient assets
💰 The official $19–20B liquidation figure seems understated —
data suggests the cascade started on CEX platforms after algorithmic issues and liquidity gaps.
📊 Fear & Greed Index: 38 — still fear, volatility ahead ⚠️
🇺🇸 The U.S. market open could set the tone for the week 🎢
💭 Do you expect CRYPTOCAP:BTC to retest lower levels before the next leg up?
______________
◆ Follow us ❤️ for daily crypto insights & updates!
🚀 Don’t miss out on important market moves
🧠 DYOR | This is not financial advice, just thinking out loud

Bitcoin BTC Breaks Structure | Watching for Discount Entry LongBitcoin has experienced a fairly aggressive retracement recently, but we’re now starting to see bullish momentum returning and a clear shift in structure to the upside 🚀.
💡 My plan is to look for a retracement into the 50% equilibrium level of the current swing range — from low to high — as this could provide a potential discount entry zone for a long opportunity 🏹.
If price pulls back and respects that equilibrium level before breaking structure bullish again, it could set up a strong continuation trade. If not, we patiently step aside and wait for confirmation — discipline over impulse.
⚠️ Disclaimer: This content is for educational purposes only and not financial advice.

AVAX Ignites Bias: Long
Timeframe: 15-min (scalp to intraday swing)
Not a financial advice. Just sharing my personal setup and observations.
Always DYOR, manage your risk, and trade safe.

BTC BUY NOW ?BITSTAMP:BTCUSD
Bitcoin flushed out .
Next Impulse started from 98200 - 98400 range.
Entered long @98700 with SL the low.
Expecting a rally & holding it to ATH
Small Risk and changing SL to CtC when it crosses 100300

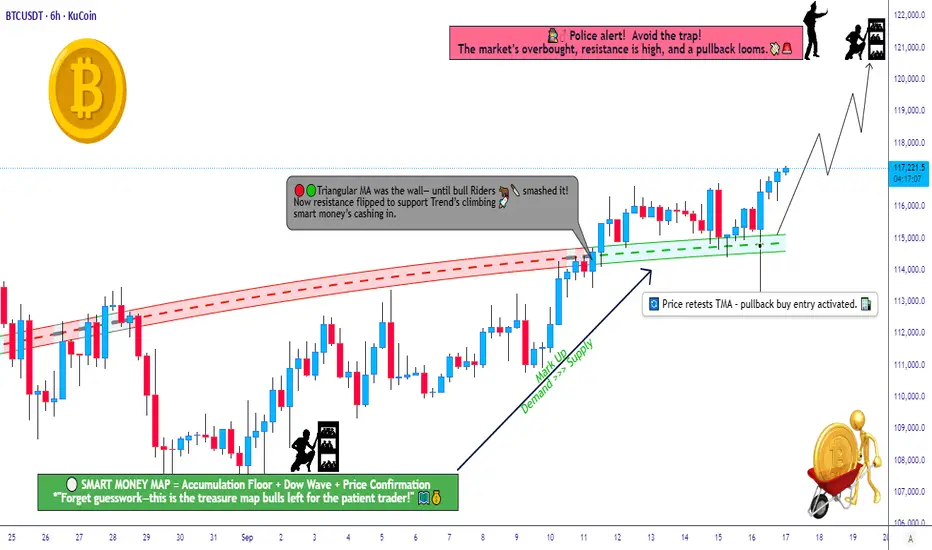
BTC/USDT Wealth Map – Trend Confirmed, Targets in Sight!🚀 BTC/USDT: The Great Crypto Heist! 🤑 Swing/Day Trade Wealth Map
Asset: BTC/USDT (Bitcoin vs. Tether) Vibe: Bullish breakout with a cheeky "thief" twist! 😎Strategy: Swing/Day Trade with a layered limit order approach to steal profits from the market! 💰
📊 Market Analysis: The Heist Setup
🐂 Bullish Trend Alert: Bitcoin’s charging out of the accumulation zone like a runaway train! 🚂
📈 Triangular Moving Average (TMA) Breakout: Price smashed through the TMA, confirming a reaccumulation phase. Candles retested the TMA dynamic line, screaming TREND CONFIRMED — bulls are in control! 💪
🕵️♂️ Thief Strategy: We’re using a layered limit order approach (aka the "Thief Layering Tactic") to sneak into the market at multiple price levels. This maximizes entries while keeping it slick and stylish!
🗺️ The Heist Plan
🎯 Entry: Pick your spots like a master thief!
🔹 Use layered buy limit orders at:
💸 $115,000
💸 $115,500
💸 $116,000
💸 $116,500
💸 $117,000
🔍 Pro Tip: Feel free to add more layers based on your risk appetite and market conditions! Stack those entries like a pro. 😎
🌟 Alternative: If you’re feeling bold, enter at any price level post-breakout — just keep an eye on momentum!
🛡️ Stop Loss (SL): Set your Thief SL at $114,000 after the breakout for protection.
🔹 Dear Ladies & Gentlemen (Thief OGs), this SL is a suggestion! Adjust it based on your strategy and risk tolerance. Don’t let the market cops catch you off-guard! 🚨
🎯 Take Profit (TP): Watch out for the police barricade (aka strong resistance) at $121,000. This zone may act as an overbought trap, so grab your profits and escape before the market locks you in! 🏃♂️
🔹 Note: Thief OGs, this TP is a guideline. Set your own targets based on your risk-reward preference. Steal the profits and vanish! 💸
🧠 Key Notes for Thief OGs
⚠️ Risk Management: I’m not your financial advisor, so don’t just follow my SL or TP blindly. Tailor your plan to your own risk tolerance and make those profits yours!
🕵️♂️ Thief Mindset: The market’s a game of cat and mouse. Stay sharp, adapt, and don’t get greedy — escape with your loot before the traps spring!
🔗 Related Pairs to Watch
Keep an eye on these correlated assets for extra context:
🔹 BINANCE:ETHUSDT : Ethereum often moves in tandem with Bitcoin. A bullish BTC breakout could spark ETH’s own rally. Watch for similar TMA breakouts or retests!
🔹 BINANCE:BNBUSDT : Binance Coin tends to follow BTC’s lead in bullish markets. Check for momentum alignment.
🔹 BINANCE:XRPUSDT : Ripple can show correlated strength, especially if BTC pushes past resistance. Look for breakouts above key levels.
🌟 Correlation Tip: These pairs often mirror BTC’s price action in bullish trends, but always confirm with your own analysis to avoid market traps! 🕸️
✨ Final Words
This is your chance to pull off the ultimate crypto heist with BTC/USDT! Stay disciplined, manage your risk, and let’s make those profits disappear into your wallet! 😜
✨ If you find value in my analysis, a 👍 and 🚀 boost is much appreciated — it helps me share more setups with the community!
#BTCUSDT #CryptoTrading #SwingTrading #DayTrading #ThiefStrategy #BullishBreakout #TradingView
BTC 1D AnalysisBitcoin is still at the support of Up trendline on daily timeframe. Hopes are still alive.
Also we can say it is on the support zone. If you wish to take trade on any side please confirm it on 4H once.

Bitcoin Another Bounce Coming?Bitcoin is currently retesting its 50-week Simple Moving Average (SMA) — a historically significant support zone that has acted as a launchpad for multiple bullish continuations throughout previous markets.
Each time BTC has interacted with this moving average since mid-2023, it has managed to rebound strongly, confirming it as a key dynamic support level during this bull phase.
🔶If BTC holds above the 50-week SMA, it may indicate another healthy correction within an ongoing uptrend, potentially setting the stage for the next leg higher.
🔶A clean weekly close below the 50 SMA could suggest a trend weakening and open the door for deeper retracements toward the $90K–$95K region.
Cheers
Hexa

After a strong downward movement, the price has formed a base anAfter a strong downward movement, the price has formed a base and is now showing signs of upward momentum. The chart suggests a long trade setup, with clear targets at 113,052 (Target 1) and 114,037 (Target 2), while maintaining a stop loss around 111,000.
