$BTC/USD - Troubled Road AheadBITMEX:XBT
January/2026
-Risk-On Sentiment of High Risk asset.
Liquidity withdrawing from Cryptomarket !
Bitcoin is headed South after breaking down for the weekly bear flag formation post ATH retracment.
Second week of Swing Short position going great, Stop Loss is now set at break-even point (considering to set it in profit).
If a Weekly Double Bottom fails at 80K, down we go to Lower High's structure of wicks just below noted as liquidity,
a support-resistance zone as well the 69K ATH level support for #bitcoin.
That is a TP target of <50% while intending to ride it down to Accumulation Area or 1.618 retracement .
TRADE SAFE
NOTE THAT THIS IS NOT FINANCIAL ADVICE !
PLEASE DO YOUR OWN RESEARCH BEFORE PARTAKING ON ANY TRADING ACTIVITY BASED SOLY UPON THIS IDEA
Bitcoinprice

BTCUSD 84K BUY LIMIT (Bitcoin -Btcusd) nice buy limit awaiting to be triggered on 84K I will be scalping and trailing my stop , make sure to always secure profits , reason for this trade is because Btcusd has been dropping consistently and for this reason it should reverse to a certain price point before dropping any further, we can expect a 3 white soldiers to appear within this price pattern

BITCOIN PROFIT RECAP 90KBitcoin has hit take profit and hit the
(90 405) level as predicted , so now it’s all well ,as it fell below right after hitting the 90k level now we can wait for it to continue dropping until it gives us a clear reversal pattern to the upside

Bitcoin - Creating another -30% correction!🤬Bitcoin ( CRYPTO:BTCUSD ) is still in a bearish market:
🔎Analysis summary:
Just a couple of months ago, Bitcoin created its expected bullmarket all time high. Since then, we already witnessed a correction of about -30%. But looking at higher timeframe structure, this correction is not over and we might see a final push of -30% lower soon.
📝Levels to watch:
$60,000
SwingTraderPhil
SwingTrading.Simplified. | Investing.Simplified. | #LONGTERMVISION

Bitcoin Loves Bulls Right Now… Until This HappensYello Paradisers! Enjoy the video!
And Paradisers! Keep in mind to trade only with a proper professional trading strategy. Wait for confirmations. Play with tactics. This is the only way you can be long-term profitable.
Remember, don’t trade without confirmations. Wait for them before creating a trade. Be disciplined, patient, and emotionally controlled. Only trade the highest probability setups with the greatest risk to reward ratio. This will ensure that you become a long-term profitable professional trader.
Don't be a gambler. Don't try to get rich quick. Make sure that your trading is professionally based on proper strategies and trade tactics.

BITCOIN IS ABOUT TO PENETRATE BEARS!!!!!? (hard)Yello Paradisers! Enjoy the video!
And Paradisers! Keep in mind to trade only with a proper professional trading strategy. Wait for confirmations. Play with tactics. This is the only way you can be long-term profitable.
Remember, don’t trade without confirmations. Wait for them before creating a trade. Be disciplined, patient, and emotionally controlled. Only trade the highest probability setups with the greatest risk to reward ratio. This will ensure that you become a long-term profitable professional trader.
Don't be a gambler. Don't try to get rich quick. Make sure that your trading is professionally based on proper strategies and trade tactics.

Bitcoin Bear Flag Breakdown in Play - Target $74k - $75kAnd this chart of Bitcoin we see the Bear Flag pattern playing out as forecast by the Red zigzag line a few weeks ago.
Price pushed up directly into the Red Cell Zone which are just visualizations of limit sell orders on the order books. Similarly, there are strong limit buy orders in the buy support green zone below around 84 to 85k.
But based on my prior study of the macro Head and Shoulders that likely will play out, even if we get it bounce here I do believe we will roll over and take out the buy support Zone below us and complete the Bear Flag measured move target down to 74k to 75k.
This will likely be the bottom, as Bitcoin is never gone below the price it was when a new incoming president won an election. 74k was a prior resistance level flipped as support and I expected to hold.
If it doesn't, then likely Bitcoin can head to 62k which would be the measured move on the macro Head and Shoulders in the prior study here.
In the meantime, lots of uncertainty in the markets, that could drive prices either way in the short term.
Today we have FOMC and although there is a 97% chance they do not cut rates, Powell's comments will be important and may move the markets depending on how hawkish or doveish he sounds.
With war tensions in the Middle East and Iran's escalatory language, Market participants are staying out as they don't like uncertainty.
On the other hand, hearing rumors that the US is buying Japanese yen to help prop up their currency and potentially start the money printer which would be bullish.
The DXY is also heading down, and if it breaks the 95 level then typically we enter another bullish phase as we saw in 2021.
Let me know your thoughts!

All the Rate Changes and their effect on BITCOIN Price
Make of it as you will but do note, there are occasions where Rate ROSE and so Did Bitcoin PA
There are occasions were Rate Dropped and Bitcoin Did not. or it Did.
Conclusion....
Bitcoin Will do what it will anyway

Very Quick $ hour BITCOIN Update
So, Looks like Bitcoin is heading towards that intersection of 3 lines of resistance, a point of Least resistance.
And PA is perfectly poised just below , ready to make apush higher if the FED s [eech later today if considered Favourable/
No Change is expected in the Rates.....
We wait till Mr Powell tells us what the Group of private Bankers has decided.

5-Day Gaussian Channel Showing Likely 50% - 60% Bear DeclineAnd this chart of the 5-day gaussian Channel we can see that in Prior Cycles once price action has dropped below the lower edge of the gaussian channel and it's turned red typically it then drops 50 to 60% before recovering and putting in the bottom.
This also happened in the 2014 cycle from October 2014 to October 2015 when the recovery was complete, and after going down 60% also.
We can see either there's consolidation above the lower band of the Gaussian channel before the major breakdown, or it appears to be acting as resistance this cycle.
Either way, the Gaussian channel (5-Day) has flipped red and is rolling over indicating a deeper pullback for Bitcoin from here.
Typically there are counter Trend rallies so I am also looking for $74k to provide temporary support at the prior High of last cycle and the Breakout Zone from November of 2024.
And in my prior study here on the monthly chart, we can see that a head and shoulders breakdown measured move could take Bitcoin to 62k. Those are certainly possible.
Anything can happen here, but with the government shutdown, the failure to pass the Clarity Act, raising tensions in Iran, and economic worries, we could see a rapid unwinding of the Bitcoin price and potentially taking us down to the 38,000 level by July according to this chart.
Typically the midpoint of the box that I've drawn and price Cycles is where the bottom is in, and it takes just as long for the Gaussian channel to turn from Red back to green.
With so many factors that play, it's impossible to know which way this goes.
I am also starting to play around with options on crypto, which are available on the CME now and through TradingView's brokerage partners. Currently BTC, ETH, and XRP.
So we'll be looking to put on put spreads or even naked puts on these countertrend rallies in the greater scheme of things. I still think we could hit new all-time highs by the end of this year.
Let me know what you think, and if I've missed anything.
Cheers,
Brett

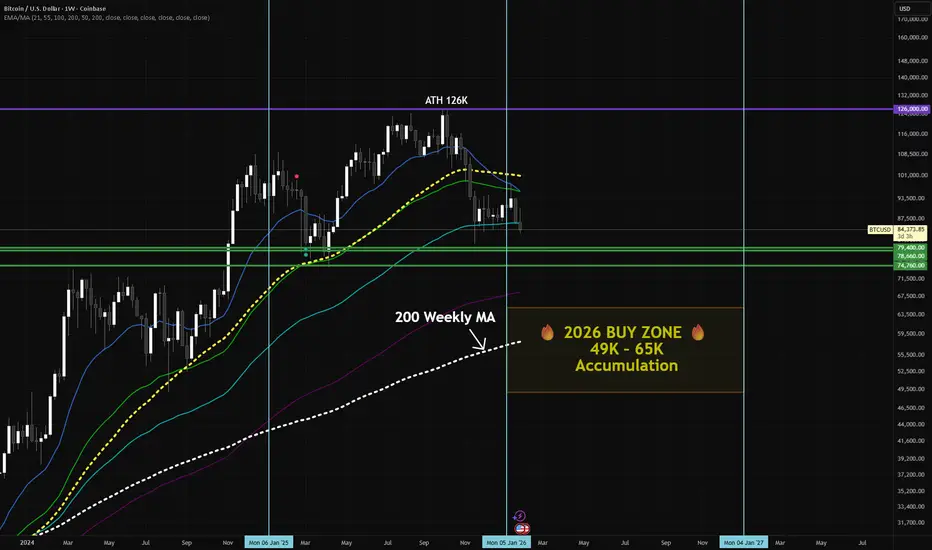
BTC Weekly Update – January 2026Current positions highlighted on the chart: 74K–79K , which are holding as near-term support.
I also have longer-term DCA positions not shown here.
Key 2026 accumulation zone: 49K–65K, near the weekly 200 MA, which has historically acted as long-term support.
BTC has recently pulled back from the 2025 peak (~126K) and is consolidating in the mid 80K range. Holding these support levels will be important before potential moves lower toward structural long-term support zones.
For educational purposes only – not financial advice.
Bitcoin - This chart is not bullish yet!🎲Bitcoin ( CRYPTO:BTCUSD ) still remains beairsh:
🔎Analysis summary:
Bitcoin remains in an underlying bullish market. But looking at all the recent retests of resistance, it becomes quite likely that this is not the end of the bearmarket yet. Bitcoin will most likely create another move of -35% first in the next couple of weeks.
📝Levels to watch:
$65,000
SwingTraderPhil
SwingTrading.Simplified. | Investing.Simplified. | #LONGTERMVISION

BTC Next leg downI had a previous chart from early 2023 where I predicted BTC price movement based on previous cycles. (yellow bars)
In this chart I expected a double top around ~225k. We never reached that high and there have been many reasons for it over the past year especially. Sometime in 2025 when we hit our double top around ~125k I figured this was it. I adjusted the price estimation (yellow bars) down to match the new top.
The time axis was still pretty spot on. This is reinforced by the blue date range bars at the top as well. So I'd say we are getting ready for a big BTC sell off this year, heading toward mid ~30k

BITCOIN - time to buy BTCUSD nowBITCOIN (BTC/USD) has recently been stuck inside a triangle channel pattern and has struggled to break out for a few weeks. However, the price has recently broken a strong resistance level (the white trend line shown on the chart) - The price is currently above the trend line which acted as a strong resistance level and is now very likely to hit the next resistance zone which is labeled as the take profit level. Buy BTCUSD now!

Bitcoin Squeeze Point – Breakout or Breakdown?Bitcoin is approaching a key inflection zone where the Daily Downtrend Resistance and the Monthly Uptrend Support intersect. This confluence could be setting the stage for a major breakout or breakdown, and the next move could define BTC’s medium-term trend.
🧠 Key Levels to Watch:
Daily Downtrend Resistance (Red) – Price is testing this descending trendline again.
Monthly Uptrend Support (Green) – Strong support held since August 2024.
Fibonacci 0.5 Level (~79.3K) – Acting as mid-zone control point.
Fibonacci 0.618 Golden Zone (~72K) – Strong historical retracement support.
🟦 Bullish Scenario (Blue Arrow):
If BTC breaks above the daily downtrend and holds above the green uptrend line:
Possible target: 110K, aligning with the 1.0 Fibonacci extension.
Would confirm continuation of the larger bullish trend.
🔻 Bearish Scenario (Not drawn but implied):
If BTC breaks down below 79K and the monthly trendline:
Eyes on 72K for a potential bounce at the 0.618 Fib level.
Below that, potential deeper retracement toward the 65K–60K zone.
⏳ Conclusion:
BTC is sitting at a high-confluence zone. This is not the time to chase—wait for confirmation of breakout or breakdown before reacting.

BTC Bitcoin MONSTER Trade in Play | Planning Our Next MoveIn this video, we continue managing our BTC Bitcoin MONSTER trade 🥇💪. We break down our strategy and how this can be a lifge changing opportunity.. now planning our next move. Price is printing clear higher highs and higher lows on the 30-minute chart ⏱️📊, and we’re looking to capitalize on the next swing high and retracement.

TRON Price Analysis: TRX Shows Strength as the Market Stalls* TRON is one of the few major coins showing real strength while most of the market is stuck moving sideways.
* On-chain data backs that up, with TRON maintaining strong usage and steady transaction activity.
* From a technical point of view, the chart indicates the TRX price could push higher if key support continues to hold.
If we look at what TRON has been doing recently, the first thing that stands out is how different it feels compared to most of the market. While Bitcoin has been drifting sideways and many large caps look heavy, the TRX price has quietly been pushing higher.
It has not been a move that dominates headlines, but in this kind of market, it matters.Instead of breaking down or chopping aimlessly, TRX has been showing a steady, controlled advance, which already sets it apart from most majors right now.
TRX worked its way toward the $0.31 area before pulling back. What matters is how it behaved after. Rather than selling off sharply, the TRX price found support in the $0.295 to $0.300 zone and started holding there.
That area has become the anchor for the current structure. Each dip into it has attracted buyers, and price is no longer printing lower lows like weak coins usually do. Instead, it looks like the market is using that zone as a base while it decides the next move.
Zooming out, the broader trend still points higher, with the $0.27 to $0.28 region acting as deeper support. Even after failing to clear the $0.325 area earlier, TRX did not damage its structure. It looks more like a pause than a reversal.
Momentum supports that view. RSI has cooled into neutral, and on lower timeframes, MACD is starting to turn back up, which indicates buyers are quietly returning.
What adds confidence is what is happening beyond price. TRON’s network activity remains strong, with millions of daily transactions and a stable market cap. That usually does not line up with a market preparing for a major breakdown.
Right now, TRX is not telling a breakout story. It is telling a strength-in-a-weak-market story. And in a market where most assets struggle to show direction, that already makes TRON worth paying attention to.
If the TRX price can stay above the $0.295 to $0.300 zone, the bullish structure remains intact. A push above $0.32 would be the level that really puts TRON back on the radar.

BTC - an ICT and Wyckoff illustration of the current rangeWe have a lot going on in this chart, so let's simplify it.
When you start looking at time based liquidity, the charts simply start making sense... I have a completely free indicator called "Time Liquidity a Zulu Kilo Indicator" that will help you make sense of ICT much faster than any other indicator.
-We have consolidation which is a tell-tale sign that large hands want to control a very specific area, which will be extremely important in the future (for a far bigger move).
-Price manipulated above a previous monthly high, into a higher timeframe weekly FVG, which then reversed and created an IFVG while simultaneously creating displacement down AND confirming below a CISD level.
-This is also setting up a type 1 distributive Wyckoff schema, with the UT (upthrust) as the manipulation, the Wyckoff upper range setting the tone for a return to OTE (optimal trade entry).
Pretty much every check box has been checked for us to be able to take a short position from 93k to 96k.
-Manipulation above a higher timeframe (in our case monthly) into a high timeframe FVG - CHECK
-Price broke below the displacement created on the way up (iFVG), and then created displacement to the downside (FVG) while broaching the CISD (Change in state of delivery / which is yet another validation of bearish intent). CHECK
Price should now retrace into the 68% - 79% OTA (optimal trade entry) and reverse below the yearly open.
As I've previously written on this subject, I believe that we have one more strong bullish move before a much deeper, larger and significant Bitcoin crash THIS YEAR that will test around the 50k price levels...
We WILL be looking for bullish moves below 74,500 (another manipulation possibility below the yearly lows).

BTC/USD BUY SIGNAL – Support + Fake out Reversal Setup On the 4h Bitcoin chart, price has wicked down sharply into the major support zone around 87,000 – 87,866, forming what appears to be a classic fake move / liquidity grab below the channel bottom (blue shaded area + dashed trendline). This is often a bullish trap before reversal. Key Bullish Points: Strong horizontal support defended multiple times (gray box ~87k–91k)
Clear down-channel fake out / sweep of lows
Rejection candle + bounce already forming from the lows
Higher timeframe structure still bullish overall
Entry: Buy around current levels ~87,866 or on dips back to 87,000–87,500
Stop Loss: Below the wick low ~86,800–87,000 (tight risk)
Targets: TP1: 90,000 – 91,000 (channel top retest)
TP2: 92,500 – 93,000
TP3: 95,000+ (previous highs)
High-probability reversal setup if price closes back above the channel bottom. Watch volume and 4h candle close for confirmation. This is not financial advice. Crypto is highly volatile. Use proper risk management and trade at your own risk.
#Bitcoin #BTCUSD #BTC #BuyBitcoin #BitcoinDip #CryptoTrading #Fakeout #LiquidityGrab #BullishReversal #TradingSignal #Crypto #TechnicalAnalysis #Investor #TradeSmart #BitcoinBull

GOLD, DXY and BITCOIN on the same month chart- who wins ?
GOLD is shown as the solid YELLOW line
DXY USD is the GREEN Bars
BITCOIN, the Orange Bars
The chart says it all
GOLD Could be the winner, it holds Value better than any......and that Hurts me, as a Bitcoin MAXI, However, the gains with Bitcoin Versus Gold, on Bull Runs, is unbeatable, 254% over Gold in the recent Bull run. .....But Bitcoin has a habit of - 80% Losses.
GOLD does not do that
The DXY however, lost value to Gold as soon as it walked away from the "Gold standard" in 1971.
And it continues to do so. That GOLD PA is GOLD USD.....see how Far Gold has gone Above the $ !
The ONLY thing that has given Gold a "Run for its Money" is BITCOIN.
Lets look closer.
Bitcoin was below Golds value for the first 8 years of its existence.
Then suddenly, in 2017. Boom, Bitcoin potential showed itself and Rose above Gold for a short while.
Gold and Bitcoin Value then Yo yo'd for nearly 4 years and then in late 2020. Bitcoin took off and has been Above Golds Value ever since.
And with the recent surge in Gold price, "The Catch Up" I call it, We now See GOLD and BITCOIN on a head to Head for Value.
The Last time these two were so close was at the Bottom of the Bitcoin bear market in 2022.
Could this be a sign that the Bitcoin Bear market is over ?
Could be.
So, whats Next ?
GOLD is VERY Over Bought
BITCOIN is OVER SOLD
DXY is in Deep trouble ( as pointed out in a post earlier this morning )
CONCLUSION
GOLD has cought up with the New Kid on the block, has shown incredible strength and looses less value on pull backs. A truly international Asset.
BITCOIN has bigger gains in bull runs and Larger Losses in Bear markets......Usualy.......If we are currently at the Bottom of a Bitcoin Bear market, as some suggest, this pull back has been 30% SMALLER> Bitcoin retains more value gut we need confirmation of this........BITCOIN has yet to be adopted by other countries around the world as much as it seems to have been in the USA.
DXY sailing into headwinds and with no real Magical solution to regaining the Value it has lost compared to other assets.
The WINNER ?
It is either Gold or Bitcoin, depending on your trading strategy.
But the next few months will certainly make this easier to see...
Should GOLD overtake Bitcoin for the first time since 2020, then that will show a WEAKNESS in Bitcoin.
I cannot wait to see what happens>>>>>>>>>>>>>>>>>>>>>>>>>>>
I BUY BOTH

BTC/USDT - Bitcoin H1 | Continuation Pattern Signals Downside📝 Description🔍 Setup (Technical Structure) BINANCE:BTCUSDT
BTC/USDT is forming a classic Bearish Pennant pattern on the H1 timeframe.
After a strong impulsive sell-off (flag pole), price consolidated inside a tight pennant structure, showing lower highs and weak buying pressure.
Price remains below EMA & Ichimoku cloud, confirming bearish control and continuation bias.
This structure typically favors trend continuation, not reversal.
📍 Support & Resistance
🔴 1st Support: 85,800 – 86,000
🔴 2nd Support (Flag Target): 84,000 – 84,200
🟡 Pennant Resistance Zone: 90,500 – 91,000
Flag-pole height projection aligns with lower support targets
#BTCUSDT #Bitcoin #CryptoTrading #BearishPennant #PriceAction #TechnicalAnalysis #TradingView #Kabhi_TA_Trading
⚠️ Disclaimer
This analysis is for educational purposes only.
Crypto markets are highly volatile — always manage risk and use proper position sizing.
💬 Support the Idea 👍 Like if you’re bearish on BTC
💬 Comment: Continuation or fake breakdown? 🔁 Share with traders watching Bitcoin

BTC Opened LONG positionOpened LONG position on BTC
Expecting price go towards $100+k by plan.
All trade plan is on the chart.
Are You Longing or Shorting BTC? Drop Your ideas in comments, friends!
Good luck and have fun!

Bitcoin: Rejection Confirms Corrective ContinuationBitcoin’s latest daily close confirms the risk scenario outlined in the prior 4H analysis (Article found in related publications). Rather than reclaiming the rising channel and re-establishing upside momentum, price retested the channel boundary, failed to break above it, and rotated lower, a development that materially shifts near-term expectations while leaving the broader macro framework intact.
From Retest to Rejection
The earlier analysis stressed that price needed to quickly break back into the channel to validate a renewed impulsive advance. That condition was not met. Instead:
The channel acted as dynamic resistance, not support.
The retest produced rejection rather than acceptance.
Downside continuation followed immediately, confirming the rejection.
This behavior is consistent with a market still engaged in corrective price discovery, not trend resumption.
Daily Structure: Correction Extends
On the daily timeframe (Picture A), Bitcoin now appears to be transitioning deeper into its corrective phase. The failure at channel resistance aligns with an unfolding wave C / wave (4) extension, rather than the start of a new impulsive leg.
Key structural implications:
The prior bounce is best interpreted as a counter-trend reaction, not wave initiation.
Price remains vulnerable to further downside toward the 0.618–0.786 retracement cluster, which continues to define the primary corrective target zone.
Momentum indicators rolling over from elevated levels reinforce the rejection narrative.
What Did Not Happen Matters
Just as important as what price did is what it failed to do:
No sustained acceptance above the channel.
No impulsive structure on the breakout attempt.
No confirmation of higher-high continuation.
These absences materially weaken the short-term bullish case and argue for patience rather than anticipation.
Risk, Invalidation, and Macro Context
While the near-term outlook has softened, it is critical to distinguish delay from invalidation. The long-term bullish count remains intact as long as price holds above the macro invalidation level. A deeper corrective move—even toward the lower highlighted targets—would still fall within the bounds of the broader Elliott Wave roadmap established in late 2025.
Only a decisive breakdown through long-term invalidation would force a reassessment of the macro thesis.
Bottom Line
Bitcoin did exactly what the risk scenario warned it might do: test resistance, fail, and roll over. Until price can reclaim and hold above the channel, the path of least resistance remains corrective.
This is not trend failure—but it is trend postponement.
