BTC/USDT – WEEKLY ANALYSIS (W1)🔵 BTC/USDT – WEEKLY ANALYSIS (W1)
Structure: Elliott Wave 5 (current wave = (4) correction)
This updated version of your chart adds Fibonacci extension targets for Wave (5), giving a much clearer projection.
1️⃣ Wave (4) Is Near Completion
Price has:
✔ Dropped sharply into the BIG Liquidity Zone (80k – 83k)
✔ Swept long-term trendline liquidity
✔ Tagged the 0.9 retrace marker (typical deep wave-4 behavior)
✔ Formed a weekly BOS during the drop
✔ Entered a historically strong demand zone
This fits perfectly with a complex corrective Wave (4).
2️⃣ Expectation: Reversal Soon
Wave (4) typically ends:
At big liquidity
At the trendline
Before violating Wave (1) territory
After a weekly BOS + wick
Your chart shows all these ingredients → a bottom is likely forming inside 80k–83k.
A bullish engulfing weekly candle here = wave (5) confirmation.
3️⃣ Wave (5) Target Zones (Fibonacci Extensions)
Your chart shows 4 major upside levels:
🎯 Target 1 — 100,757
First reaction level.
This is the 1.0 extension zone — often the first major resistance.
🎯 Target 2 — 109,998
Strong historical resistance + 1.272 extension.
Wave 5 usually passes this easily if momentum is strong.
🎯 Target 3 — 124,069
Major mid-range target.
This is where Wave 5 often pauses or makes a micro-correction.
🎯 Target 4 — 140,241 (−0.272 Fib)
This matches perfectly with standard Wave-5 overextensions.
Final upside zone before a large cycle top.
This is also the level shown at the top of your chart — very good placement.
4️⃣ Summary: BTC Weekly Outlook
✔ Wave (4) in progress but almost complete
✔ Liquidity grab is textbook
✔ Next move = impulsive Wave (5)
✔ Upside targets: 100.7k → 110k → 124k → 140k
✔ Macro trend remains strongly bullish
BTC is following nearly perfect Elliott Wave symmetry from your W1 structure.
Bitcoinprice

Bitcoin is in a clean daily downtrend right nowBitcoin is in a clean daily downtrend right now – every bounce is just providing fuel for the next leg until the structure says otherwise.
Good evening traders, Brian here with a higher-timeframe look at BTCUSD.
Fundamental analysis
Bitcoin has been under sustained pressure even as some funds continue to accumulate spot positions. A few key points:
Macro uncertainty and tighter dollar liquidity are weighing on high-beta assets. While gold has held up relatively well, the performance gap between BTC and XAU has been widening in recent weeks, highlighting a clear risk-off tone towards crypto.
On-chain and fund flows suggest that a number of crypto investors are actually de-risking and pulling capital out, which reduces market depth and makes downside moves more violent when liquidity is thin.
Narrative is still mixed: long-term holders and some institutions are happy to buy lower, but in the short term the order flow is dominated by forced selling, deleveraging and risk reduction.
Bottom line: the macro backdrop does not yet justify an aggressive “buy the dip” approach on BTC. Trend-following shorts remain safer than trying to call the bottom.
Technical analysis
Daily structure is clearly bearish:
We have a confirmed market structure shift on the left of the chart, with the prior higher-low support broken and a series of decisive lower lows since then.
The main bullish trendline from earlier in the year has given way, and price is now travelling within a steep descending leg.
BTC recently tagged the 1.618 Fibonacci extension of the last major swing, aligning with a prior liquidity pocket. That produced a sharp intraday bounce, but so far it looks like a reaction inside a downtrend, not a full reversal.
Around 75.4k we have an important daily support zone. If this level is broken and accepted below, it opens the door to a deeper flush towards the next large support band lower on the chart.
Overhead, there is a clean imbalance/FVG and prior distribution area around 108k, with an intermediate resistance block around 96–97k and a nearer supply zone around 88k. These are prime locations to look for fresh shorts if price retraces.
For now my bias is simple: look to sell rallies into premium levels; any longs are tactical, short-term trades off key support only.
Key levels
Resistance / short zones:
88,000 – first reaction zone, “pay attention to the reaction”
96,500–97,200 – main short entry area for medium-term positions
108,000 – higher FVG / major daily supply
Support / long-only intraday zones:
75,400 – key support + 1.618 Fib/liquidity zone
74,000–72,000 – deeper support if 75.4k fails
Trade scenarios (for reference, not financial advice)
1. Short the first meaningful pullback – 88k area
Entry: 88,000
Stop: 90,000 (above local structure)
Targets: 82,000 → 78,000 → 75,500
Idea: treat 88k as the first supply zone in a downtrend. If price bounces from current levels and stalls here, I’m looking for rejection (wick rejections, failed break, or a clear shift in intraday structure) to join the trend. Once price moves in favour, I would look to pull the stop to breakeven and let the position run.
2. Core swing short – 96.5k–97.2k zone
Entry: 96,500–97,200
Stop: 99,000
Targets: 88,000 → 82,000 → 75,500
This is my preferred “medium-term” sell area. It aligns with a more significant daily supply block and offers better risk–reward if the larger bearish leg continues. Any squeeze into this region after a series of lower lows is, in my view, a controlled opportunity to reload shorts.
3. Tactical long only at deep support
Entry: 75,400–74,800
Stop: 73,800
Targets: 82,000 → 88,000
Here I would only consider a short-term long if we see a clean liquidity sweep into the 1.618 extension and strong rejection (long lower wicks, aggressive buy-back). The idea is simply to trade the bounce back into resistance, not to fight the higher-timeframe downtrend.
If BTC loses 75.4k and starts closing below it on the daily, I would become much more cautious on any long exposure and focus almost entirely on short setups towards the lower “important support” zone on the chart.
Trade with the trend, respect your risk, and don’t get trapped trying to be a hero at the bottom of a falling market.
If this BTC breakdown adds value to your plan, make sure you follow Brian for more daily BTC and gold analysis, and share your own view in the comments so we can compare scenarios.

BITCOIN Next Weve Hello everyone, I hope you are all well
Today I will share with you my prediction for the next price movement of Bitcoin. I predict that the price has reached its all-time high. I previously shared an idea illustrating this; please review it below. I predict that we will see a final price rebound, as shown in the analysis, followed by a sharp drop to the targets outlined above.
This is not investment advice; please take full responsibility for your buying and selling decisions.
Warning: Be careful not to use this idea with leverage, as you could lose all your money

Spot + Hedge — The Fundamental Framework for Investors Who TradeYou don’t have to treat holding and trading as two separate worlds. The most effective market participants combine both. They anchor their strategy in long-term conviction while using short-term tools to manage volatility and protect capital. This balance allows them to participate in structural growth without exposing their portfolio to unnecessary drawdowns.
Spot holdings are the foundation. A well-built spot position compounds through cycles, absorbs volatility, and benefits from every wave of adoption that pushes the market forward. Staking adds an additional layer by generating yield during periods of consolidation. For traders who think in cycles rather than days, spot is the engine that keeps building value in the background.
A hedge position serves a different purpose. It is not designed for aggressive speculation. It is a tactical layer that reduces exposure when conditions become unstable. Futures shorts, when sized properly, act as a defensive tool that preserves the value of your long-term assets without forcing you to sell them. This approach keeps you invested while giving you room to breathe during sharp corrections.
When hedging makes sense:
– After a strong rally pushing into major resistance levels.
– When funding rates are extremely positive and the market is crowded with leveraged longs.
– When macro data shifts, liquidity tightens, or a regulatory event increases uncertainty.
– When your portfolio has grown significantly and you want to lock in part of that increase without taking profits.
The purpose of the hedge is stability. You are not aiming to turn the short into a profit engine. You are using it as portfolio insurance. A well-timed hedge limits the damage during pullbacks and keeps you positioned for the next leg of the cycle.
Simple implementation example: assume you hold $20,000 of ETH spot as your long-term allocation. To hedge, you short 25–30 percent of the position using ETH perpetual contracts. If ETH drops 10 percent, the hedge cushions the downside by generating gains on the short. If ETH continues rising, your spot position captures the upside and the hedge becomes the cost of protection, similar to an insurance premium.
This framework helps traders stay in the market, avoid emotional exits, and preserve capital during volatile periods. It combines conviction with discipline and gives long-term holders a practical way to navigate uncertainty without breaking their overall strategy.

BTCUSD Head & Shoulder - The last chance for an Alt Season Alright this is my....I'm pretending to have a crystal ball and giving myself a bit of hopium post....
Looks like bitcoin is going to create some type of Head and Shoulders over the next few weeks if we hold/bounce on the 78K area.... This I dont care about...lm all out of my low and mid term bitcoin holdings....
What I do care about is that during that creation of the right shoulder it could be the time/chance that we could see a potential time frame for a last ditch effort for a potential "Alt Season" this cycle.
While BTC heads back up to just above the psychological barrier of 100K...Alts start ripping really hard.... everyone is all excited that alt season is here, and everyone thinks BTC will keep going up but all the attention will be on alts....ignoring the Head and Shoulder formation on BTC and alt season as well as BTC above 100K will come and go in less than 100 days from start to finish.
But thats just like.....my opinion maaaaaaaaannnnnn.

Bitcoin BTC Bullish Structure Break with Key 61.8 Level in FocusBitcoin is showing early signs of strength, with a clear bullish shift in structure on the 30-minute timeframe 🚀. With that momentum coming in, the main level to watch now is the 61.8% Fibonacci retracement of the current price swing.
A potential buy setup becomes valid only if price pulls back and holds above the 61.8 level 🔥. Holding this zone would signal that buyers are stepping in and maintaining control of the move. If price respects this level and continues to break structure to the upside, the bullish continuation becomes much more probable.
If Bitcoin breaks below the 61.8 retracement, the idea is invalidated and should be abandoned. At that point, momentum would no longer support the long bias ⚠️.
Not financial advice.

IM BUYING THE DIP ON BITCOINIM BUYING THIS DIP ON #BITCOIN 📈
Following my plan, level by level!
Later Shorter are gonna be REKT in my opinion! 🔴
That 0.786 fib level daily, will likely act as bottom for tonight! 📈
#BTC price is also on key dem support + highly oversell (H1) & ichimoku.
I wont be surprise to see a bull trap & fake test of the previous levels.
89,000 - 90,000$ next 📈🎯 , Then dump toward 84k- ?
A retest of the 100k previous key support before to see another crash could also be a possibility!? 👀

BTC - UPDATESorry to say I was right again...
CRYPTOCAP:BTC - Bearish correction weekly ongoing & very bearish bias as I explained 📉
Large cap / Medium Mcap #alts money outlflow 📉
I showed you live that it was likely a bearish trend shifting & trend reversal on the weekly outlook, and here we are!
Supports are now weak.
Key levels to watch:
$100,000 - 101,000❌
$95,800❌
$92,000 ❌
$87,000- 88,000 🎯 ⏳
$84,000🎯
$79,000 🎯
$74,000 - 75,000🎯
🟩Following my bias,Monthly momentum remain bullish, and that could just be a bearish correction before to see a new ATH.
Bull setup valid if it hold above SSB (W) at 79,000 or at least 74,000$ low.
🟥On the other hand; If bulls ar unable to hold above 74,000$ support, then #BTC price could dip much lower & momentum could stay bearish for many month.
Worst scenario -- > 63k --> 50k --> 45k - 42k 😱
At the moment, my strategy is to focus on #alts market with solid PA against #BTC such as CRYPTOCAP:ICP or CRYPTOCAP:FARTCOIN , because there are great chances to see big move when #BTC price will stabilize! 📈
Not a financial advice, cautious in this volatile market.

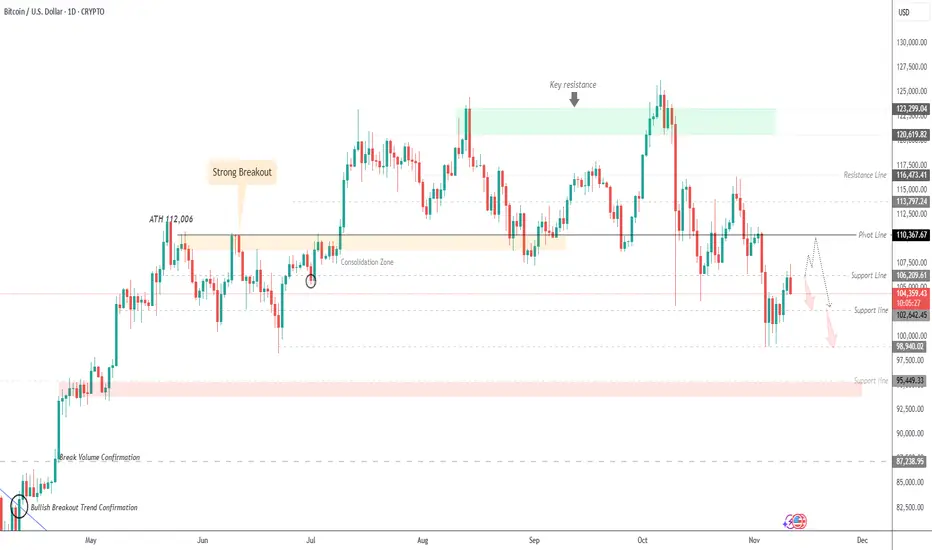
Geopolitical Shock Hits Bitcoin | Traders Eye 106.20K Key Level BITCOIN (BTCUSD) | Overview
China Accuses U.S. of Seizing $13B in Bitcoin as Tensions Escalate.
A long-running Bitcoin mystery from 2020 has resurfaced — this time involving a geopolitical twist.
China has accused the United States of secretly taking control of 127,000 stolen Bitcoins, valued at roughly $13 billion, in what could become one of the most controversial crypto disputes to date.
The allegation has added fresh strain to the already tense relationship between the two largest global powers, fueling uncertainty in both crypto and broader risk markets.
Technically:
Bitcoin shows signs of bearish momentum, with price action likely to retest 102.64K.
A confirmed break below this level could extend the decline toward 98.94K and 95.50K.
However, if the price closes a daily candle above 106.20K, it would signal renewed bullish momentum, targeting 110.36K, and potentially 113.80K on further strength.
Pivot Line: 106.20K
Resistance: 110.36K · 113.80K · 116.40K
Support: 102.64K · 98.95K · 95.50K
Outlook:
Bitcoin remains bearish while below 106.20K, with downside potential toward 102.64K – 98.95K.
A confirmed daily close above 106.20K would shift momentum to bullish, opening the way toward 110.36K – 113.80K
previous idea:
BITCOIN:LIVE TRADEHello friends
considering the decline we had, the sellers made a bottom and the buyers came in. The sellers again broke the previous bottom with strength and made a bottom, and the buyers came in and raised the price and succeeded in hitting a higher ceiling.
And in the pullback, the open price is supported and here we can enter a buy transaction considering the support of buyers and hitting a higher ceiling, of course with risk and capital management and be careful not to make emotional decisions.
*Trade safely with us*

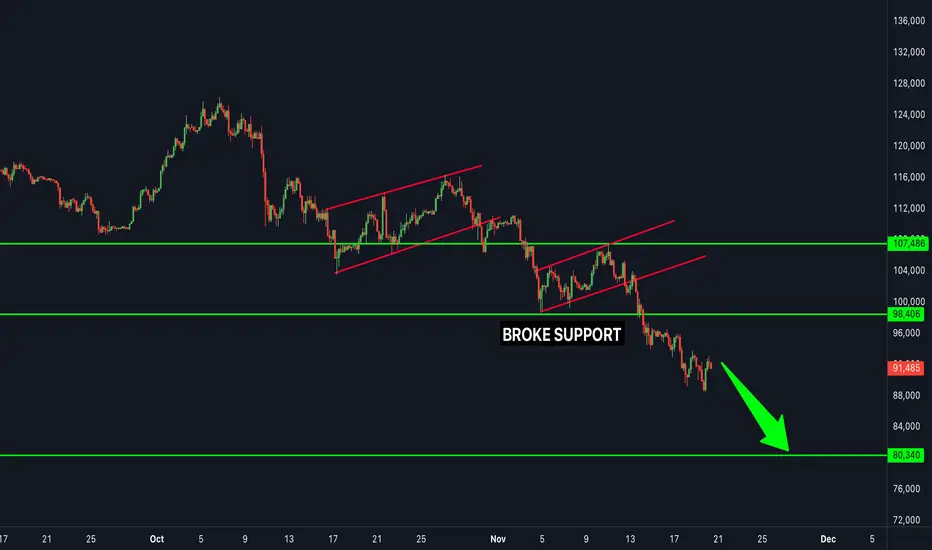
BTCUSD (Bitcoin) has broken powerful support = Time to sell!BTCUSD (bitcoin) has been in a new bearish trend for the last few weeks and has just recently broken a major support level which is shown (white line drawn) .. it has also broken the support level of an upward channel (the 2 red trendlines) ... The next very likely outcome for bitcoin is for it to hit and test the next support level all the way to the downside. SELL NOW!
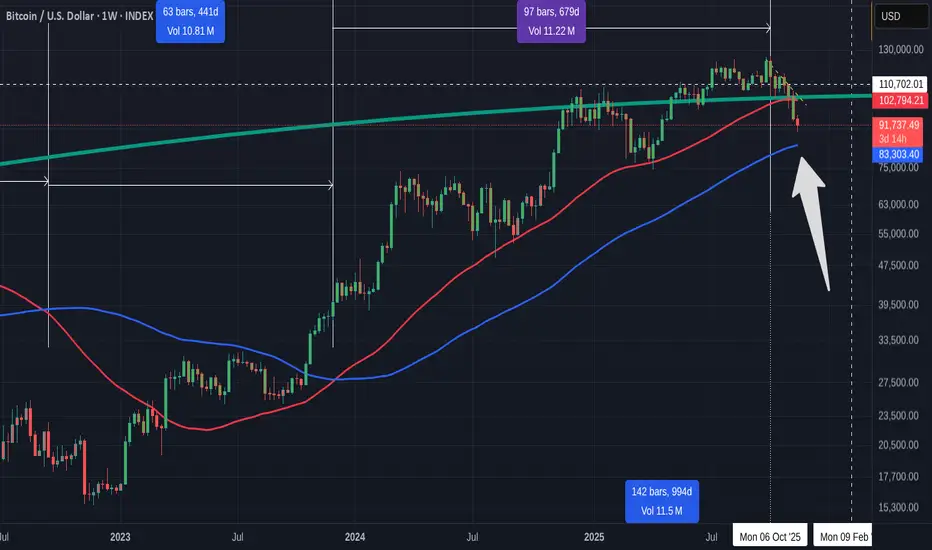
Bitcoin Weekly SMA - Next Level support at the 100 SMA 83K and..** Candle Colours are effected by a Bull Bear indicator, indicating Bull Bear sentiment...
Note THIS week is the First BEAR week Candle in a very long time, since March 2025
Bitcoin Lost the 50 SMA ( RED ), first time this Cycle.
And we see the 100 SMA ( BLUE ) running parallel and so, this s logically the next level of support should we drop lower.
What is the relevance of the 50 & 100 SMA to Bitcoin PA
This is the Bitcoin Chart since December 2013
The Labels above are the day counts from ATH, to the SMA crossing Bearish ( 50 dropping below the 100
To when the SMA cross Bullish ( 50 rises back above the 100 ) and then to ATH
The Lower day count is from when the 50 crosses above the 100 to when it crosses back below.
And Many things point to the fact that we may well have past the ATH point and are now entering the Bear Market.
Loosing the 50 backs this up to many extents.
So now we look to the 100 to see if PA holds 83K or not.
Interesting to note, that because of how Calmly this "Cycle" has preformed ,, Haw parallel the 50 and 100 are to each other, we are reaching gown to the 100 Much quicker than previous occasions. Very interested to see what happens.
SOPR has just flashed a BEARISH signal
People are capitulating, selling in Fear and making Losses.
A Sure sign of the BEAR.
But there Many things that support the idea that this is NOT the end of this Run to True ATH.
For me, this is helped by the fact that the RSI is so near OVERSOLD that it will RISE.
Not a Guarantee though
But we also have the Weekly MACD down low too
You can see on this chart how the Histogram tends to find support on this level
The MACD line has Crossed below Neutral.
We are in an area for a bounce.
This may not happen and it is impossible to predict this
We need to continue watching and see where the PA goes on that 100 SMA
I have been doing TA for many years now and I have to say, this time, Things are a lot more conveluted than normal..Many conflicting signals....
We have Short Term and Long Term ideas presenting cases for both Bullish and Bearish scenarios.
So, We wait to see what happens on the 100
Look at the Long Term chart and see what happens when the PA crosses the 100 ( Blue )
We need that Bounce for the Bulls
PA Drops below, BEARS
BITCOIN (BTC/USD): Classic Bullish Pattern: Bulls Eye 96kBitcoin recently approached a significant horizontal support level.
Following this, the price formed a bullish imbalance and broke above the resistance line of a falling parallel channel, closing above it on a 4-hour timeframe.
We may anticipate further growth in the Bitcoin price, with a potential goal of 96,000.

BTC: 2021 playbook. People expect a V shape bounce, when I think the odds favor more of a 2021 type of long correction (death cross swing). Reason being, the break of a strong momentum log trend, lower lows in BTC/SPX.
If we are on the bottom --> it took 2 months , before next break out. (20 May -> 20 July).
I think most momentum stocks, like NASDAQ:PLTR , NASDAQ:HOOD should lose their momentum and form tops (people who didnt sell the top, should take profit next time it's at ATH). Stage cycle.
BTC is a risk on indicator. TVC:DXY dollar has broke out, indicating demand for cash.
//November is usually a strong month. Good news - stocks drop is a sign of top.

Bitcoin Downtrend UpdateAlright friends, Bitcoin has confirmed its intention to move toward 86,000 and lower.
My previous forecast with the invalidation zone at 96,600 is still valid, but I decided to make a fresh post.
At the moment, my new invalidation level is 96,012.5.
From a broader perspective, I’m still expecting Bitcoin to reach 83,000.
But as I mentioned earlier, we first need to see 86,000 tested — because once that level is hit, Bitcoin may go into a correction before continuing toward 83,000 and below.
Yes-yes, I do expect it even lower, but more on that in the upcoming updates.
Make sure to follow so you don’t miss them

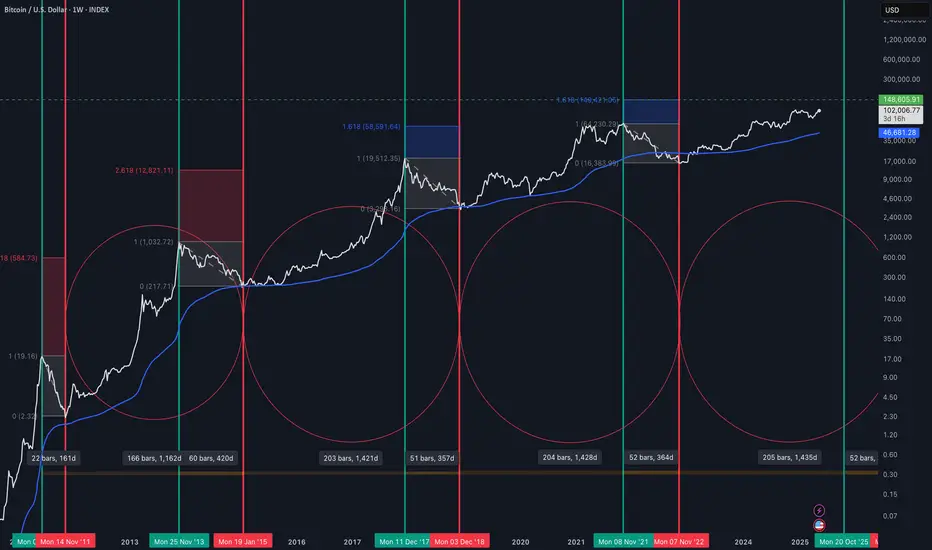
Bitcoin SeasonalitySince 2013, the distance between each Bitcoin bottom and peak is approximately 205 weeks. Similarly, the distance between the peak and the bottom is approximately 52 weeks. In addition, when the Fibonacci correction is applied to each bear season, the new target appears to be the 1.618 region, so Bitcoin currently has the potential to run to 148k. As long as seasonality continues, the peak will come at the end of 2025.
Bitcoin Trending down short entry 89.108
Reaching price at 76s and lower at 55s orange lines use as entry/ exit and re entry long

Bitcoin approaching major buying opportunity of the year!Here we go are you ready for another major buying opportunity in bitcoin! Key levels to watch for. Ignore the fud!

BTCUSD – Potential Buy Zone AnalysisWelcome to my analysis.
This chart provides a long-term outlook on Bitcoin’s price movement.
As observed, Bitcoin experienced a decline after reaching the all-time high resistance level at 125,556. The key support level at 97,458 has also been broken.
From a technical perspective, we now have a potential buy zone within the 50%–61.8% Fibonacci retracement, located between 89,440 and 80,472. This area represents a favorable region for potential entries, with an upside target toward the next major resistance around 131,399.
Good luck and trade safely.

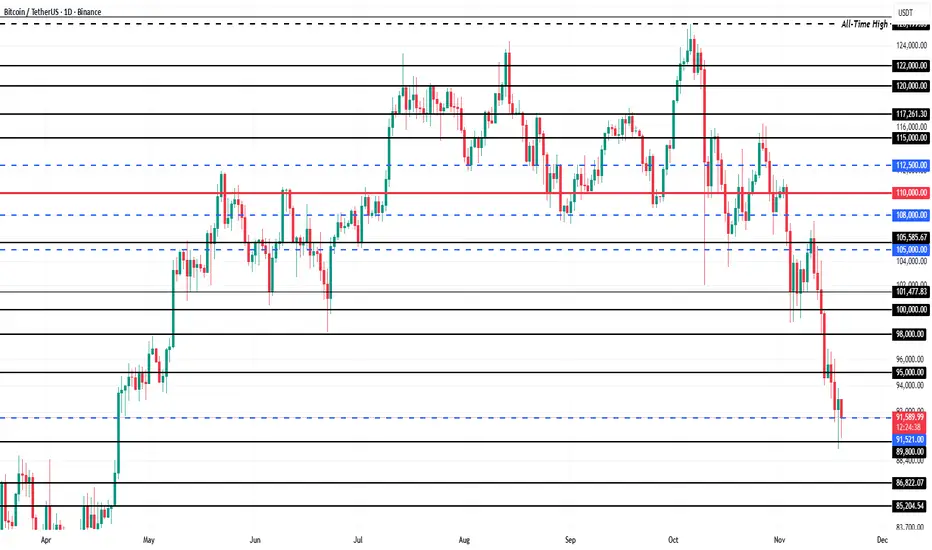
Bitcoin’s Price at $90,000 Is Signaling a Bottom Formation
Bitcoin trades at $90,331 and holds above the $89,800 support level, which has become a key buffer during the decline. The recent drop to a multi-month low has increased caution, but technical and behavioral signals suggest downside pressure is easing.
Based on investor support and historical patterns, a deeper drop appears unlikely. A bounce from $89,800 could push BTC back toward $95,000 as confidence improves. Strengthening demand and exchange outflows reinforce the possibility of a recovery in the near term.
If bullish momentum fades and broader weakness intensifies, Bitcoin could slip below $89,800 and fall toward $86,822. Such a decline would invalidate the current bullish thesis and signal a deeper retracement.
BITCOIN BIG HIGH BUY PROBABILITY SETUP SOON!!!🚨 BITCOIN HIGH PROBABILITY BUY SETUP 🚨
* Here We Can See Clearly The Next Potential Moves For BTCUSD Coming Hours/Days.
* Keep Your Eyes Close On Your Trading Positions.
* Happy PIP Hunting Traders.
FXKILLA.

Thank God, another opportunity to buy Bitcoin is emerging...Bitcoin has clearly entered a downward and corrective phase. It is better to wait for short opportunities. Protect your money from time or price corrections. Thank God, another opportunity to buy Bitcoin is emerging. But now is definitely not the time to buy.

Btc: Yellow vs PinkMy two scenarios are:
- Yellow: around 70k and then we can fly again (70%)
- Pink: we retest 15k and then we can fly again (30%).
As long as we stay above 60k, I think we good.
