Quick Bitcoin Update - Daily Linear chartRefering to my previous post.
RED 236 Fib circle reached
PA reacted before APEX of Squeeze.
This is approaching a VERY GOOD BUYING oppertunity
We may go to 95K and possibly 88K but the Arrow is the Target I am looking at
Time will tell
Bitcoinprice

BITCOIN URGENT UPDATE! Bounce Expected This level is important!IG:BITCOIN Update:
I’ve been saying this for a while: avoid trading altcoins with high leverage in these conditions. If you got caught again, maybe it’s time to pause and rethink the strategy.
Coming back to BTC, we’re close to a 50 EMA crossing below the 200 EMA, but interestingly, these crossovers have often played out opposite to what classical TA suggests.
Right now, BTC is still getting support from the lower trendline of the falling wedge, so while the price action is choppy, it’s not completely bearish yet.
BTC needs to bounce here; otherwise, the setup becomes invalid if we close below 95,785.
DYOR | NFA
#BTC #BTCUSDT
Please hit the like button if you like it, and share your views in the comments section.
Thank you

BTC is going up BTC has the potential to rise from this its curent price of 98292
to 116551 , A key suport level to watch is at 92278. BINANCE:BTCUSDT

BITCOIN Next Weve Hello everyone, I hope you are all well
Today I will share with you my prediction for the next price movement of Bitcoin. I predict that the price has reached its all-time high. I previously shared an idea illustrating this; please review it below. I predict that we will see a final price rebound, as shown in the analysis, followed by a sharp drop to the targets outlined above.
This is not investment advice; please take full responsibility for your buying and selling decisions.
Warning: Be careful not to use this idea with leverage, as you could lose all your money

#BITCOIN Next CycelHello everyone, I hope you are all well.
I wanted to share my prediction for the next cycle and where I think the bottom will
BITCOIN Bottom
SOLANA Bottom

Bitcoin’s Slide to the 100K SideI expect Bitcoin to decline toward 99,999🎯
❌Invalidation Zone: above 105,565.
⚠️This is not a signal — make your own decisions and always trade with stop-losses!)
What’s your view on this setup?
💭Share your thoughts in the comments and follow to stay tuned for what’s next!
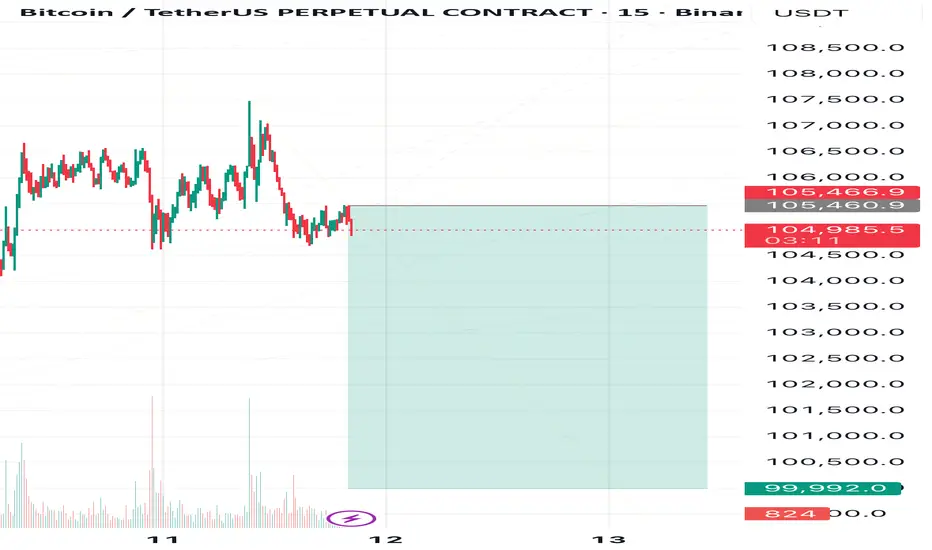
BTC Daily Scene — Still Not GreenAs you know from my previous publication, I’m still expecting Bitcoin to reach 100,000 and below.
The invalidation zone of my previous bearish scenario was 105,465 .
At the moment, Bitcoin tried to approach that zone but failed to even touch it , which only confirms its intention to keep heading down toward my target area — 100,000 and lower .
My global downside target is 83,000 , but for now, I only expect 100,000, since I don’t believe Bitcoin will drop straight to 83K in one go.
⸻
⚠️ Disclaimer:
This is not a trading signal, just my personal analysis.
Always trade according to your own system and use stop losses.
⸻
💬 Follow me so you don’t miss my daily Bitcoin analysis — the story continues!

Swing-trading positions using SOXX (NVDA).If all Risk-on is correlated to NVDA, probably make sense to use NASDAQ:SOXX sector.
Upsloping 10/20 using qullemaggie methodology.
"Tight price range".
Be in small caps with falling VIX, falling yields, falling dollar. And in big tech, with bullish vix.

ANFIBO | Bitcoin BTCUSD - UP or DOWN? [11.13.2025]Hi traders, Anfibo’s here!
BTCUSD – Technical Outlook
Technical Structure:
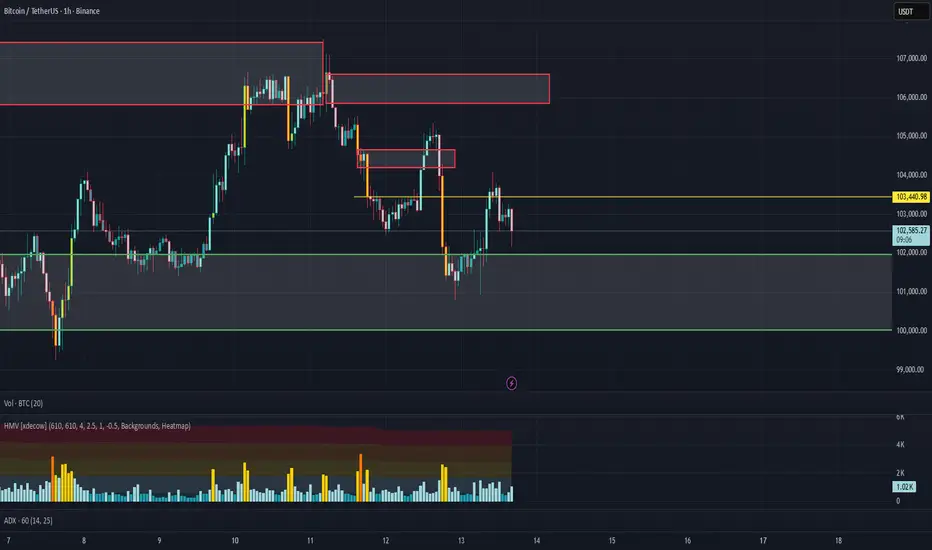
On the higher intraday frame, BTC is running an H1 uptrend — higher highs / higher lows are still intact and the structure favors the bulls. However, on the lower intraday frame (M15) price is trapped inside a short-term descending trend, creating compression between the bullish H1 bias and the bearish M15 micro-structure. That interaction is producing chop around the ~102,000 area and increases the value of waiting for a clean directional resolve (breakout + retest) before committing.
Daily Trading Strategy:
Our approach today is simple and veteran-focused: wait for the breakout of the conflicted edge and trade in the direction of the break after a proper test.
If price breaks up out of the M15 downtrend: wait for the pullback / downtest, then buy near the test level (~102,000).
If price breaks down through H1 support / the current compression: wait for the retest of that broken edge, then sell near ~102,000.
This “break → retest → trade” workflow avoids getting caught in false moves and puts probability in our favor.
Daily Trading Plan:
>>> SELL ZONE:
ENTRY: 101,500 – 102,500 (on confirmed breakdown + failed retest)
SL: 104,500 (above the immediate M15 channel / invalidation level)
TP: 96,000 (TP1) — 92,000 (TP2)
>>> BUY ZONE:
ENTRY: around 102,000 (on confirmed breakout + clean downtest)
SL: 99,500 (below the downtest low / invalidation level)
TP1: 108,000
TP2: 112,000
(Notes on entries: the same ~102k area becomes the decision point — trade only after structure confirms: for buys, look for bullish confirmation on the retest (rejection wick, bullish engulf, rising volume); for sells, look for bearish rejection on retest or inability to reclaim the edge.)
Risk Management:
Keep position sizes small-to-medium while the pair remains in a compressed range; risk 1–2% of equity per full setup.
Use stop losses as listed and never widen SL to “hope” — adjust size instead if you need a wider stop.
Prefer scaling: take a starter size at first confirmation and add only after the trade behaves in your favor (e.g., after TP1 or strong momentum continuation).
Avoid trading into major macro prints or news; if a scheduled event is imminent, reduce size or stand aside until clarity returns.
Conclusion:
Today’s market is a classic “higher-frame bias vs. lower-frame conflict” scenario. The H1 uptrend gives the structural edge to buyers, while the M15 downtrend supplies immediate supply and failure points. The correct, experienced play is to wait — only engage after a clear breakout of the micro-trend and a confirming retest around the decision area (~102k). Whether the trade becomes a buy or a sell, follow the break → retest → confirm discipline, manage risk tightly, and let price prove the direction before enlarging exposure.
GOODLUCK GUYS!!!

Bitcoin Daily back in a Squeeze - WILL react by Nov 25th but....
And there we have it, A Working chart
"Oh No, Lots of lines" I hear you cry
But every one has relevance.
The Lines descending from left to Right are Fib Circles, Nearly Always resistance and the RED ones are 236 Fib circles....Normal rejection almost guaranteed.
You can see the current ATH got rejected off the 6.768 Fib extension and a 236 Fib circle.
So far, we have fallen through a number of Fib Circles and have found support on the 5.236 Fib extension
This has also put us under pressure from the next Fib circle and so, we are in a Squeeze that has an apex on 25th this month.
This is likely rejection
This all adds confluence to what I said at beginning of the month in my Monthly Candle colour report, that does point towards a stronger likelihood of a RED close for November,
But a Green December should Follow.
Back to this month
The Arrow points towards where I think we will land and find support IF we loose the current level.
That would be around 95K on the 5 Fib extension. It also happens to be just above the next 236 Fib circle,
Bur more importantly, that dashed line is a long Term support that has support PA previously.
see below
I removed the Fib circles for clarity
You can see how that dashed line was support, as has the 5 Fib extension.
While we are here, Take Note of the horizontal 3 & 6 Fib extensions ( bold )
And see the earlier version here.
See how the 3 rejected the 2021 ATH line, the 1 supported the bounce in 2021 and the 0.236 rejected the 2017 ATH
On this cycle, that 3 fib line was the 2024 line of rejection ( PA went over and below but always in that field )
The 2025 Run has been around the 6.
I think we could reach up to the 9 over the course of the next 12 months.
"WHAT ???" "End of 4 year cycle means we fall into a BEAR doesn't it?"
I have a feeling that this may not happen. Things are VERY different this time......and there are plenty of reasons why we simply CANNOT pull back 80% from here...all mentioned in previous posts
But I do believe November WILL close RED....But DO NOT PANIC -> BUY
The Bull Run will start again in December

BTC/USDT Analysis. The scenario didn’t materialize — waiting for
Hello everyone! CryptoRobotics trader-analyst here, and this is your daily market update.
Yesterday, the expected bounce from the $104,700–$104,100 zone did not materialize. Buyers failed to regain control, and Bitcoin fell sharply toward the more significant support at $102,000–$100,000 (volume anomalies), which triggered an immediate reaction.
However, the market structure still does not favor buyers: sellers continue to produce local results, while buyers show weak follow-through on every correction, despite a few confident candles.
Price has now tested the seller’s mirror zone at $102,900–$103,600 and is pulling back. A repeated test of $102,000–$100,000 remains likely — this is where buyers might show strength again.
Still, the most conservative long setup requires a break of the local downtrend: a breakout and consolidation above $105,400. Only after a retest of this level should we look for long opportunities with a proper risk–reward profile.
Buy zones:
• $102,000–$100,000 (volume anomalies)
• $97,000–$93,000 (volume area)
Sell zones:
• $105,800–$106,600 (local resistance)
• $109,500–$110,700 (accumulated volumes)
• $112,400–$113,300 (accumulated volumes)
• $114,700–$115,700 (accumulated volumes)
• $120,900–$124,000 (volume area)
This publication is not financial advice.
Market Makers Manipulation on BitcoinIs this the end?
Im of the belief theres still a good chance its not. Not with so much institutional interest.
But what Im sure of is that the market makers are manipulating these prices.
Yesterday was a prime example of the MMs pushing the market up in London, straight into a vector candle recovery area before dumping it back down in NY.
Our MM three wave theory says we should have one more level down but I'll be on the look out for a final damage dump under 100k to take out everyones stops and buy those last bags at these prices.

BITCOIN TO $130,000 - $140,000Hello! It's me again!
My friends, it seems that BTC's price action is clearly indicating its trend and direction. Of the last five candles on the weekly chart, four have shown a very clear indication: there are buyers on the downside, it has remained above the 55-week moving average, and we've seen very strong support around $103,000.
It's also true that the uptrend on the weekly chart is already quite worn out. It has been quite long and has remained solid until now; however, this could be the bullish move that ends the trend.
At the moment, the technical analysis is simple and very clear: we are within the lower range of an upward move (I bought at $109,900 six weeks ago and I plan to hold since the movement is clear).
In conclusion, Bitcoin will be looking for the $130,000 range and, at most, $140,000. The final upward move is about to begin.
See you later! And remember, this isn't advice, it's just an opinion.

BTC/USDT Analysis. Probability of a New Growth Phase
Hello everyone! This is CryptoRobotics trader-analyst, and here’s your daily analysis.
Yesterday, Bitcoin fell below the previously mentioned delta anomaly zone around ~$104,500. At the local support near ~$103,300, the price paused, consolidated briefly, and bounced upward. Yesterday’s anomaly failed to produce a strong pivot, indicating seller weakness.
Today, the same anomaly zone was retested, but no selling continuation followed.
Based on current volume distribution and delta, long positions have greater potential. We’re watching for buying opportunities from the $104,700–$104,100 range, which now acts as a mirror support zone.
If BTC breaks through the $105,800–$106,600 resistance area, the next upside target lies near $110,000.
Buy zones:
$104,700–$104,100 (mirror zone)
~$103,300 (accumulated volumes)
$102,000–$100,000 (volume anomalies)
$97,000–$93,000 (volume cluster)
Sell zones:
$109,500–$110,700 (accumulated volumes)
$112,400–$113,300 (accumulated volumes)
$114,700–$115,700 (accumulated volumes)
$120,900–$124,000 (high-volume zone)
This publication is not financial advice.

Bitcoin Price Hits Historical Recovery BarrierBitcoin’s price is currently at $103,922, struggling to overcome the downtrend active for nearly two and a half weeks. The cryptocurrency has failed twice to breach this resistance, reinforcing the strength of bearish market sentiment.
At present, Bitcoin trades below $105,000 but remains above the $101,477 support zone. This area is likely to form a consolidation base amid persistent volatility and cautious investor behavior.
If bullish momentum strengthens, Bitcoin could break past $105,000 and challenge resistance near $108,000. Successfully flipping this level would mark the first significant recovery since October, signaling renewed optimism across the broader crypto market.

The Power of One Setup: Variety Kills ConsistencyMost traders chase new strategies, indicators, and secret signals. Progress rarely comes from adding more. It comes from mastering one thing deeply.
The fastest path to consistency is one setup traded a thousand times, until execution becomes automatic.
Every setup has a rhythm. Market conditions, timing, management. When you rotate through styles, you reset the learning curve repeatedly.
Specialization compresses uncertainty. You see the same context, the same triggers, the same mistakes, which tightens execution and accelerates feedback.
Switching setups leads to inconsistent entries, inconsistent risk, and mixed data. You cannot tell what actually works because the sample is polluted.
Professionals remove variables. They keep the market changing while the method stays constant.
Turn the setup into a rulebook.
• Market conditions: trend, range, volatility threshold, session.
• Structure: levels, pattern shape, invalidation logic.
• Entry: trigger candle, confirmation, timing window.
• Risk: stop location, size per trade, max daily loss.
• Management: partials, move to break even, trail or fixed target.
Mastery does not come from more information. It comes from repetition and refinement.
You do not need more strategies. You need fewer distractions.

BTC Bitcoin Bullish Price Action Here's My Trade PlanBTC just broke to the upside! 💥 On the 🕓 4-hour timeframe, price action looks strong: higher highs and higher lows 📈⬆️. I’m waiting for a pullback 📉—once support is found 🛑 and structure breaks bullish again, I’m considering another buy opportunity 🚀💸.
Not financial advice.

Bitcoin price forecast, short-term BTC chart analysisResistance line: Represented by a red diagonal line indicating a downtrend, suggesting that the price may struggle to break above this level.
Support line: A green horizontal line at the bottom of the chart, marking the support area where a recent W pattern formed, currently around 99K.
CME gap: Highlighted in yellow at the center of the chart, representing a short-term resistance area.
Parallel channel: Formed by two gray diagonal lines, illustrating the range within which the price is likely to move.
POC (Point of Control) line: A red line cutting across the center of the chart, representing the price level with the highest trading volume. Currently around 110,000 USDT, it can serve as a key support or resistance level.
Liquidity zone: The area where the POC line near 110,000 USDT overlaps with the upper boundary of the parallel channel, indicating a zone of highest expected liquidity. This is where short stop losses and long take profits are likely to cluster.
Predicted path: Shown in green, suggesting the price may bounce off the support line, rise along the parallel channel, break through the CME gap, and move toward the liquidity zone. If it breaks the red resistance line, the ascent toward the liquidity zone could accelerate.
Conclusion: Bitcoin is expected to gradually rise as it overcomes resistance levels, ultimately reaching the high-liquidity zone around 110K–112K. This analysis is based on current market conditions, and actual price movements may differ due to various market factors.

Bitcoin 100k scenarioA scenario where it gets to 100k by end of year. Just saving this up there))
needs to be led by the important moving averages (50ma, 200ma...). lets go!

Bitcoin Reverses off Previous Support Turned ResistanceBitcoin’s recent decline has brought price action back toward the crucial $100,000 psychological and horizontal support zone, an area that has held firm multiple times since May. The daily chart shows that price briefly dipped below this level but quickly recovered, forming a potential short-term base.
The 50-day SMA (blue) has turned lower and now sits above current price, suggesting weakening medium-term momentum, while the 200-day SMA (red) continues to act as dynamic support near $103,900. A sustained close below the latter could shift the broader structure toward a more prolonged consolidation phase.
From a momentum standpoint, the MACD remains below the signal line and in negative territory, reflecting persistent bearish pressure, although histogram bars are showing early signs of contraction. The RSI is currently near 38, hovering just above oversold conditions, indicating that sellers may be losing strength in the short term.
Overall, Bitcoin remains in a neutral-to-bearish phase, trading between $100,000 support and $107,300 resistance. A decisive breakout beyond either boundary could define the next directional move.
-MW

Backtesting on TradingViewBased on the massive feedback from our previous article about backtesting we decided to make a follow up on how to backtest your strategy.
Every trader talks about strategy.
Few actually test it.
Backtesting is where ideas meet data — and TradingView makes it surprisingly simple.
Whether you code your own system or use built-in tools, backtesting shows you how your logic performs before you risk a single dollar.
1. Open the Strategy Tester
Start by opening the chart of the asset you want to test.
Click “Strategy Tester” at the bottom of the screen.
This activates TradingView’s built-in engine that simulates your system’s historical trades automatically.
You’ll see three tabs appear:
Overview: a summary of your results.
Performance Summary: key stats like profit, drawdown, and win rate.
List of Trades: every single historical trade your strategy executed.
2. Load or Create a Strategy
Go to the Indicators & Strategies tab.
TradingView separates indicators from strategies — only strategies can trigger trades for backtesting!
You have two options:
Use a built-in or public strategy: like “MACD Strategy” or “Moving Average Crossover.”
Paste your own Pine Script strategy: under “Pine Editor,” then click “Add to Chart.”
Once applied, TradingView automatically calculates historical trades based on your logic.
Tip: Indicators are for signals, strategies are for testing execution.
3. Adjust the Test Parameters
To make your test realistic, click the ⚙️ icon next to your strategy name.
In the Properties tab, you can define:
Initial capital (e.g. $10,000)
Position size (fixed or percent-based)
Commission and slippage
Pyramiding (how many positions can stack)
Then set your date range in the Strategy Tester — for example, test from 01-01-2022 to 01-01-2024.
The goal is to simulate what your system would have done under real conditions.
4. Analyze the Results
Once the test runs, TradingView gives you a detailed breakdown:
Net Profit (%) — your total gain or loss.
Max Drawdown — your biggest loss from peak to trough.
Win Rate & Profit Factor — how often you win and how much you win versus lose.
Average Trade — the mean result per trade.
Equity Curve — how your balance evolved over time.
Scroll through the List of Trades to see how each entry and exit behaved.
If you spot clusters of losses, note the pattern — that’s where improvements start.
This is the part where you analyze and think why did a trade fail and how can I avoid it.
TradingView also enables you to export data in excel so its super easy to analyze and look for improvement.
5. Refine and Forward-Test
Once you’ve seen how your system performs historically, make small adjustments.
Change one parameter at a time — like EMA length, RSI threshold, or stop-loss distance — and rerun the test.
When you find consistent results across timeframes or markets, move to paper trading mode.
Forward-testing confirms your backtest logic under real conditions, including live volatility and execution timing.
If your live and backtested results align closely, you’ve built something solid and you are ready to make money.
A big tip here, even a small thing such as a change in stop loss or timeframe change from 15 minutes to 14 minutes can make a huge difference so try out different conditions.

BTC/USDT Analysis. A New Support Point
Hello everyone! This is CryptoRobotics trader-analyst, and here’s your daily market update.
Yesterday, Bitcoin reached the previously marked selling zone at $105,800–$107,400.
Buyers initially dominated, but after failing to form a new local high, selling pressure resumed, leading to an expected correction.
At the moment, BTC is testing the lower boundary of the local range that formed within the resistance zone.
Below, we can see a strong imbalance toward selling around ~$104,500. The delta remains highly negative, indicating strong seller pressure that hasn’t yet produced a decisive result.
It’s important to wait for confirmation and a price consolidation.
If BTC returns to the range and consolidates above the anomalous volume area near ~$104,500, the potential upside target will be around $110,000.
However, if the price breaks and consolidates lower, the ~$103,300 support might fail, opening the way for a deeper decline.
Buy zones:
~$103,300 (local support)
$102,000–$100,000 (volume anomalies)
$97,000–$93,000 (volume cluster)
Sell zones:
$105,800–$106,600 (local resistance)
$109,500–$110,700 (accumulated volumes)
$112,400–$113,300 (accumulated volumes)
$114,700–$115,700 (accumulated volumes)
$120,900–$124,000 (high-volume area)
This publication is not financial advice.

Asia Range Downtrend ContinuationAfter consolidating all of Monday we have a fake out break out up to open Hong Kong which created the upper limit of our Tuesday Asia range. The downtrend continued to hold the Asia downtrend perfectly and we are now looking to London to see what happens.
There is the possibility that we get a continuation back up, in which we would like to see this level hold and some sort of W formation created.
More likely with this Asia range pattern we will see a retracement and and failure in London/NY Open at the bottom of the Asia range or either the MA or the VWAP.
