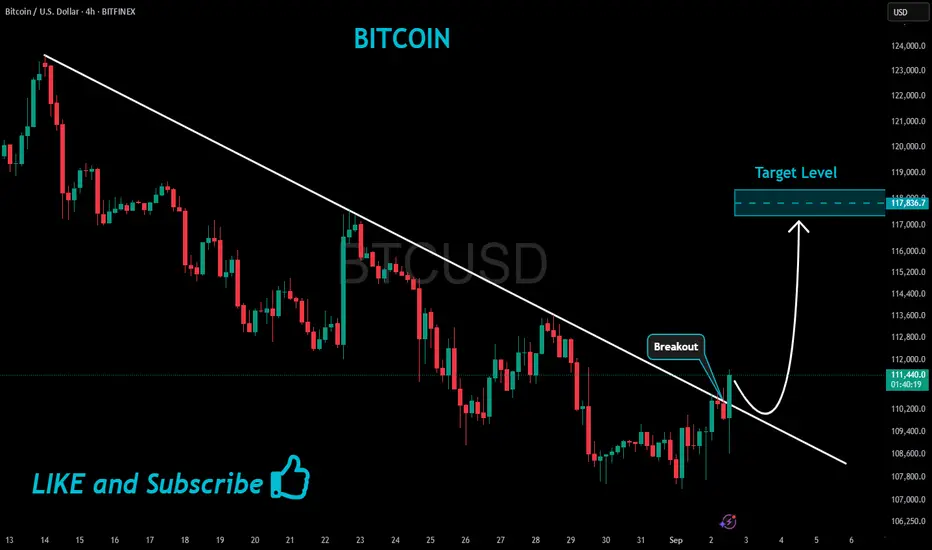
BTC 4H ENG.My kids are scared; they got scared with the October 10th crash. Do you know when they stop being scared? When it goes up! I have my futures take profits at 117k; you're my target. I've had my entry pattern very clear, since I was at 106k. The red box indicates an ideal entry area, although you should already be inside.
Bitcoinpriceprediction

Bitcoin Price Target for this Cycle TopPrediction model
As a basis for my calculations, I will use my Halving-Corrected Puell Multiple indicator, which allows one to assign an overvalued threshold of 12.49 to the indicator.
Step 1: Predicting the Puell Multiple
Looking at the historical behaviour of the indicator, I came up with these three cases:
Conservative case: 10.4 : this was the value at peak (5), when there was a cycle top, but the indicator didn't reach the overvalued territory
Base case: 12.5 : just a bit above the overvalued line (12.49)
Bull case: 13.61 : the value at peak (3) from December 2013, when the indicator shot over the threshold by a good margin. It hasn't been there since, and it is unlikely to revisit that value.
The current correction factor, after the 4th halving, is 1,63^4 = 7.059 . Dividing the above three cases by 7.059 , I transformed them back to the original Puell Multiple's scale:
Conservative case: 1.4733
Base case: 1.7708
Bull case: 1.9252
Step 2: Calculating the Miner Revenue from the Puell Multiple
The Puell Multiple is a ratio between the current (Daily) Miner Revenue ("Miner Revenue" from now on) and the 365-Day Moving Average of the Daily Miner Revenue . We know the ratio. In order to calculate either term of the ratio, we have to know the other one. Here, it is easier to predict the Moving Average , as its movement is much smoother and more predictable than the erratic raw Miner Revenue .
The 365-day Moving Average of the Mining Revenue is at 44.752M USD on the monthly chart at the time of writing. We can expect that it will go higher as the Miner Revenue goes higher while we are approaching the cycle top, so even the conservative case should be higher than the current value. My Miner Revenue MA estimates based on this, are (see picture below. Yellow line: Miner Revenue , Green line: Miner Revenue MA ):
Conservative case: 46.8M
Base case: 50M
Bull case: 52M
Multiplying the Miner Revenue MA values by the previously estimated Puell Multiples gives us nine (three times three) possible Miner Revenue values at the cycle tops. I leave the arithmetic to the reader.
Step 3: Calculating Bitcoin's price from Miner Revenue
Miners get their rewards in Bitcoin for their effort to secure the network. Since we have Miner Revenue estimations from the previous step in USD, we need to know (estimate) how many Bitcoin are issued daily, then it becomes a simple division:
Bitcoin price = Miner revenue / Bitcoin's daily issuance
Luckily, this data is publicly available. The Miner Revenue (and thus the Bitcoin issuance) consists of two parts:
The block reward: it is fixed and doesn't change between halvings
Transaction fees: depends on the network traffic
If you look up the Bitcoin issuance chart, you can see that it changes from day to day, and in the past one year
The highest value it hit was 575 Bitcoin (BTC)
560 BTC was a well respected level, touched only 3 times
We can consider 520 BTC relatively high, with most of the days being below it
The average falls between 480 and 440 a day, so we can say that 480 is above average
When Bitcoin's price hits All-Time Highs (ATH), we can expect more attention from traders and investors, which translates to more transactions on the network, therefore I expect above average transaction fees issued. My estimates are:
Conservative case: 480
Base case: 520
Bull case: 560
By dividing our Miner Revenue estimates by these daily issuance values, we will get three estimates for each.
Step 4: Putting it all together
As we have seen, in Steps 1, 2 and 3, we have three parameters of the equation that I had to estimate:
The Puell Multiple
Moving Average of the Miner Revenue
Daily Issuance
Bitcoin price = (Miner Revenue MA * Puell Multiple) / Bitcoin's daily issuance
I have estimated three cases (conservative, base and bull) for each of these parameters. Calculating all combinations yields 3x3x3 = 27 Bitcoin price estimations. Here are the highlights:
The minimum estimated price is 123125.5 USD, which Bitcoin has already surpassed at the time of writing.
The maximum estimated price is 208563.5 USD
The average of all estimations is 165009 USD
Conclusion
I picked the average value of the result set, which is 165009 USD. I feel it realistic. The minimum is already out of the game, and the maximum feels unrealistically bullish.
Rounding it, my bottom line is 165000 USD for Bitcoin.

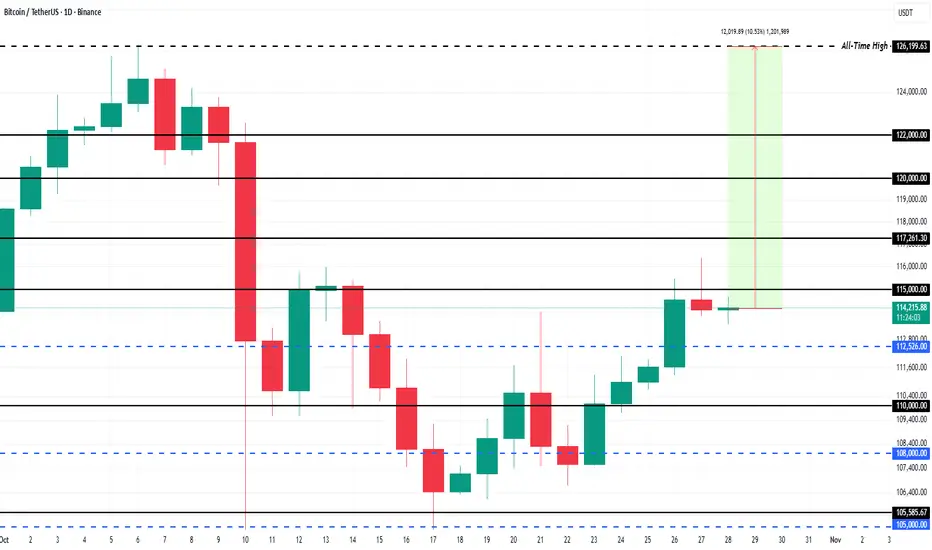
What To Expect From Bitcoin Price In November 2025At the time of writing, Bitcoin trades at $114,518, sitting just below the key $115,000 resistance level. With investor sentiment turning increasingly positive, BTC could soon push through this barrier. A confirmed breakout would likely trigger renewed momentum, driving prices toward higher resistance levels in November.
Bitcoin’s near-term target remains its all-time high (ATH) of $126,199, which requires a 10.2% rise from current levels. To achieve this, BTC must first clear strong resistance zones at $117,261 and $120,000, where heavy supply from profit-takers could temporarily slow progress.
However, if Bitcoin fails to sustain momentum above $115,000, short-term weakness could reemerge. A dip toward $110,000 remains possible if buyers lose conviction. Any move below this support would invalidate the bullish outlook.
BTC/USDT Analysis. Pump and Dump Amid Gold Selloff
Hello everyone! This is CryptoRobotics trader-analyst with the daily market overview.
Yesterday, following a massive gold selloff, volatility on Bitcoin spiked sharply. The price made an explosive move upward with no resistance in the $110,700–$111,500 zone.
However, once above that range, a strong selling anomaly appeared between $111,800–$113,000, triggering a retracement back to initial levels.
At the moment, support at $107,300–$106,300 (accumulated volumes) has been tested, while local volume anomalies appeared slightly higher.
Currently, Bitcoin is attempting to consolidate above $108,000 — holding this level may lead to a short-term bounce, but upon reaching $111,800–$113,000, there is roughly a 90% chance of renewed selling pressure.
Overall, the market structure remains weak for buyers, and within the next week, a test of the stronger support area near $105,600–$104,500 (volume anomalies) looks likely.
Buy Zones:
~$108,000 (local volume anomalies, potential support)
$105,600–$104,500 (volume anomalies)
$97,000–$93,000 (volume zone)
Sell Zones:
$111,800–$113,000 (strong volume anomalies)
$114,400–$115,600 (local volume zone)
$120,900–$124,000 (volume zone)
This publication is for analytical purposes only and does not constitute financial advice.

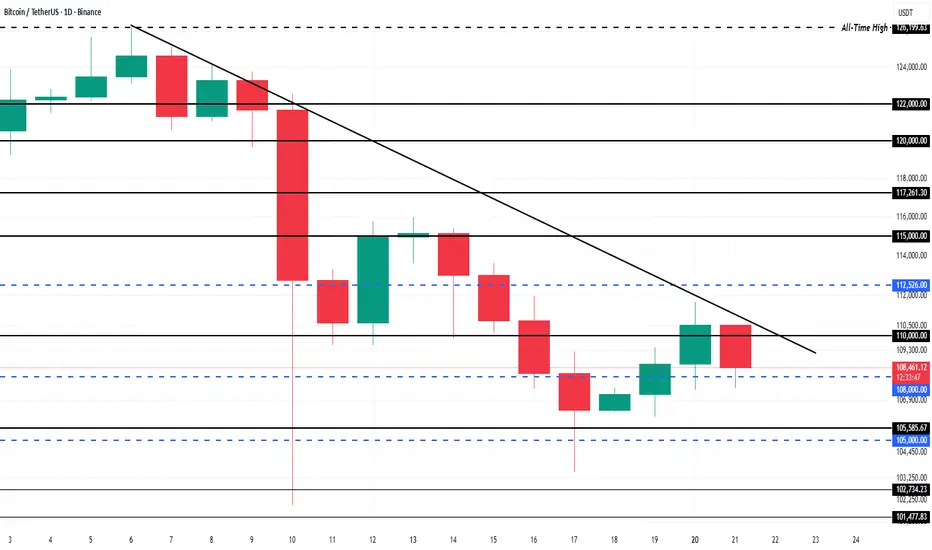
Bitcoin Nears Capitulation As Price Fails To Breach DowntrendAt the time of writing, Bitcoin trades at $107,734, holding below the $108,000 resistance. The crypto giant has repeatedly failed to break the two-week downtrend line, signaling weakening momentum and growing skepticism among investors.
The formation of lower lows this week is concerning. If Bitcoin cannot reclaim the $110,000 psychological level, the price could slip further toward $105,000 or even lower, amplifying selling pressure. Sustained bearishness could accelerate this move, pushing BTC into deeper correction territory.
However, if Bitcoin manages to regain $110,000 as support, the technical outlook could improve sharply. This would invalidate the downtrend and open the door to a move toward $112,500 and possibly higher. In that case, short-term recovery would be back on the table, but for now, caution remains the dominant theme across the Bitcoin market.
Bitcoin Price Slips Below $108,000: Time To Buy The Dip?At press time, Bitcoin trades at $106,947, sitting below the critical $108,000 level that previously acted as strong support. This loss has heightened volatility across the market, but a rebound remains possible if buying momentum holds.
Should accumulation persist and investor sentiment strengthen, Bitcoin could reclaim $108,000. This would push it toward $110,000, with a potential extension to $112,500 if momentum builds further. Such a move would indicate renewed market confidence.
Conversely, failure to maintain current levels could lead to further downside. A drop below $105,000 would expose Bitcoin to additional selling pressure. This would potentially dragging it toward $101,477 and invalidating the short-term bullish outlook.

BTC 4HThe most likely scenario is an upward move to liquidate well-positioned shorts, reaching the 116k level. This would result in a rebound to the 55-period moving average and further decline.

$107,551 Will be a Critical Area for BitcoinGiven that the price of Bitcoin BITSTAMP:BTCUSD is falling below the 8-EMA, 21-EMA, and 200-EMA, technical analysis employing the H4 period suggests that the cryptocurrency is in a downward trend.
The current price of Bitcoin is between $107,551 and $122,007, which is both a traditional support and a demand area. Many traders who established long positions were liquidated in the $108,261 range, according to Coinglass's liquidity data. Consequently, the $107,551–$108,261 range is regarded as a long-term area to monitor.
If the price stays steady above the $107,551–$108,261 area, with a price increase towards the $116,108 region, Bitcoin could continue its upward trajectory.
The price of Bitcoin will continue to drop, testing the $102,000 mark, if it breaks out below $107,551.

BITCOIN Growth Ahead!
HI,Traders !
#BITCOIN is trading along the
Rising support and is already
Making a bullish rebound so
As we are bullish biased due
To the strong uptrend we
Will be expecting a further
Bullish move up on BITCOIN !
Comment and subscribe to help us grow !

Bitcoin BTC Breaks Structure | Watching for Discount Entry LongBitcoin has experienced a fairly aggressive retracement recently, but we’re now starting to see bullish momentum returning and a clear shift in structure to the upside 🚀.
💡 My plan is to look for a retracement into the 50% equilibrium level of the current swing range — from low to high — as this could provide a potential discount entry zone for a long opportunity 🏹.
If price pulls back and respects that equilibrium level before breaking structure bullish again, it could set up a strong continuation trade. If not, we patiently step aside and wait for confirmation — discipline over impulse.
⚠️ Disclaimer: This content is for educational purposes only and not financial advice.

BTCUSD – 4H Volume-Structure Analysis
Indicators
Smart Money Support/Resistance (Lite) & ATAI Volume Analysis with Price Action V1.03
Analytical Setup
• LTF: 10 seconds
• LTF Coverage Bars: 70
• Global Volume Period: 52
• Market Type: Range
• Active Zones:
- Support Zone: 121,557 – 123,941 USD (current active range shown in panel)
The analysis timeframe ensures valid volume coverage, as the period (52) is smaller than total LTF bars (70).
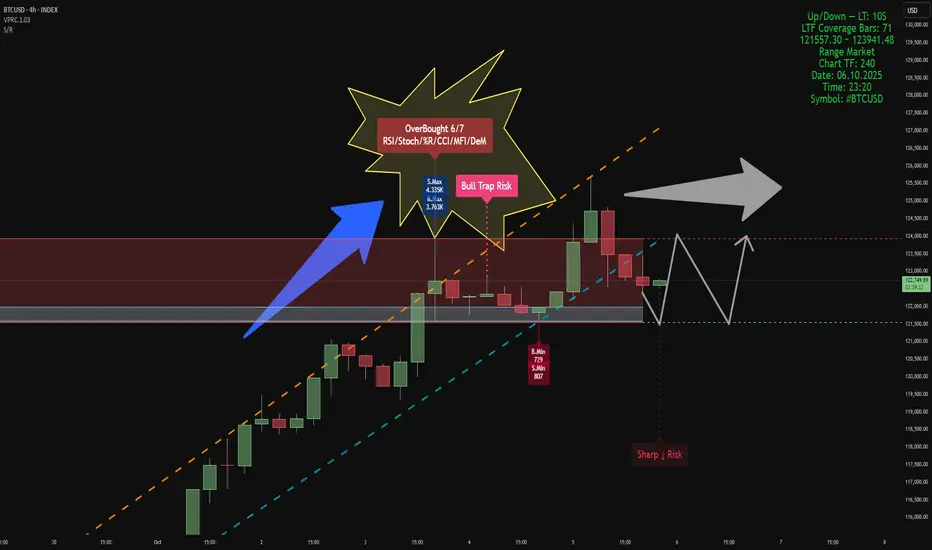
Resistance Area & Bull Trap Risk
In the upper range (≈123,900 USD), a Bull Trap Risk has formed immediately after an OverBought 6/7 condition — confirmed by RSI, Stoch, %R, CCI, MFI, and DeM modules in ATAI. At this point, both buy and sell volumes peaked within the 52-bar window, with S.Max = 4.33K and B.Max = 3.76K. This slight dominance by sellers indicates demand absorption at the top of the structure. The setup matches ATAI’s trap logic — high wick, overbought context, and volume imbalance — signaling potential exhaustion near resistance.
Support Area
Support is currently anchored near 121,550 USD, derived from B.Min and S.Min lows (B.Min = 7.29, S.Min = 807). This aligns with the lower projection from Smart Money S/R, marking the point where cumulative delta begins to compress. Historically, compression at minimum-volume zones often precedes short-term accumulation or range stabilization.
Structural Behavior
The chart shows a defined upward channel (orange and cyan dashed lines). After testing the upper boundary, price entered the resistance zone and generated a Bull Trap Risk followed by moderate rejection. Below, the Sharp ↓ Risk tag signals potential for a short liquidity sweep before stabilization. Volume readings still support range continuation rather than a confirmed reversal, consistent with the Range Market tag.
Probable Scenario
1. A short pullback toward the lower boundary of support (~121.5K) is expected.
2. If support holds and volume compression persists, a rebound toward 123.9K (resistance ceiling) is probable.
3. A breakdown below 121.5K could trigger a deeper correction toward the next S/R projection near 120K.
This represents a neutral-to-bullish range bias: short-term weakness, but constructive above support.
Summary
• OverBought 6/7 + Bull Trap Risk detected at resistance (≈123.9K).
• Support around 121.5K built from B.Min and S.Min.
• Sellers slightly dominant at the trap peak.
• Likely scenario: retest of support, then rebound toward resistance if volume confirms.
• Bias: range continuation until breakout beyond 123.9K or breakdown below 121.5K.
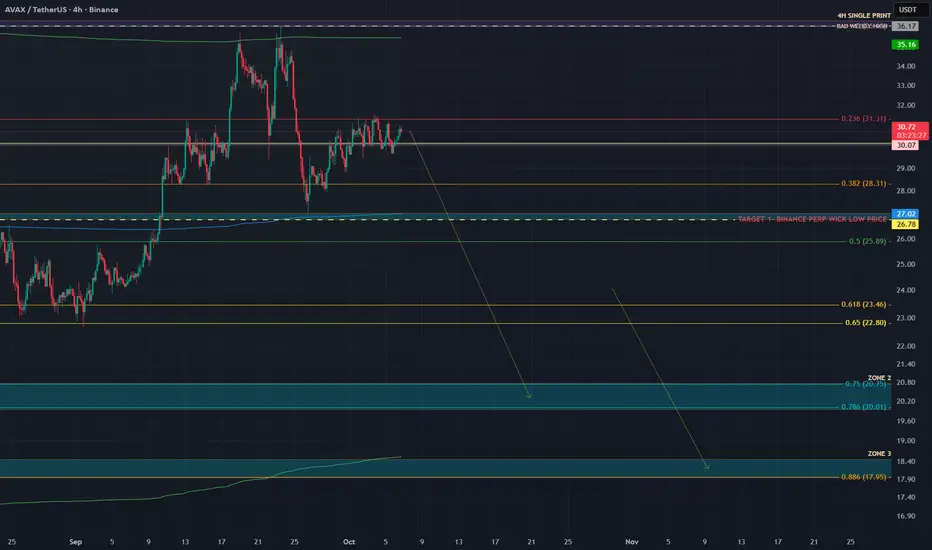
AVAX | ANOTHER DUMP IS LOADING | CHOO CHOOOOCRYPTOCAP:AVAX looks ready for another potential dump. In my CRYPTOCAP:AVAX analysis of August 26 we nailed the entry and exit pixel perfect.
The CRYPTOCAP:AVAX analysis of September 11 was also on point.
I believe that we're not setting up for another hard leg down. Lets look at the data to validate our thesis.
We’re currently in a textbook compression before expansion phase. Price has been moving sideways for days.
CVD Spot is trending down while price holds flat.
CVD Stablecoin-Margined Contracts is also trending down.
CVD Coin-Margined Contracts is trending down even more aggressively.
This tells us that while price is stable, market participants are hitting the bid — selling through the order book. The only reason price hasn’t dropped yet is because passive buyers (limit bids) are absorbing that selling pressure. Once that liquidity weakens or gets pulled, price can easily air pocket lower.
Now, here’s where it gets interesting.
Open Interest (Stablecoin-Margined) is flat.
Open Interest (Coin-Margined) is rising steadily.
At the same time, Coin-Margined CVD continues to drop, and price remains flat inside the range.
Conceptually, this combination is very bearish. Rising OI means new positions are being opened. Falling CVD means those positions are being opened via market sells — in other words, traders are adding shorts. The steady rise in coin-margined OI tells us these are leveraged positions taken directly against the asset, not just speculative stablecoin longs.
This pattern shows that new short exposure is building quietly under the surface, while spot and stablecoin flows fail to show any real buying. It’s the kind of distribution that looks like “accumulation” on the chart — but it’s actually leveraged sellers being absorbed by patient buyers. When those buyers step away, the imbalance resolves sharply to the downside.
In plain English:
Price is holding up because someone keeps catching the falling knife. But the knife is still falling.
Unless Spot CVD turns positive and stablecoin OI starts rising with it (showing real demand returning), this setup points to one thing — another leg down is coming for AVAX.
I'm targeting ZONE 2 and ZONE 3. Check the Order Flow Data here: ibb.co
Trade safe, Nomads!
bitcoinbtc usdt daily analyse
time frame 4 hours
risk rewards ratio > 5 woooow
target 123.000 $
btc is in the down side of my critical red box
here is good area to pump
LS is very tight to decrease my probably damage
so I open a long position to win

Bitcoin Price Eyes $120,000 as Seller Exhaustion Sets InBitcoin is trading at $116,502, attempting to hold $115,000 as a new support level. Securing this area is vital as the cryptocurrency also works to break out of the two-month downtrend that has capped its upward momentum since midsummer.
If conditions improve, Bitcoin could rally beyond $117,261. Breaching this level would open the door to $120,000. This would reinforce optimism among traders and institutions anticipating further growth in the crypto king’s valuation.
However, failure to maintain current levels would invalidate the bullish outlook. Bitcoin could fall back to $112,500 or even $110,000, extending the bear run. Such a move would dampen sentiment, signaling renewed vulnerability in the world’s largest cryptocurrency.

Bitcoin Approaching $114,500 Resistance, Breakout OR Rejected?At $114,500, the price of Bitcoin is currently getting close to the Classic Resistance level. As a result, there are several situations to think about. According to the Bull Case, the price of Bitcoin may continue its short-term upward trend if it breaks out of $114,500 with strong volume support. Nonetheless, there is still a chance that the price of Bitcoin will continue to drop to at least the $112,700 region if it can sustain trade and refuses the $114,500 region.

$8 Billion Bitcoin Accumulation Could Launch Price to $115,000At the time of writing, Bitcoin is trading at $111,966, just shy of the $112,500 resistance. The recent bounce from below $110,000 reflects investor demand, but breaching key resistance remains critical for further upside momentum.
If Bitcoin successfully climbs past $112,500, the crypto king could reclaim $115,000 as a support level. This would open the door for a rally toward $120,000 in the coming days, fueled by accumulating investor demand and reduced selling pressure on exchanges.
However, failure to overcome $112,500 resistance would expose Bitcoin to further downside risks. A drop back to $110,000 or even $108,000 remains possible. This would invalidate the bullish outlook and trigger renewed skepticism about Bitcoin’s near-term recovery.

Bitcoin Breaks Through Key Support Band — Price May Crash SoonAt the time of writing, Bitcoin trades at $111,542, reflecting a 4.7% weekly decline. The crypto king remains stuck below the $112,500 resistance, unable to attract enough momentum to flip the level into support.
If bearish pressure persists, Bitcoin could break through $110,000 support, opening a path to $108,000. Continued selling could extend the drawdown further, dragging BTC to $105,000 in the near term.
However, if investors step in to stabilize price action, Bitcoin could reclaim $112,500 as support. A successful bounce from that level would challenge the prevailing bearish narrative, potentially setting the stage for recovery and invalidating the downside outlook.

Bitcoin’s Breaking Point: Why Price Needs To Stay Above $111,500At the time of writing, Bitcoin trades at $112,960, holding slightly above the $112,500 support level. Within the last 24 hours, BTC slipped from $115,100 and touched $111,478 during its intra-day low. This volatile action underscores the importance of maintaining current levels.
The crypto king has so far managed to stay above $111,400, the STH cost basis. By securing $112,500 as support, Bitcoin has the potential to bounce back toward $115,000, which would help prevent a bear market structure from taking shape.
However, any renewed selling pressure could drag Bitcoin through $112,500 and toward the $110,000 support. If that occurs, the bullish thesis would be invalidated, and BTC could slide further, officially marking the onset of bearish momentum.

As long as I am here, Bitcoin isn't going anywhere!''We still see downward targets to at least 92,425$ in the medium term and even lower in the long term to 45,379$.
The alts such as XRP and ETH, should follow suit with BTC.
SPX should continue to see a pump to 6,860$ before a massive sell off occurs..... I don't know what will cause this sell off a war, financial crisis or trump opening his mouth but something will kick off a set of domino chains that should make us see a financial crash as bad as the 2008 crash....... you heard it here foretold first and a lot of you will laugh but I will document this whole journey to the ground, with every twist and turn.''
>>>>>>> THIS WAS STATED IN OUR MOST RECENT POST.
>>>>>>> NOTHING CHANGES ON OUR CHARTS, WE CAN SEE WEEKS AND MONTHS AND YEARS INTO THE FUTURE.
I WILL PROVE ALL DOUBTERS WRONG, YOU STILL HAVE TIME TO OFFLOAD BEFORE THE BIGGEST CRASH IN CRYPTO AND STOCK HISTORY OCCURS WITHIN SUCH A SHORT SPACE OF TIME.
Things have been sped up x100 over this weekend.
I am not here spreading FUD, I am here warning everyone.
Go on our page and follow price for the past 2 months, you'll realise we have this all under control.
and yes, we have been predicting the pumps too including on SPX, but we are near the top and things have become exhausted.

2-Month High Bitcoin Accumulation Could Push Price To $120,000Bitcoin is trading at $116,027, maintaining steady gains since the start of the month. The crypto king is now facing resistance at $117,261, a key level that has kept upward progress capped in recent sessions. Breaking this barrier will be crucial for Bitcoin’s next move.
If Bitcoin manages to breach and flip $117,261 into support, it could rally toward $120,000 in the coming days. Strong buying pressure and favorable momentum indicators make this outcome highly plausible.
However, a loss of momentum could bring renewed selling pressure. Should BTC fall through the $115,000 support, the price risks slipping to $112,500, invalidating the bullish outlook.

Bitcoin and the WeekendCRYPTOCAP:BTC
There have been positive inflows into exchanges over the past four hours. Bitcoin has broken its trend. All signals are pointing to a decline for now. We'll be monitoring and reporting on this.

Bitcoin Price Crosses $117,000 Post-Fed’s 35 bps Rate CutBitcoin is currently trading at $117,182, continuing its uptrend since the beginning of the month. The immediate challenge lies in flipping $117,261 into support, which would give the cryptocurrency the base it needs for further upside.
If successful, Bitcoin could target $120,000 as its next milestone. A breach and consolidation above that level could set the stage for further gains. This is likely, particularly if ETF inflows continue reinforcing investor confidence.
However, risks remain. Should selling pressure increase, Bitcoin may struggle to hold above key levels. A drop below $115,000 could open the door to a correction toward $112,500, invalidating the bullish thesis and cooling near-term momentum.

BITCOIN Bullish Breakout!
HI,Traders !
#BITCOIN made a bullish
Breakout of the falling resistance
And the breakout is confirmed
So we are bullish biased
And we will be expecting
A further bullish move up !
Comment and subscribe to help us grow !