Is 16000 - 19000 Possible for BTC??BTC Analysis
CMP 66200.71 (05-02-2026)
Hit the Target of Cup & Handle around 120000 - 123000 & then crashed.
Now it may bounce back from 61000 - 63000 towards 80000.
However, breaking the important Support zone (61000 - 63000)
may drop the price further around 48000 & then around 33000.
For long term investment, the most attractive buying range is
around 16000 - 19000 (if it comes).
Bitcoinpricetrendanalysis

#BITCOIN: 2026 Is Loading Possible Drop First And Then Boom! Happy New Year 2026💥🎇
We extend our best wishes for your success and happiness, hoping this year brings the achievement of all your trading objectives.
Let us now analyse Bitcoin's concluding performance for the year 2025👨💻📈
🔺Bitcoin is currently exhibiting strong consolidation, trading within a range of $80,000 to $95,000. It is possible that the price is awaiting robust Non-Farm Payroll (NFP) data to bolster the DXY, which could indirectly lead to a price correction towards the $67,000-$64,000 range. This area is characterized by significant bullish volume and liquidity. A potential swing target could be established above the recent yearly high of $125,000.
Entry, Stop Loss, and Take Profit💭
🔺A strong order block entry is identifiable at $67,000, a critical level for global investors. Upon a price rejection from this vicinity, we anticipate a reversal and subsequent progression towards our designated take-profit target of $135,000.
🔺 A stop loss can be positioned below $59,000 providing a sufficient buffer in the event of a liquidity hunt. This trade may require up to a full year to materialise unless fundamental shifts induce unexpected price movements.
Support and Encouragement 🏆
🔺 We encourage you to comment on and share this analysis if you find it insightful. Your engagement, particularly through likes, provides valuable affirmation of our efforts.
We wish you good year ahead and appreciate your continued support.
Team SetupsFX_

BTCUSD (1H) — RegimeWorks E1 Short | Why the trade openedThis entry is not discretionary. It triggered because the RegimeWorks Engine 1 conditions aligned: permission (context) → trigger (price action) → risk (defined invalidation).
1) Permission (context had to be “on”)
From the chart structure:
BTC had an aggressive downside impulse earlier, then shifted into a choppy consolidation / pullback under overhead resistance.
Price was trading below the higher EMA cluster (downside pressure / bearish structure still dominant).
The move back up was treated as a pullback into supply, not a fresh long regime.
RegimeWorks interpretation: if the broader context is bearish and price is retracing into resistance, E1 looks for continuation shorts — but only when the trigger confirms.
2) Trigger (what actually caused the entry)
Engine 1 fired when price:
Pushed into the resistance zone (your red risk box area / rejection region),
Failed to reclaim and hold higher, and
Printed continuation confirmation (rejection + loss of short-term support), indicating the pullback was likely done.
In simple terms:
pullback into supply → rejection → continuation trigger
That sequence is the E1 entry template.
3) Risk framework (why this is a valid E1 trade)
The trade is valid because it has objective invalidation:
Stop is positioned above the rejection/supply area (if price accepts above that zone, the short idea is wrong).
Target is set toward the next logical downside area (your green box projects into the lower liquidity / support region).
This is critical RegimeWorks style: the engine doesn’t “predict” — it executes only when it can define where it’s wrong.
4) Why it opened here (and not earlier)
Because E1 waits for:
a pullback into a known resistance region and
confirmation that buyers failed (rejection + continuation structure).
Without that, it stays idle and avoids noise trades.
This short opened because BTCUSD was in a bearish continuation context, price retraced into resistance, then rejected and confirmed continuation, giving E1 a clean entry with defined invalidation and a downside objective.
Not a guarantee — just a rules-based execution when permission was present.

Breaking: Bitcoin Dips to $70K Zone The price of the notable asset - Bitcoin ( CRYPTOCAP:BTC ) Dips to $70K Zone amidst market turmoil. The asset has broken the base of a bearish symmetrical triangle further hinting on more selling pressure in the short to long term.
Notable assets like CRYPTOCAP:ETH , CRYPTOCAP:SOL and CRYPTOCAP:XRP all experience their own fair share of the market volatility.
A major reason the sell-off became so aggressive was leverage. Many traders were using borrowed funds in Bitcoin and altcoin derivatives. When prices dropped quickly, those positions were forced to close.
These liquidations created a chain reaction. Each forced sell pushed prices lower, triggering more liquidations. This is common during sharp crypto pullbacks, especially when markets are thin and traders are over-positioned.
Traders will be watching whether Bitcoin can stay above recent support levels. If it holds, the market may slowly recover. If it breaks lower again, another wave of selling could follow.
For now, the market looks shaken but not broken. The weekend sell-off was sharp, but Bitcoin’s ability to stabilize suggests this may be a reset, not the start of a deeper collapse.

Bitcoin SELL prediction of the End of january 2026After big sell extenntion price pulled back to a supply zone. Also created breakout of structure to the downside then pulled back for another time that gave us power to decide to take short position. Also,considering price and time theory we had confirmation that was right time take a short position

BTC - an ICT and Wyckoff illustration of the current rangeWe have a lot going on in this chart, so let's simplify it.
When you start looking at time based liquidity, the charts simply start making sense... I have a completely free indicator called "Time Liquidity a Zulu Kilo Indicator" that will help you make sense of ICT much faster than any other indicator.
-We have consolidation which is a tell-tale sign that large hands want to control a very specific area, which will be extremely important in the future (for a far bigger move).
-Price manipulated above a previous monthly high, into a higher timeframe weekly FVG, which then reversed and created an IFVG while simultaneously creating displacement down AND confirming below a CISD level.
-This is also setting up a type 1 distributive Wyckoff schema, with the UT (upthrust) as the manipulation, the Wyckoff upper range setting the tone for a return to OTE (optimal trade entry).
Pretty much every check box has been checked for us to be able to take a short position from 93k to 96k.
-Manipulation above a higher timeframe (in our case monthly) into a high timeframe FVG - CHECK
-Price broke below the displacement created on the way up (iFVG), and then created displacement to the downside (FVG) while broaching the CISD (Change in state of delivery / which is yet another validation of bearish intent). CHECK
Price should now retrace into the 68% - 79% OTA (optimal trade entry) and reverse below the yearly open.
As I've previously written on this subject, I believe that we have one more strong bullish move before a much deeper, larger and significant Bitcoin crash THIS YEAR that will test around the 50k price levels...
We WILL be looking for bullish moves below 74,500 (another manipulation possibility below the yearly lows).

BTC vs HYPE - or we will grow from here like hypeWhy the setups are actually similar (BTC ↔ HYPE)
Common characteristics:
Upward impulse → pullback
The pullback does NOT break the impulse low
Price is holding:
either the 0.382–0.5 Fibonacci zone
or an ascending local trendline
Structure = bullish pullback, but without confirmation
So this is not “weakness” — it’s a test.
2️⃣ Key moment — where we are now
Right now we are:
below the local high
at the edge of a Fibonacci zone, where:
either real buyers step in
or the market says: “Okay, let’s go deeper.”
And this is where it becomes critical:
how the Sunday candle opens
3️⃣ Two scenarios (and they are clean)
🟢 SCENARIO 1 — MOVE UP FROM HERE
Valid if:
Sunday opens without a gap down
The candle holds 0.382 / the trendline
We see:
a long lower wick
or an impulsive reaction to the upside
👉 Then this is:
liquidity collection
trend continuation
targets: a return to the local high + extension
This is a healthy, clean bullish continuation.
🔴 SCENARIO 2 — DROP ON THE OPEN
Triggered if:
Sunday opens below 0.382
The candle closes below the trendline
There is no fast buyback
👉 Then:
the pullback is invalidated
this becomes distribution → continuation down
logical targets:
0.618
or a full retest of the impulse
And this part is critical:
don’t try to catch the knife
because this would no longer be a “correction,” but a phase shift.

Bitcoin - Looking To Sell Pullbacks In The Short TermH1 - Strong bearish move.
No opposite signs.
Currently it looks like a pullback is happening.
Expecting bearish continuation until the two strong resistance zones hold.
If you enjoy this idea, don’t forget to LIKE 👍, FOLLOW ✅, SHARE 🙌, and COMMENT ✍! Drop your thoughts and charts below to keep the discussion going. Your support helps keep this content free and reach more people! 🚀
--------------------------------------------------------------------------------------------------------

BTC/USDT Long Signal (Spot or Futures)Entry Zone: Buy on rejection/confirmation of support around $90,000 – $90,500 (ideally near the lower gray zone ~$90,074 or wick rejection + bullish candle close above it).
Trigger: Look for price rejection here (e.g., hammer/doji/wick rejection from lows, volume spike on bounce, or reclaim of the blue trendline/support line). If it breaks down hard below ~$90,000 with conviction, avoid or wait for lower retest.
Stop Loss: Below major support invalidation ~$89,500 – $89,800 (to account for wicks, place ~1-2% below the zone).
Take Profit Targets: TP1: $92,199 – $92,500 (first resistance, partial profit ~50%)
TP2: $92,713 – $93,000 (next gray resistance area)
TP3: $94,000 – $94,967 (higher target if momentum builds, blue arrow projection area)
Stretch: $96,000+ if breakout continues (previous highs).
Risk/Reward: Aim for 1:2+ (e.g., ~1% risk for 2-4%+ reward on initial targets).
Timeframe: 4h confirmation preferred, watch for daily close above support to strengthen the case.
Invalidation: Strong close below $89,800–$90,000 shifts bias bearish (potential lower test toward $88k or beyond).
This aligns with the major horizontal support zone visible on your chart (gray box from mid-December/early Jan), recent pullback respecting it, and the overall bullish structure with higher lows.Use proper position sizing, watch for volume/news (e.g., macro events), and monitor for fakeouts.Not financial advice — Trading crypto is highly volatile and risky. This is just an interpretation of the shared chart for educational/discussion purposes. Do your own research (DYOR), manage risk, and never trade with money you can't afford to lose. Past performance isn't indicative of future results. #Bitcoin #BTC #CryptoTrading #BTCUSD #TradingView #Crypto #BitcoinSupport #LongBTC #NotFinancialAdvice

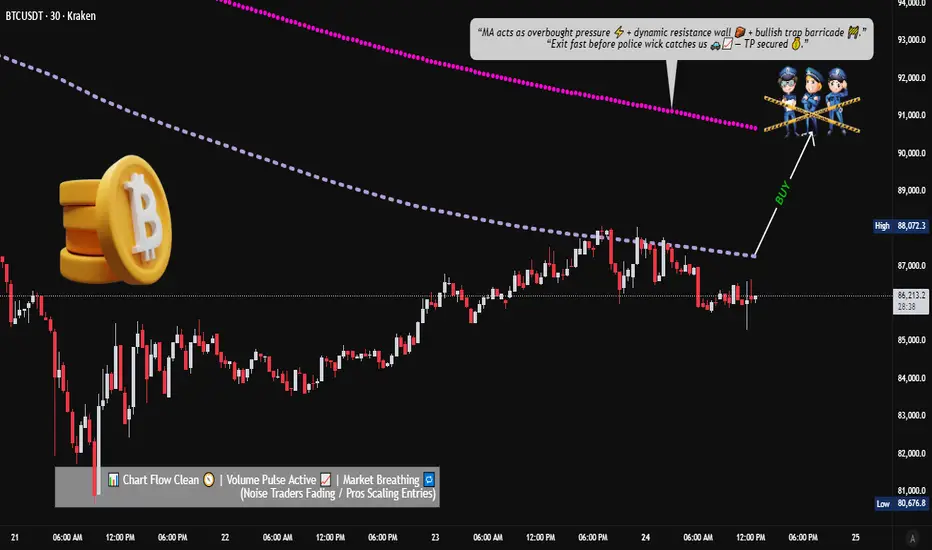
Bitcoin MA Breakout Setup: What Traders Should Watch Now📈 BTC/USDT – “BITCOIN VS TETHER” | Crypto Market Opportunity Blueprint (Day Trade)
🔥 Bullish Breakout Roadmap for Active Day Traders
🧭 PLAN:
Price is attempting a bullish breakout above key moving averages. Once price clears $88,000, momentum buyers may step in and drive a continuation leg upward.
🎯 ENTRY (Breakout Confirmation):
▶ Enter at any price level AFTER a clean moving-average breakout above $88,000.
Look for strong candle closes + volume expansion.
🛑 STOP–LOSS (Risk Management First):
⚠️ This is MY thief-style SL: $84,000
Dear Ladies & Gentlemen (Thief OG’s) — manage your own risk according to your playbook.
This is only my SL, not a rule. You’re free to adjust based on your own risk appetite.
💰 TARGET:
Moving averages align as a dynamic resistance zone, combined with overbought conditions and potential bull-trap signals.
Secure profits responsibly.
▶ Target: $90,800
Again — Dear Ladies & Gentlemen (Thief OG’s), this TP is MY personal level.
Book profits your own way, at your own risk.
🔍 Related Crypto Pairs to Watch (Correlation + Key Notes)
1️⃣ ETH/USDT (Ethereum)
Highly correlated with BTC in bullish phases
Strong ETH movement often front-runs or confirms BTC breakouts
Watch for ETH strength → may add confidence to BTC breakout trades
2️⃣ BTC.D (Bitcoin Dominance)
Rising BTC dominance = Capital flowing into Bitcoin → Supports bullish continuation
Falling dominance = Altcoins gaining share → BTC breakouts may weaken or turn choppy
3️⃣ TOTAL / TOTAL2 (Crypto Market Cap Charts)
Confirms whether capital is entering the entire crypto market
TOTAL rising with BTC strength = broad market confidence
TOTAL flat/dropping during BTC’s rise = possible bull trap
4️⃣ SOL/USDT (Solana)
Solana often moves aggressively when BTC breaks out
Sharp SOL rallies can signal strong risk-on momentum across majors
5️⃣ USDT.D (USDT Dominance)
When USDT dominance drops → Traders moving out of stablecoins → Bullish risk appetite
When it spikes → Smart money hedging → BTC breakout may fail
6️⃣ BTC/USDT Perp Funding Rate
Positive & increasing funding = heavy long side → Potential squeeze
Neutral funding = healthy breakout
Negative funding = breakout might be fueled by short covering
📊 Market Tone:
BTC continues to show strong buyer interest, but resistance pockets remain.
Trade mechanically. Don’t chase candles. Let structure confirm itself.
Bitcoin- 2022 Pattern in Play- Weekly DEATH cross coming upA very very similar pattern in play as was in Feb- March 2022, keep a close eye as a rejection from the death cross on the weekly could spell a crash down to even 60K or lower.
Similarity is quite close

Bitcoin - Waiting for confirmation on weekly candleWe’re at a critical inflection point for Bitcoin. A weekly close above the orange trendline would strongly favor continuation toward $100k. Structurally, this could still be interpreted as a right shoulder within a large weekly head and shoulders formation unless price decisively breaks through resistance. A clean break and close above that level would invalidate the bearish structure and instead signal the potential start of an extreme bull run.
If Bitcoin fails to close above the orange trendline, I expect either downside or extended consolidation before another attempt. At that point, the setup looks weak. Personally, that’s where I would exit rather than sit through uncertainty.

Bitcoin monthly demand level at $84,349 is holdingBitcoin monthly demand level at $84,349 is holding. There are signs of new bullish impulses in the smaller timeframes. Let's see if BitCoin cryptocurrency wants to rally higher from this demand level.

Bitcoin Reacting From Demand Key Reversal Zones in Focus📊 BTCUSDT (Bitcoin) – 4H Price Action, Range Expansion & Reversal Zones
This 4-hour BTCUSDT chart highlights a well-defined market range, followed by expansion, rejection, and reaction zones that are critical for both swing and intraday traders.
🔍 Market Structure Overview & Technical Analysis
Bitcoin has been trading inside a broad consolidation range, with price repeatedly reacting to clearly respected support and resistance boundaries. This behavior reflects balanced market conditions, where liquidity is built on both sides before any directional move.
Price initially pushed higher but failed to sustain above the upper boundary, leading to a strong bearish displacement toward the lower range. This move suggests distribution at higher levels and aggressive sell-side participation.
📐 Bullish Trendline & Failed Continuation
The diagonal trendline marks a temporary bullish recovery phase, where price printed higher lows and attempted continuation. However, the bullish structure failed near resistance, signaling:
Weak buyer follow-through
Sellers defending premium prices
Potential bull trap behavior
This failure increased the probability of a move toward discounted price zones.
📦 Lower Reversal Zone + Volume Burst
The lower highlighted zone is a high-interest area where:
Previous demand exists
Strong volume burst was observed
Sellers showed exhaustion
Price reacted positively from this area, confirming it as a valid demand / accumulation zone. This reaction indicates that smart money may be defending discounted levels, at least temporarily.
🔄 Measured Expansion & Upside Target
The marked vertical measurement (~130 units) reflects a range-based expansion projection, commonly used to estimate potential upside after a successful reaction from demand.
Price is currently rebounding and may attempt a move toward the upper reversal zone, which aligns with:
Prior resistance
Range high
Premium pricing area
🚧 Upper Reversal Zone (Supply Area)
The upper green zone is a critical decision area:
Ideal for profit-taking on longs
Potential zone for short setups
Area where sellers previously dominated
⚠️ Important:
No trades should be taken blindly here. A valid setup requires clear confirmation, such as:
Bearish engulfing on 4H / 1H
Long upper wick rejections
Market structure shift (MSS) on lower timeframes
🧠 Trading Psychology (Minds)
Retail traders often chase breakouts
Smart money waits for reaction and confirmation
The best trades occur at extremes of the range, not the middle
Patience is essential. Let price enter the zone first, then react — not predict.
📌 Trading Plan Summary
Bias: Range-based, reaction-focused
Buy idea: Confirmed bullish reaction from lower reversal zone
Sell idea: Only after bearish confirmation at upper reversal zone
Avoid: Entries in the middle of the range
⚠️ Final Reminder
This analysis is probability-based, not predictive.
Always wait for confirmation and manage risk accordingly.
📈📉 Trade the levels. Respect the structure. Protect your capital.

145,000 to 30,000 the Great Resetit explain itself be ready for the next buying opportinity between Juni-Sep.2026 for every know trading market.
April.2026 is a dengerous Zone and the best selling opportinity for all Markets and all Coins

Breaking: Bitcoin Might Dip to $70k Support Point The price of Bitcoin is poised to dip to the $70k support to shake off weak hands before picking liquidity up albeit the market is generally bearish.
The $70k support is feasible or nearest support zone for bitcoin to consolidate before going back up. In similar context, as per data from crypto quant the open interest of Bitcoin on all exchanges is down 0.45% losing roughly $29 billion.
This data further solidifies our bearish thesis on $BTC.

DOGECOIN markup ... ICC He is an example of bearish icc markup on dogecoin
Indication, correction, contination - icc shout to tradesbysci
Trade responsibly good luck

Bitcoin Weakness Unfolding – Kijun Break Confirms Bear Bias🚨 BITCOIN (BTC/USD) BEARISH PROFIT PATHWAY 🚨
Hey Traders! 👋 A compelling bearish setup is unfolding on PURPLETRADING:BTCUSD. This swing trade plan leverages a classic Ichimoku signal with a sophisticated entry method for optimal risk distribution.
📉 THE BEARISH THESIS:
The bearish momentum is confirmed by a decisive breakout BELOW the Kijun Sen (Baseline). This indicates a significant shift in medium-term momentum, favoring the sellers.
🎯 MY TRADING PLAN:
Direction: BEARISH 🐻
Style: Swing Trade
Strategy: "The Thief" Layer Entry
⚡ ENTRY STRATEGY (The "Thief" Layer Method):
Instead of one risky entry, we use multiple sell limit orders at key resistance levels. This averages our entry price and builds a position as price moves in our anticipated direction.
Proposed Sell Limit Layers:
Layer 1: 96,000.00 🟥
Layer 2: 94,000.00 🟧
Layer 3: 92,000.00 🟨
Layer 4: 90,000.00 🟩
You can adjust the number of layers and prices based on your capital & risk appetite.
🛑 RISK MANAGEMENT (STOP LOSS):
A safety stop loss is placed above a key resistance zone at 98,000.00.
⚠️ IMPORTANT NOTE: This is MY plan. You MUST adjust your stop loss based on your personal risk tolerance and strategy. Protect your capital!
🎯 PROFIT TARGET (TAKE PROFIT):
Our primary target is 82,000.00, where we expect a confluence of:
Strong Support from the Triangular Moving Average (TriMA).
Oversold Conditions on lower timeframes.
A potential bull trap being sprung.
💡 SMART EXIT TIP: Consider taking partial profits on the way down. You are NOT obligated to hold until the final target. Secure profits according to your own plan!
🔍 RELATED ASSETS & KEY CORRELATIONS:
Watching these related markets can provide confirmation and strengthen the thesis:
TVC:DXY (U.S. Dollar Index): 🟢 A stronger DXY often puts downward pressure on Bitcoin. Watch for bullish momentum in the dollar as a tailwind for this bearish BTC setup.
BITSTAMP:ETHUSD (Ethereum): Crypto majors often move in tandem. If Ethereum shows similar weakness and breaks key supports, it confirms a broader crypto market pullback.
^SPX (S&P 500 Index): In recent years, BTC has shown correlation with risk-on assets. A declining stock market could accelerate the sell-off in Bitcoin.
AMEX:GBTC (Grayscale Bitcoin Trust): Monitor for significant discounts or premiums to NAV, as it can reflect institutional sentiment.
✅ LIKE & FOLLOW if you find this analysis helpful! It helps the algorithm and keeps you updated on my latest market insights. ✅
📣 Let me know your thoughts in the comments! Are you bullish or bearish on Bitcoin here? 👇

Bitcoin (BTCUSDT) Technical Analysis – December 5, 2025Strong downside momentum is currently dominating on the lower timeframes. Bitcoin has once again dropped below the $90k mark.
This entire drop from the ATH (~125,769) fits beautifully into the classic Fibonacci retracement structure — price got rejected right at the 0.618 level (94,657), and despite a temporary bounce off the 0.5 retracement (99,980), bulls lacked the strength to push further. Currently, we’re trading below the 0.382 level (88,799), which is now acting as resistance — and it’s no coincidence that price today has been struggling exactly at that zone.
In addition, today’s move has perfectly filled the Fair Value Gap (FVG) from April 22, which is now completely closed. That gap also lines up with the 0.382 level of the local (smaller) Fibonacci retracement.
At the local bottom (around 83,500), we saw a classic swing low with a long lower wick, followed by a bullish candle — this is forming the early signs of a bullish engulfing pattern. Volume-wise, that candle printed a significant spike, showing strong buyer interest. Looking at cumulative volume, it’s clear that there was a notable absorption of sell pressure by larger players in that zone.
If bulls fail to reclaim the 88,800 level, a retest of the 0.886 Fibo (82,929) is likely, or even a deeper drop toward the 1.272 and 1.414 Fibonacci extensions (77,012 and 74,058). Just below that, we have a strong demand zone around 72,000–74,000, which overlaps with previous consolidations and historical FVGs.
What’s Next? 🙄😎
The current move looks like a potential end to the corrective wave, with a local bottom near 83,500, key support at 82,900, and resistance at 88,800. If price can break above that and close a daily candle higher, then 94–96k is back on the table. On the flip side, if the red descending channel holds, we could see further liquidation sweeps down toward 74–77k.
Volume signals and oscillator momentum are starting to flash a bullish bias, but bears still have the upper hand until the 0.5 Fibonacci level (99,980) is broken and the descending channel is invalidated with a proper close above it.
For now, all eyes on how price reacts around 88,800 and 92,000 — those are the key breakout levels that could confirm a larger trend reversal.

BitcoinBTCUSD
- Completed " 12345 " Impulsive Waves
- RSI - Divergence
- Change of Characteristics
- Fair Value Gap
- Order Block

Breaking:Bitcoin Might Test $50k Support Amidst Market SentimentBitcoin tanked 5% today from a high of $90k+ to the $80k zone albeit there is not any fundamental news tight to the market correction.
However Onchain metrics hints on Bitcoins possible voyage to the $50k support. as per data from crypto quant, the open interest of CRYPTOCAP:BTC on all exchanges is down 4% losing over $24B.
Similarly, the funding rates of CRYPTOCAP:BTC on all exchanges as per data from that same source is down 15% essentially connoting traders are losing interest on CRYPTOCAP:BTC hence they are selling it.
IS IT TIME TO SALE BITCOIN?

111k Bitcoin top before the 50%+ plunge - THE BIG SHORTIn my previous idea, I explored the technical readiness for Bitcoin to have a strong downturn towards 50k or lower.
I believe we are at the twilight right before the storm.
As with everything, we recognize that price doesn't just continually move down, but that there are retraces in any strong move up or down where big firms are able to offload (in a downturn) or add positions in an upturn.
In our scenario, I believe that large firms have sold into buyers as a test of strength, and buyers were unable to keep prices going higher. The proof is in the imbalances that were created at the quarterly low.
What we are looking for now is the initial impulsive correction up, typically this is points 1 and 2 in a bearish Elliot Wave bearish impulse. the 3rd point, which is also the strongest is expected to come next year.
What we are doing now is setting ourselves up to either exit Bitcoin positions, or start shorting Bitcoin.
We have a solid point of time reference for taking out liquidity, which is actually at the high of THIS closing month. I foresee December being bullish for Bitcoin, but again, this is just before the fall.
The liquidity shown inside of our OTA zone gives us four different types of liquidity:
-Trendline liquidity near the Nov Monthly highs
-The actual high in Nov
-A previous iFVG
-A Current FVG
Here is an example of what we are looking for once prices reaches into our zone:
-The price MUST manipulate the current monthly high (Nov)
-If the price creates a bullish FVG into the high, it must invert it and close below it.
-The price MUST create a bullish FVG on the way down.
We should be looking for these signs in the DAILY chart. Once we have them, short the position.
Be forewarned that it is NOT impossible for the price to manipulate ATH again, so if you do enter this short, set your SL at $132,000.
Again, price MUST show willingness to create imbalances to the downside within the OTA! If this does not happen, you cannot short!
Theoretical position:
Initiate short: apx $111,700 (or whenever there are clear imbalances within OTA)
SL: $132,000
Take Profit 1: $74,720
Take Profit 2: $57,800 (61.8% of the larger move in my previous idea)

Bitcoin BTC Bearish Momentum: My Trade Plan ExplainedI’m keeping a close eye on Bitcoin (BTC) right now. On the 4H timeframe, price action remains firmly in a sustained bearish trend. I’m anticipating a possible continuation to the downside.
If BTC holds at the current level and fails to retrace into the imbalance highlighted on the 1H chart — and we see a bearish rotation with a clean break in market structure — I’ll be watching for a potential short setup.
⚠️ Not financial advice.
