Bearish outlook for Bitcoin!Bitcoin Cycle Analysis and Trade Thesis
For more than a decade, Bitcoin has evolved through recurring cyclical patterns, consistently respecting long-term moving averages and two logarithmic regression curves — one defining market peaks and the other defining troughs. I expect this structural behavior to persist over the coming years.
On Friday, as INDEX:BTCUSD briefly topped 123,000, I initiated a bear put spread on NASDAQ:IBIT (50/45 strike), expiring January 2026.
Target: BTCUSD ≈ 70,000.
If this target is not reached by late 2026, I will close the position regardless of price.
Bearish Counterpoints
“Never trade against the trend” — Bitcoin has remained structurally bullish since inception.
“No parabolic top” — Historically, bear markets have emerged only after parabolic blow-offs, which are not currently visible.
“No fundamental trigger” — Major bear phases have often begun with clear catalysts (e.g., Mt. Gox invalid transaction issues, Mt. Gox collapse, China’s mining ban…), none of which are present now.
I admit it feels somewhat awkward to go short while everyone else is buying.
But in trading, profit often comes from being contrarian — buying near the bottom when fear dominates, and selling near the top when euphoria takes over.
And one last thought: even if I believe crypto will still exist in 50+ years — stablecoins, for example, are undeniably useful for fast money transfers and cross-border payments — I expect many of the most speculative assets to trade far closer to zero than to today’s prices.
Bitcoin, along with others tokens, remains, in my view, vastly overvalued.
Bitcoinpricetrendanalysis

bitcoinbtc usdt daily analyse
time frame 4 hours
risk rewards ratio > 5 woooow
target 123.000 $
btc is in the down side of my critical red box
here is good area to pump
LS is very tight to decrease my probably damage
so I open a long position to win

Bitcoin Trap or Breakout? Triple Top or Hidden Accumulation? Bitcoin is stalling at key resistance after a massive rally… but is this a distribution trap before a pullback, or accumulation building for the next breakout?
Huge volume with small candles and declining momentum raises the question: Are we topping, or loading for liftoff?
Watch the chart, decide for yourself and share your thoughts in the comment section — Distribution or Breakout?
Thanks for your time

BTC Trade Setup: Dip Buy Zone at 113.8K, Breakout Above 115K1. Trend
BTC is currently in a short-term uptrend (multiple BOS and higher highs).
Price is stalling around Fib 0.5–0.618 zone (114,800 – 114,900).
The uptrend line is still holding for now.
2. Key Levels
Resistance: 114,800 – 115,000 (Fib 0.5–0.618).
Support zones:
113,800 – 114,000 (nearest FVG).
113,200 – 113,400 (previous structure + FVG).
111,800 – 112,200 (deeper FVG if correction extends).
3. Trading Plan (scenarios)
Scenario 1 – Buy with trend:
Wait for retracement into 113,800 – 114,000 zone.
Entry: Buy inside this zone.
SL: Below 113,600.
TP1: 114,800 – 115,000.
TP2: 115,500+.
Scenario 2 – Short-term Sell:
If price breaks below the trendline + closes under 114,000.
Entry: Sell on pullback.
TP1: 113,200.
TP2: 112,200.
4. Outlook
Short-term: Likely to retrace into 113,800 – 114,000 FVG before retesting 114,800 – 115,000 resistance.
If breaks above 115,000, next bullish target is 115,600 – 116,000.
If loses 113,800, a deeper correction toward 113,200 – 112,200 is expected.

Bitcoin Breaks Through Key Support Band — Price May Crash SoonAt the time of writing, Bitcoin trades at $111,542, reflecting a 4.7% weekly decline. The crypto king remains stuck below the $112,500 resistance, unable to attract enough momentum to flip the level into support.
If bearish pressure persists, Bitcoin could break through $110,000 support, opening a path to $108,000. Continued selling could extend the drawdown further, dragging BTC to $105,000 in the near term.
However, if investors step in to stabilize price action, Bitcoin could reclaim $112,500 as support. A successful bounce from that level would challenge the prevailing bearish narrative, potentially setting the stage for recovery and invalidating the downside outlook.

BTC 4H👁👁The pullback we were waiting for, pay attention to the 113K area, although I already have a position at 114200

Bitcoin Breaks Key Resistance – Upside Targets in Focus...Bitcoin has been consolidating below the $113,000 resistance level over the past few sessions. On the hourly timeframe, price has now successfully broken above this barrier and is sustaining the breakout.
📈 Trading Outlook:
* A pullback towards $113,000 could offer a favorable long entry opportunity.
* Upside Targets:
* First target: $117,000
* Second target: $122,000
The breakout and successful close above resistance suggest strong bullish momentum, provided price holds above the $113,000 zone.
Bitcoin Price History Says BTC Needs To Crash 8% To Form New ATHAt the time of writing, Bitcoin trades at $112,221, holding firm above the $110,000 support. This resilience reinforces the four-month uptrend line and signals potential short-term gains. The momentum is intact, with BTC eyeing higher levels.
If sustained, Bitcoin could climb past $112,500 and head toward $115,000. Yet to reach a new ATH, history suggests BTC might need to drop to $101,634 first, setting the stage for a stronger breakout.
On the flip side, if profit-taking escalates, BTC could slip toward the retracement level sooner. But should fear-driven selling dominate, the price risks falling below $100,000, which would invalidate the bullish outlook and extend the correction phase.

BTCUSD📊 BTC/USDT Analysis
✅ Update: TP2 successfully hit as per plan. (As in Previously shared plan)
⚠️ Catch: BTC made a new 1H HH around 113,434, but failed to break the 4H resistance at 113,506±.
🔎 Key Observations:
4H structure remains bearish (Lower Highs intact).
1H still holding bullish structure with HLs along the trendline.
Price is currently retesting our buying trendline zone, showing respect to HLs.
🎯 Scenarios:
Long 📌 Plan:1
Aggressive traders:
1️⃣ Bullish Case (Buying Zone Active)-CMP
BTC is at the trendline support zone → early longs possible
Long 📌 Plan:2
Conservative traders: Enter long only if BTC breaks & holds above 113,500±.
Wait for a bullish 4H confirmation candle at the buying zone before entering long.
📌 Short Plan:
Bearish Case (4H Continuation)
If BTC breaks the trendline & last HL of 1H TF , then Short for 4H bearish pattern continuation.
This would invalidate the current buying zone and 1H Bullish Pattern.
📌
Trade with proper risk management.

History Suggests Bitcoin Price Is Fated To ConsolidateBitcoin crossing the $112,500 resistance is encouraging, providing a path toward $115,000. This level is crucial for attracting new capital inflows, which would validate the recovery and increase the likelihood of sustained upward momentum.
However, historical patterns suggest consolidation remains likely. Bitcoin may settle under $115,000 or slip below $112,500, with sideways price action dominating the short term as the market absorbs recent volatility.
If profit-taking accelerates, Bitcoin could face sharper declines. A drop back to $110,000, or even a loss of this support, would weaken sentiment and invalidate the bullish thesis, leaving BTC vulnerable to extended consolidation or further downside.

BTC/USDT Crypto Heist - Bullish Breakout Blueprint!🔥 Thief Trading Style: BTC/USDT Bullish Heist Plan 🔥
Greetings, Money Makers & Market Robbers! 🤑
Ready to execute a daring heist in the Bitcoin vs. Tether (BTC/USDT) crypto market? 📈 Our Thief Trading Style combines technical precision and fundamental insights to target a bullish breakout. Follow this charted strategy to ride the wave and exit before the risky Red Zone. Let’s grab those profits together! 💪🎯
---
📊 Trade Setup: The Heist Plan
- Market: BTC/USDT (Crypto) 🌐
- Bias: Bullish Breakout 🌟
- Timeframe: 1D (Swing Trade) ⏰
Entry 📈:
- Breakout Entry: Wait for a clean breakout above the Moving Average (MA) at 108000. Place Buy Stop orders just above 108000 to seize the momentum. 🚀
- Pullback Entry: For lower-risk entries, set Buy Limit orders at the recent 15M/30M swing low (e.g., 105000-106000) to catch pullbacks. 📍
- Trader Tip: Set a TradingView alert for the 108000 breakout to stay ahead of the move! 🔔
Stop Loss 🛑:
- Breakout Traders: After the breakout confirms, place your Stop Loss below the recent 1D swing low at 96000 to guard against reversals. ⚠️
- Pullback Traders: Tailor your Stop Loss to your risk appetite (e.g., 1-2% of account). Adjust based on lot size and multiple orders. 📏
- Risk Alert: This heist is high-stakes! Stick to disciplined position sizing to protect your capital.🔥
Target 🎯:
- Aim for 122000, near the risky Red Zone (an overbought area prone to consolidation or reversal). 🏴☠️
- Exit Strategy: Consider taking profits early if bearish signals (e.g., high volume, reversal candles) emerge near 122000. 💸
Scalpers 👀:
- Stick to Long-side scalps with tight trailing stops. Join swing traders for the full heist or scalp quick moves if your capital allows. 💰
---
📡 Why This Heist Has Potential
BTC/USDT is in a neutral trend with strong bullish prospects, driven by:
- Technicals: A breakout above the 108000 MA, backed by higher lows on the 1D chart, signals robust momentum. 📊
- Fundamentals: Institutional buying and positive crypto sentiment (check COT reports) fuel upside potential. 📰
- Seasonal Trends: Bitcoin often rallies in Q2, aligning with our setup. 📅
- Intermarket Factors: USD weakness and altcoin strength could lift BTC higher. 🌎
---
⚠️ Risk Management: Secure Your Gains
- News Caution: Skip new trades during major news events (e.g., CPI, FOMC) to avoid volatility spikes. 🗞️
- Trailing Stops: Use trailing Stop Loss to lock in profits as price nears 122000. 🔒
- Position Sizing: Limit risk to 1-2% of your account per trade for a safe heist. 🚨
---
💥 Power Up the Heist! 💥
Join our Thief Trading Style crew by liking, commenting, and following for more high-energy trade plans! 🚀 Your support strengthens our market raids, helping us profit with precision. Let’s conquer BTC/USDT together! 🤝🏆🎉
Stay Sharp: Another heist plan is on the horizon. Keep your charts locked and loaded, traders! 🐱👤😎
#BTCUSDT #Bitcoin #Crypto #Bullish #SwingTrading #Breakout

Bitcoin Breakout Watch: Key Levels Ahead...Bitcoin is consolidating in a tight range on the 1-hour timeframe and is showing strong momentum as it tests the $109,500 resistance zone. A decisive breakout and sustained close above this level could trigger a move toward the $112,000 mark, signaling bullish momentum building in the market.
Keep a close watch on volume confirmation for a stronger breakout signal. 📈
Bitcoin Holds Above $113K but Faces Persistent Selling PressureBitcoin Holds Above $113K but Faces Persistent Selling Pressure
Bitcoin remains range-bound despite a positive start to the day, trading near $113,011, up 1.8% in the past 24 hours. Earlier this month, the leading cryptocurrency reached a record high above $124,000 on optimism about interest-rate cuts. Since then, it has pulled back but is attempting to rebound from recent lows around $110,000, as President Donald Trump increases pressure on the Federal Reserve to lower rates.
Lower interest rates typically boost demand for risk assets like cryptocurrencies and weaken the U.S. dollar, both factors supporting Bitcoin’s valuation.
Hyblock’s liquidation heatmap shows BTC absorbing bids in the $111,000–$110,000 range during the weekend sell-off, with another liquidity cluster near $104,000.
While a deeper drop toward $104K looks unlikely for now, institutional selling continues to outweigh retail demand, limiting upside potential. Traders seeking a consolidation phase should watch the anchored aggregated daily CVD for signs of easing sell pressure and shifting sentiment.

Bitcoin buy Soon as soon possibleBitcoin buy Soon as soon possible
The live Bitcoin price today is $111497.14 USD with a 24-hour trading volume of $64109128491.21 USD. We update our BTC to USD price in real-time.

BITCOINBTC is showing signs of weakness after breaking structure on the daily timeframe. I’m watching for price to retrace into the 4H FVG before continuing lower
This is just my personal view — not financial advice. What do you think? will BTC respect the FVG and drop, or push higher? 🚀📉

Bitcoin Profits Hit 2-Month Low, How Are Investors Reacting?BINANCE:BTCUSDT current price is $111,653, falling through the $112,500 support level. This zone has held strong since early August, offering a key buffer against deeper losses. For now, price action shows consolidation rather than collapse.
In the span of one week, BINANCE:BTCUSDT profits have declined sharply, hitting a two-month low. The price drop has pushed several addresses out of profit, reducing overall realized gains. Such drawdowns often follow overheated conditions, which may have marked a recent market top.
Given the current sentiment and net accumulation, BINANCE:BTCUSDT could see a bounce to $115,000 . If buying pressure increases and macro support builds, BTC might stabilize above this resistance. Alternatively, it may continue to trade sideways between $112,500 and $115,000 until clarity returns.
However, if accumulation slows and selling resumes, BINANCE:BTCUSDT may drop to $110,000. A move this low would mark a near two-month bottom and could expose BTC to increased downside risk.

Bitcoin on Edge: Bearish Momentum Building Below $111,800🚨 Bitcoin Alert: Key Support Cracks! 🚨
Bitcoin has slipped below the crucial $111,800 support on the 4H chart, even as rate cut cues try to lift sentiment.
📉 If BTC closes another 4H candle under $111,800, this breakdown could gain momentum, eyeing the $105,000–$107,000 zone as the next major support area.
⚠️ Watch price action closely — failure to reclaim this level may accelerate the bearish move.

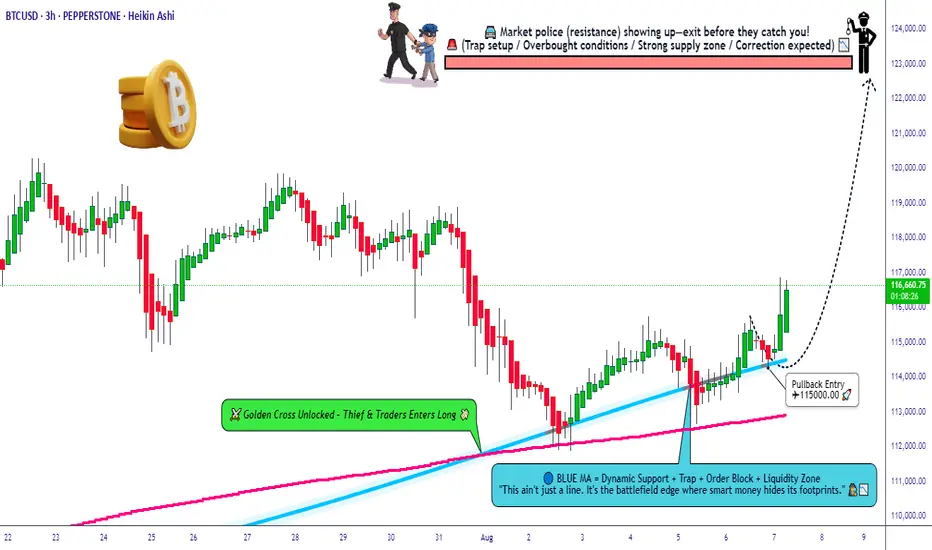
Can the Thief Rob BTC Pullback Before the Police Arrive?🚨 BTC/USD 💰 Bitcoin Breakout Heist Plan – Robbers in Action 🚀 🚨
Asset: BTC/USD “Bitcoin vs U.S. Dollar” — Crypto King Market
📊 Plan: BULLISH BREAKOUT RAID
🎯 Target: 123,000.00 🎯 — Police Barricade Resistance + Overbought Trap Zone
🔒 Entry: ANY PRICE LEVEL — Thief avg pullback entry at 115,000.00
🛑 Stop Loss: 113,000.00 — Below the Laser Tripwire
🎩 Thief Entry Blueprint 🕵️♂️
The vault’s trembling. The thief’s not waiting.
Layered limit orders are being deployed like smoke bombs — we strike anywhere, anytime, with stealthy precision. No begging for dip, we rob it raw. 💣🧨
📉 Risk Protocol Setup 🛡️
SL: Under local support – cut fast if alarms trigger.
Risk light, rob heavy. Use tight stops or trailing guards to escape with the loot.
📈 Why Rob Long?
Bullish momentum building like a pressure cooker 💥
Resistance zones turning into trapdoors for late bears 🐻
Liquidity pools above — ripe for raid
Sentiment flips, on-chain signals, and macro tailwinds align ⚡
📌 Robbery Reminders:
NO SHORTING — This is a one-way heist 🚷
Avoid news-time chaos ⛔
Use multiple entries (layer style) and escape plans.
Overbought ≠ exit — it’s the bait for the next raid 🧠
💖 LIKE = SUPPORT THE CREW
Every like boosts the Thief Trader movement — more heat, more setups, more wins.
Smash Boost. Share the Heist. Stay Robbing. 🐱👤📈🔥
🔔 Stay tuned. Next breakout blueprint dropping soon.
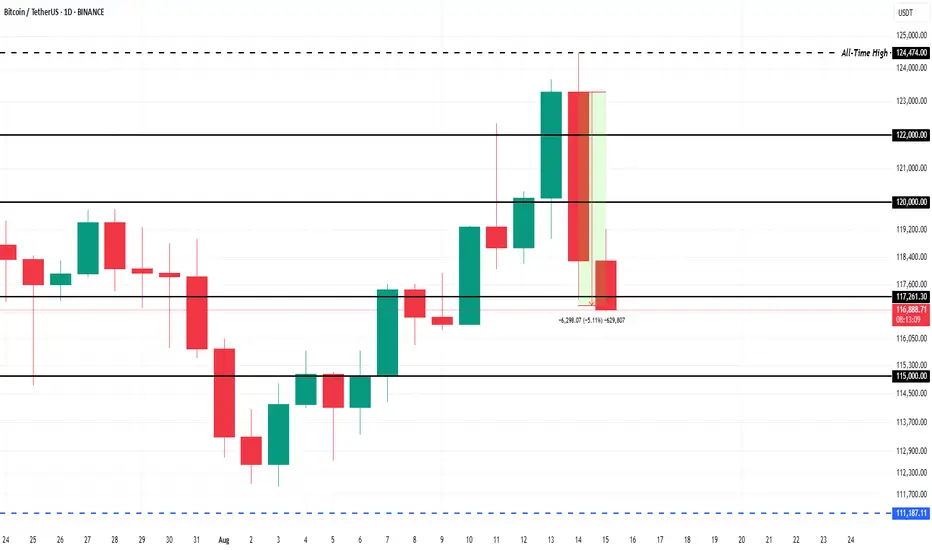
Why are Whales Moving Bitcoin to Binance? Weekly Whale WatchBINANCE:BTCUSDT price is currently trading at $116,830 after slipping below the key $120,000 level. The price fell from the recent ATH of $124,474 , showing some volatility. Despite this decline, Bitcoin is maintaining support above $119,000, suggesting that the recent dip could be a short-term correction.
In the past 24 hours, Binance has seen a massive increase in BINANCE:BTCUSDT deposits, with 6,060 BTC, worth approximately $722 million , added to the exchange’s balance. This surge primarily comes from whales
Given the mixed market sentiment, BINANCE:BTCUSDT could potentially reclaim $120,000 as a solid support level. If the bulls manage to maintain this level, Bitcoin might be able to recover from the recent dip and push towards $122,000.
However, if selling pressure intensifies, BINANCE:BTCUSDT price may fall through the $117,261 support level . A deeper drop could take the price to $115,000 or lower, which would invalidate the bullish outlook and indicate further market weakness.
BTC- Test of the Multi Year Trend LineBTC- hitting that trend line top all these years, at a crucial price now. IF we see it cross this, we can expect a new trend upwards, rejection here on the MONTHLY TF= we may not see new highs. Wicks will not count, it will be the closing. Keep a watch

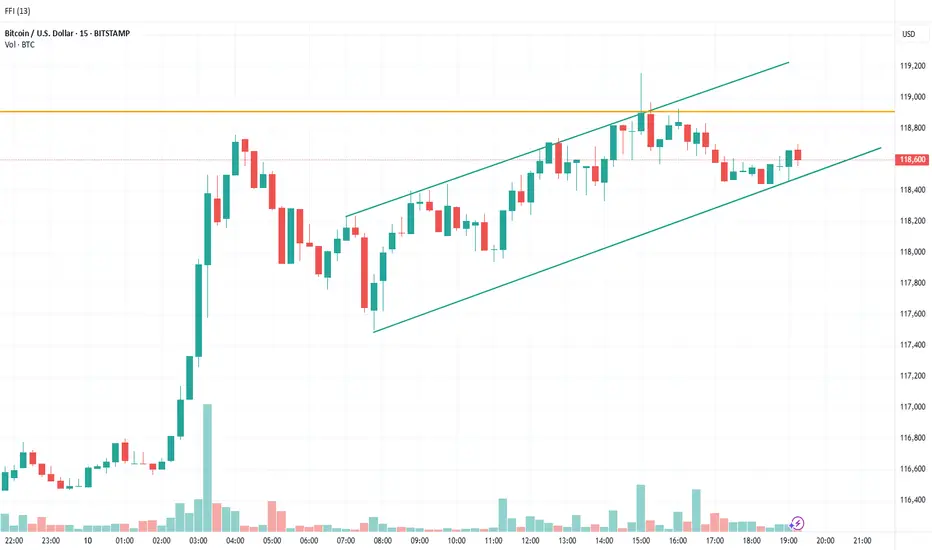
Trading Bitcoin using 15-min TF with 4-hour ConfluenceI am forecasting the price direction for Bitcoin using the price action movement which shed light on the market maker price manipulation and psychology. The current price movement in Bitcoin is bullish and is trading within a upward range on the 15min TF and will confirm the upside to retest the ATH if break above the confluence zone highlighted by the orange color line.
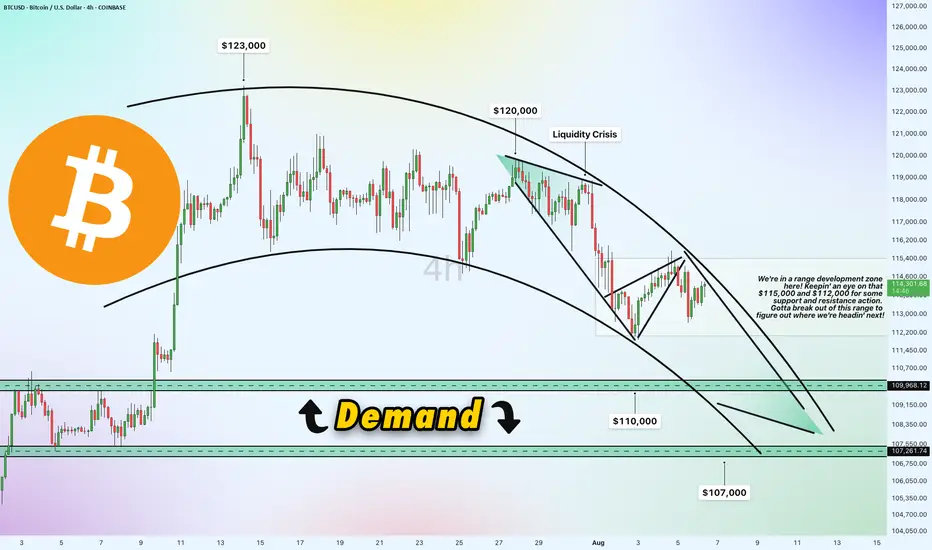
Bitcoin 4h Chart Update [Tight Range / Breakout Opportunities]Breakout Opportunities
We're in a range development zone here! The chart shows Bitcoin (BTC/USD) trading within a tight range, with key levels at $115,000 and $112,000 acting as critical support and resistance zones. The price recently peaked near $123,000 but has since pulled back, forming a liquidity crisis zone around $120,000 where selling pressure kicked in. A breakout above $115,000 could signal a move toward $120,000 or higher, while a drop below $112,000 might push it toward the demand zone. Gotta break out of this range to figure out where we're headin' next!
Demand Zone
$110,000 & $107,000
Price slipped down from $120,000 due to a lack of buying liquidity, potentially it will land into a demand zone between $110,000 and $107,000. This area could act as a strong support level where buyers might step in. If the price holds here, it could bounce back toward the $112,000-$115,000 range. However, a failure to hold this zone might see it test lower support around $107,000 or even $105,000.
Direction and Possible Ranges
Upward Potential: If Bitcoin breaks above $115,000 with strong volume, the next targets could be $120,000 (liquidity crisis zone) and potentially $123,000, aligning with recent highs. A sustained move above $120,000 might open the door to $125,000 or beyond.
Downward Risk: Should the price fail to hold above $112,000 and break below, it could slide into the demand zone ($110,000-$107,000). Further weakness might push it toward $105,000, a psychological and technical support level.
Current Trend: The chart shows a descending trendline from the $123,000 peak, suggesting bearish pressure unless a decisive breakout occurs. The 4-hour timeframe indicates indecision, with the range-bound action hinting at a potential volatile move once direction is confirmed.
Keep an eye on these levels for the next big move!