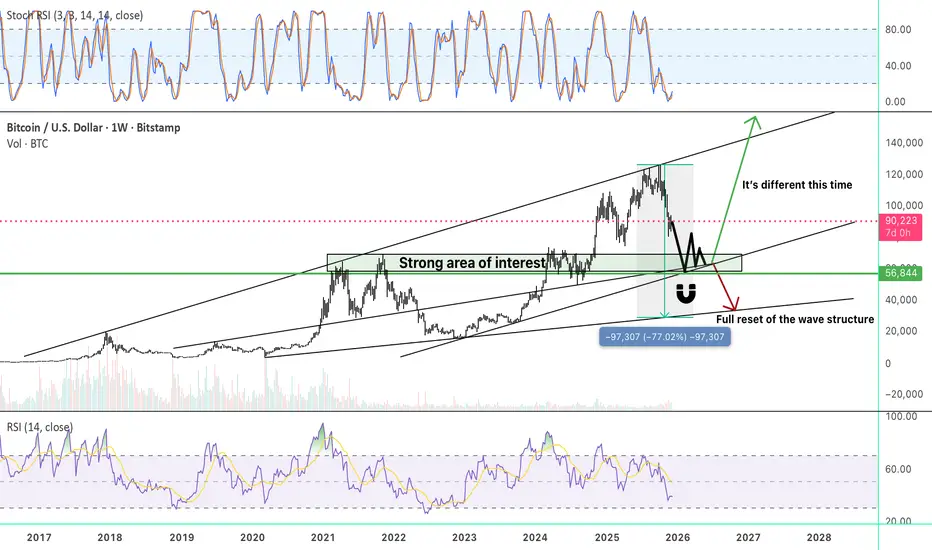
Signal v. Noise: The Power of the Macro Structure | BTC Edition As shown similarly in my macro chart of CRYPTOCAP:XRP , we again see similar macro trend lines that do matter.
While I do feel that were absolutely well into a bear market, these trend lines combined with the truncated nature this cycle and the cycle prior leave me curious of a larger shockwave at play stemming back from the 2017 market cycle top. “Will this cycle be different” is the big question we will soon have to confront. Depending on how these confluences interact will strengthen the probability of which direction the market will trend, and analyzation of how these confluences react to one another must not be taken lightly.
Since 2017, the charts might be telling us to not get too comfortable and that in this new paradigm of institutional backed digital beans, we may want to tread lightly and be increasingly vigilant to not fall into the similar rut that prior cycle timeframes have foretold.
I hope this chart helps you. None of this is financial advice, and best of luck with your current and future trades!
Bitcoinshort
MSTR - How to profit from a $140 short target🔱 The MS ponzi is taking its toll. 🔱
I’m not laughing, because it’s genuinely unfortunate for everyone who believed in this scam.
But today, I don’t want to rant about that.
I want to show how one could profit from a potential drop of more than $100.
As an Andrews Pitchfork trader, I know there’s roughly an 80% chance that price will reach the centerline. From there, price either reverses in the opposite direction or breaks through the centerline to continue its journey.
That’s exactly what happened with MSTR.
You can see how the price first reached the centerline, held there a few times, and then broke it. Since then, it’s been following the rulebook by moving further to the downside.
Now, there’s another rule worth remembering:
price often tests or retests the line it just broke.
In our case, that line is the centerline.
This means we could be lucky enough to get a pullback to the centerline, and that would be a good level to consider shorting.
The target is usually the opposite line of the centerline, which in our case is the L-MLH (Lower Median Line Parallel).
👉 If you want to learn the full framework and its rules, check the links for free material.
I hope this helps many of you, and I wish you all good profits.

Bitsounis / BTCUSDT Best DCA entrysBitcoin since it lost the $82,000 level for me the target was this big orderblock in the three month candles.
There are 3 very good DCA entries in there. $71,700, $65,000, $56,500.
We have opened both of them. Now what we want is to trap at these levels for several days but the big time frames to close with a bull wick.
If it doesn't do that the target is then much lower

Bitcoin Deep dives into Support zone - Can it Hold position ?
That Deep Dive was a little surprisingand Quick but Given the speed of events right now, I was Stupid to think PA would hang around on the upper lines of support.
The Bears seem to want to show Strength.
It is now time for the Bulls to Show us they are Here.
PA went right down to the 3 Fib Extension at approx 60K usd.
Do we have support here ?
The 4 hour chart
We can seea Very Clear line of support off the Bottom line as PA touched it and bounced right back up to the Middle line.
It is this line that now needs to be Crossed and held as support.
The 1 hour chart is not one I use very often However, when it comes to Situation like this, It is perfect for showing us the initial stages of recovery....or not...
As we look on the 4 hour chart, we see PA appears to have Halted at the Dashed Middle line.
1 hour chart
The ! hour actualy shows us that PA did get over that middle line but then came back down to test it as support.
At the time of writing, this line is holding....................
Let me show you another 1 hour chaart
This shows us a Close up of PA and 3 SMA's
Orange is 9 SMA
Green is 14 and RED is 50
Se how PA is sitting on the 9.......so long as it remains there....we are able to piush higher.
But do remember, the 1 hour charts are "Noisey" , easy to be mislead....Only use to see initial stages.....No more.
The 4 hour shows us another story]
Here you can see how the 9 SMA actually REJECTED PA.
SO, Do we have support Here ?
Potentially, YES but there is yet to be better confirmation of its ability to Keep PA here for a While.
This
area is a Superb Buying Area BUT remeber, this is only a 50% draw down from ATH.
If We are to have a Traditional Bear, we have anoterh 30% to go......
But we simply do not know if that will happen.....................
Caution..........

BTC/USDT Analysis. Market Panic
Hello everyone! This is the CryptoRobotics trader-analyst with your daily market update.
Yesterday, Bitcoin broke a key support level. While the breakdown itself was expected, as mentioned previously, the magnitude of the move was significantly stronger than anticipated. At its peak, the decline exceeded 7%.
The $86,000–$84,800 zone (anomalous activity) was broken, and only upon reaching the major buy zone at $84,000–$82,000 (strong volume anomalies) did the sell-off temporarily pause.
At this stage, the scenario remains unfavorable for buyers. Defensive activity is present, but it is mainly driven by limit orders — market buying pressure is largely absent. Additionally, a mirrored resistance zone with strong selling pressure has formed above at $84,500–$86,000.
A retest of this area may provide a solid opportunity to re-enter short positions. The current context suggests an elevated probability of further downside continuation toward the technical level around $74,500.
A reversal from the current support is possible, but only if price tests the $84,500–$86,000 zone and sellers fail to continue the downward move. Until such confirmation appears, the priority remains on short setups.
Buy Zones
$84,000–$82,000 (strong volume anomalies)
Sell Zones
$87,000–$88,000 (selling pressure)
$84,500–$86,000 (mirrored zone, selling pressure)
$92,600–$93,500 (volume anomalies)
$96,000–$97,500 (selling pressure)
$101,000–$104,000 (accumulated volumes)
This publication is not financial advice.

BitCoin long-term forecast 2026 dropping to $45k?Bitcoin monthly demand level is under attack. New low printed.
The yearly timeframe is trending up and the dump has started, hopefully. CRYPTOCAP:BTC can continue the dump as explained a few weeks ago.
Next stop is the monthly demand imbalance at $64k. No longs are adviced in the middle or a long-term dump.

Bitcoin Macro Risk Given the macroeconomic and geopolitical backdrop, BTC is more likely to react negatively to Trump's speech today, as:
- An armada led by the aircraft carrier USS Abraham Lincoln has approached Iran.
- The USS Abraham Lincoln costs over $2.5 million per day to maintain.
- The USS Abraham Lincoln, the largest aircraft carrier in the world, costs the US approximately $1 billion to maintain.
- Trump's man is more likely to be the Fed's choice, meaning there's room for maneuver while Jerome Powell, who has a poor relationship with Trump, is in office, as Powell doesn't want to lower rates. Without rate cuts, the market is simply suffocating. It's also worth considering that Trump is a money-smart guy, and such spending is likely to trigger certain events.
- We have over $100 million in liquidity accumulated in BTC, which needs to be collected.
- Many are now expecting growth, so downward manipulation is more likely. Today's speech is more likely to disrupt all patterns and structures with its manipulative downward movement.
Full breakdown with levels and graphs on the website

Bitcoin lost it's support completelyOh my…
Here we are again: opening and closing below the centerline. The CIB line is broken as well.
This is now the second time Bitcoin has lost the centerline support. Before that happened, it gave us a Hagopian - a large one.
I stand by my target of 60K, unless a miracle comes down from crypto heaven.
Happy new trading week y'all.

Bitcoin 455 days Rising Wedge Top FormationHello there! Here we can clearly see that bitcoin is putting in a 455 days rising wedge.
It means that every rally is getting smaller, every consolidation is taking less time, meaning bulls have less and less ammo to push the price higher - a sign of exhaustion. Price is becoming compressed and an asset is looking for a resolution (a pattern is breaking up or down).
Also we can clearly see a declining volume of this rising wedge, meaning that that there is less and less interest as the price goes higher. The trend was very aggressive, but bulls could not maintain the velocity of the trend.
And now we have a trendline which is breaking down and the volume is increasing confirming the pattern breakdown. It is like the price was trapped in that rising tide, but because of the lack of momentum, volume the trend could not be sustained anymore leading to this breakdown. At first we lost 50 day Moving average, then 200 day MA, all with very little volume, now we are about to lose 50 week MA, which supported this whole bull market.
Protect your capital.
Stay safe everyone and have a great day!

[CRT] BITCOIN -> Weekly Outlook for the week of January 12Let’s look for the weekly direction for our beloved BITCOIN from a CRT perspective, as we have been doing with other assets since the end of 2025.
First of all, I would like to kindly ask you for a follow and to show some love to this article if you liked it, so I can keep creating this type of content.
Let’s get started. As always, first a bit of context to understand where we are and where we might be heading:
6-month timeframe chart of COINBASE:BTCUSD
On this timeframe (6 months), we can observe a bearish range formed after the close of the last semester candle of 2025, with a target at 112K .
It is worth mentioning that, as we already know, the BIAS for this asset has always been bullish, and we only have one precedent of such a high-timeframe range being completed in the opposite direction in the last ten years , and that precedent occurred during the 2022 correction.
Could this bearish range be completed? In my opinion, anything is possible in this world, but as always from a CRT perspective, we will first be waiting for price around 80.5K (red line on the chart), which is the low of the second semester of 2025 and the first possible reversal point on this timeframe.
Let’s now move down to the monthly timeframe:
Monthly timeframe chart of COINBASE:BTCUSD
On the monthly timeframe, we have a closer target located at 83.7K, which is the low of December 2025, and which we can aim for first, since price must at least go for the November low.
Why does it have to go for the November low if there is no bearish range formed toward that level on this timeframe?
Because from a CRT perspective, to go down, price must take highs, and to go up, it must take lows . November closes with the body outside of October, December is an inside candle which we ignore due to its condition, therefore if price wants to reverse, it must take that low, and if it wants to continue lower, obviously it must take it as well.
Let’s continue, now on the 2-week timeframe:
Biweekly timeframe chart of COINBASE:BTCUSD
Things are getting interesting for our intraday trading. We already have a first target with a high probability of being completed during this month of January, which is the low located at 86.35K, although there are still 7 days left for this low to be confirmed on the biweekly timeframe. Let’s now move down to the weekly timeframe to see if this low makes sense:
Weekly chart of COINBASE:BTCUSD
On the weekly timeframe, with 18 hours left before the candle closes at the moment I am writing this article, the next target is located at 86.675K . If price is going to complete it, it will most likely close inside the biweekly range and confirm the 86.35K target.
To finish this analysis and clearly define the intraday direction, let’s zoom in a bit more and move to the daily timeframe:
Daily chart of COINBASE:BTCUSD
On the daily timeframe, we already have the target we will aim for on Monday once we get confirmations from bearish ranges formed on the 4h, 6h, or 12h timeframes pointing toward lower lows, and we will take first partials at 89.2K .
To take a bit more risk, although it is difficult without having Sunday’s candle closed, I have drawn an optimal selling zone, which is basically Friday’s PO3, since Saturday is an inside candle and we ignore it.
We also need to pay attention to the liquidity taken above on Sunday , as price might start dropping from there:
4h timeframe chart of COINBASE:BTCUSD (optimal sell zone)
And that’s it for my weekly outlook on $COINBASE:BTCUSD.
As you know, if you liked it, please give me a follow so I can keep writing this type of content.
Have a great start to the week and many profits!

Bitcoin Technical Outlook | Bearish Scenario in FocusBitcoin is trading inside a clear descending consolidation structure after a strong bearish impulse from the 116k area. Price has repeatedly failed to reclaim the resistance zone 102,600–98,400 and is now compressing inside a bearish triangle showing weak momentum and lower highs. Multiple BOS and CHoCH signals confirm sellers remain in control. The broader structure is still bearish while price stays below the descending trendline and the 95k–100k supply zone. This consolidation suggests a continuation move lower, with downside liquidity resting below the 73k and 69k levels.
🔻 Trade Plan:
Bias: Bearish continuation
- Sell Zone: 92,500 – 95,000 (trendline + structure resistance)
- Sell Confirmation: Rejection / bearish candle inside the triangle or at resistance
- Targets: TP1: 80,500, TP2: 73,800 (strong low), TP3: 69,000 – 66,800 (major liquidity & fib extension)
- Invalidation: Daily close above 100,000 – 102,600
Note
Please risk management in trading is a Key so use your money accordingly. If you like the idea then please like and boost. Thank you and Good Luck!

Local Bear Flag on BTC ( 78000$-80000$ )After a strong impulsive drop, price has formed a local bear flag — an ascending corrective channel within a broader bearish move. Price action inside the channel looks corrective, with no clear signs of strong demand.
I expect a breakdown from the flag to the downside and continuation of the bearish move in the short term.
Downside target:
$78,000 – $80,000
As long as price remains below the upper boundary of the flag and fails to break out to the upside, the bear flag scenario remains valid.

BTC Post-Cut Rates Bearish BiasMy bias after first post-FOMC hours: Short-term bearish in corrective range
We now have:
Clear liquidity sweep ABOVE 93–93.5k
Break BELOW 92k
Immediate bounce back to low 92's
Short-term structure = bearish, but in the middle of the impulse, not at an extreme. That matters for entries.
93–93.5k = key macro level
Price could not hold; spike → rejection → dump.
That confirms it as strong resistance for now.
Price stabbed below 92k and bounced.
That is first probe below his line, not a clean breakdown yet.
Right now we are in no-man’s-land.
Key short trigger:
Primary: 93–93.5k retest failure
Secondary: Break + retest of 92k from below
Hard invalidation of bear idea:
Daily close > 95k with strong volume.
Key long trigger:
Reclaim & hold 94–94.5k or capitulation flush to 85–88k with strong reversal.
If price just chops between 92k and 93k:
Sit on hands and wait for one of the triggers.

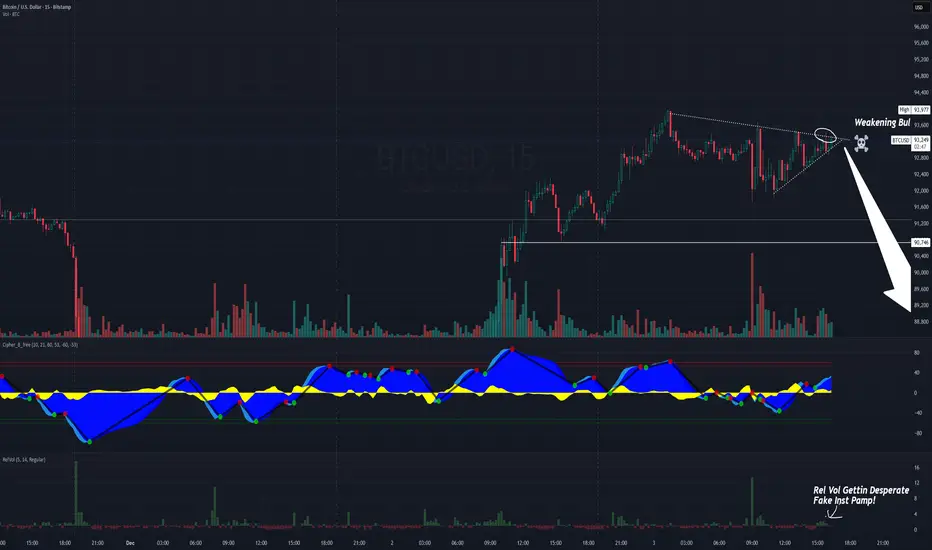
The Bitcoin Meteorite and MSTR falling knifeThe US Trading session just ended and handed Asia a Bitcoin Meteorite. If there's one thing Asia hates - it's fake pumps...and that's all today was on BTC. We'll be lucky if BTC is over $90k when the US market opens tomorrow on 12/4.
Asian session behavior is predictable:
They love to liquidate overleveraged U.S. breakout traders
They fade fake pumps
They push price back toward equilibrium
At the very least we pull back to $92, and while I think $91k is more likely and even $90 isn't out of the question. The other concern is all the benevolent articles coming out about BTC. Larry Fink said bitcoin is the new bellbottoms...or whatever. When they flood the market with bogus 'opinion' pieces, these people only speak because they want to influence retail traders. You really think the CEO of black rock wants to drive the price of BTC UP before they expand their holdings... If they're talking about something...they're selling you a bridge. I think BTC and it's biggest holding company MSTR (which managed to buy only 130 Bitcoins this cycle (BWHAHAHA) is going to crash even harder than it has been. $1.4B in cash reserves to fund $773+ Million in annual dividends while diluting shares is a recipe for bankruptcy and a $.01 share price...
Shorting BTC and MSTR all week long and twice on Sunday.
Bitcoin price prediction 2026-2027 Season Dear Bitcoin investors;
I predict that Bitcoin price movements will move as shown in the chart in the 2026-2027 season range.
There will be short-term upward movements as seen in the chart.
Main trend = It is in a downward trend.
Investors who want to take short-term profits can maintain their positions from appropriate entry levels to sales areas.
Then, sales pressure will continue until the end of the year; I think that the new year will bring ASTRONOMICALLY high profits for bitcoin. Personally, I have sales positions and I am thinking of maximizing my profits by buying these positions in buying areas.
I plan to hold my positions until the time I mark as a suitable buying time, and then start buying transactions towards the end of the year.
I wish everyone a new year
(The information contained herein is my personal prediction and analysis; it does not constitute any investment advice.)

Bitcoin's Next Move: What 4 Timeframes Reveal Right NowWeekly
A sustained move through the key resistance on this timeframe at105,000 to 110,000, could confirm a reversal. For now, the weekly outlook shows a potential market in correction rather than reversal.
Daily
After dropping nearly 5% yesterday, Bitcoin has rebounded sharply today with a gain of about 6.7%. The price is currently up $5775 at $92,060. Today’s low at $86,190 followed yesterday’s deeper dip to $83,814. The daily chart may suggest further upside potential.
4H
Momentum on RSI has turned higher on the 4-hour chart, lifting from oversold conditions and breaking back above the midline. This suggests improving intraday demand and provides a base for further upside if price continues to hold above the recent breakout level. The next resistance sits around 96,500, the prior swing high on this timeframe.
1H
The hourly timeframe shows the price bouncing back above the 50, 100 and 200-hour moving averages, which are currently clustered around $87,500 and $89,320. If the price stays above these converged moving averages, it can signal continued buying pressure in the near term.

111k Bitcoin top before the 50%+ plunge - THE BIG SHORTIn my previous idea, I explored the technical readiness for Bitcoin to have a strong downturn towards 50k or lower.
I believe we are at the twilight right before the storm.
As with everything, we recognize that price doesn't just continually move down, but that there are retraces in any strong move up or down where big firms are able to offload (in a downturn) or add positions in an upturn.
In our scenario, I believe that large firms have sold into buyers as a test of strength, and buyers were unable to keep prices going higher. The proof is in the imbalances that were created at the quarterly low.
What we are looking for now is the initial impulsive correction up, typically this is points 1 and 2 in a bearish Elliot Wave bearish impulse. the 3rd point, which is also the strongest is expected to come next year.
What we are doing now is setting ourselves up to either exit Bitcoin positions, or start shorting Bitcoin.
We have a solid point of time reference for taking out liquidity, which is actually at the high of THIS closing month. I foresee December being bullish for Bitcoin, but again, this is just before the fall.
The liquidity shown inside of our OTA zone gives us four different types of liquidity:
-Trendline liquidity near the Nov Monthly highs
-The actual high in Nov
-A previous iFVG
-A Current FVG
Here is an example of what we are looking for once prices reaches into our zone:
-The price MUST manipulate the current monthly high (Nov)
-If the price creates a bullish FVG into the high, it must invert it and close below it.
-The price MUST create a bullish FVG on the way down.
We should be looking for these signs in the DAILY chart. Once we have them, short the position.
Be forewarned that it is NOT impossible for the price to manipulate ATH again, so if you do enter this short, set your SL at $132,000.
Again, price MUST show willingness to create imbalances to the downside within the OTA! If this does not happen, you cannot short!
Theoretical position:
Initiate short: apx $111,700 (or whenever there are clear imbalances within OTA)
SL: $132,000
Take Profit 1: $74,720
Take Profit 2: $57,800 (61.8% of the larger move in my previous idea)

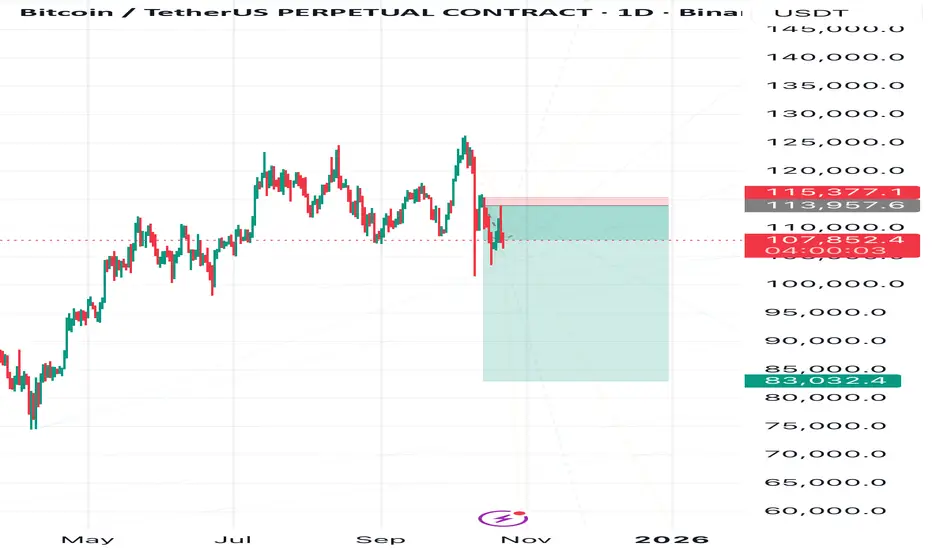
Winter Has Arrived — Bitcoin’s Chill DiveBitcoin’s chart looks frosty — I expect a decline toward 83,000.
The red zone on the chart marks the invalidation area, where my plan will be canceled if price reaches it.
I believe Bitcoin is entering a corrective phase, and the market might need a “cool down” before any new rally can start
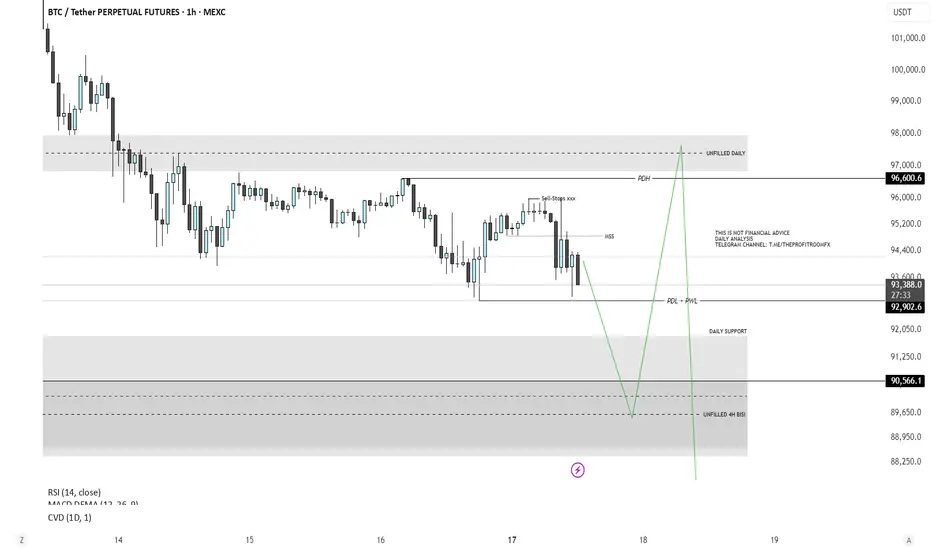
Bitcoin Analysis - Short & LongPrice is anticipated to sweep the previous day’s low (PDL) and previous week’s low (PWL), while also mitigating the unfilled H4 imbalance.
This aligns with a potential retest of the daily FVG support zone before initiating a move to the upside.
There is a clear draw on liquidity toward the buy-side, with both the previous day’s high (PDH) and an unfilled daily FVG serving as objective targets.
After filling this daily FVG imbalance, price is expected to continue delivering lower to address remaining inefficiencies on the sell-side, specifically around the 87,000 level, where another unfilled daily FVG is present.
BTC (MBT) on the way ot 86'000Price reacted very well at the white and red fork lines (see arrows).
We have left the white centerline, and now price is hovering around the red one. If we get an open and close below it, we’ll have a new target: the WL1 of the white fork, which unsurprisingly, lines up with the red L-MLH.
Rough times ahead...

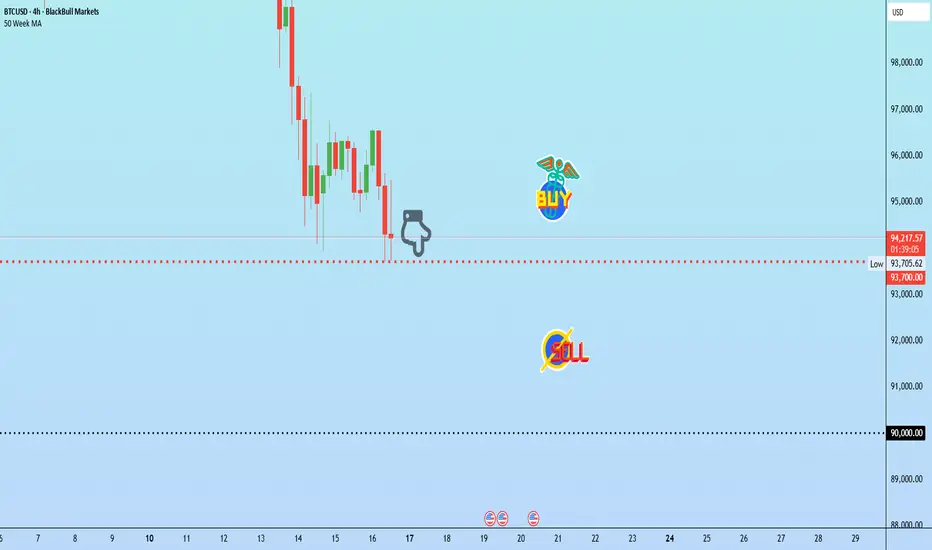
BTC needs to hold this level or risk a slide toward 90K?Bitcoin is at a crucial juncture. This week’s move could possibly prove vital for the cryptos forecast leading into Christmas.
Bitcoin has extended losses for a 4th session, now trading less than $95K. 93,700 dollars is possibly the most immediate support on the chart.
For any recovery to gain traction, price might need to reclaim 101,150 dollars and establish higher lows above it.
Perhaps the most important fundamental issue pressuring BTCUSD are the remarks from Fed officials questioning whether a December rate cut is warranted. Adding to the downside, Japan Exchange Group has apparently paused the listing of three crypto treasury firms while it reviews new compliance and disclosure rules. Japan remains the largest market in Asia for listed Bitcoin treasury firms, with fourteen companies currently holding BTC.
If Bitcoin's future isn't clear, zoom out.I used to have such a hard time with ICT's concepts until I simplified it and started zooming out... There are only two concepts to recognize:
Does price push past a high or a low WITH imbalance?
-If YES, trend will go into that direction AFTER the market makers get into position. What does that look like? Price will almost always revert to the Premium/Discount of the swing before continuing. It is in these technical areas that we look for signs of a reversal on a smaller timeframe (imbalance to the opposite side).
-If NO, this is what we call a MANIPULATION if price goes above a high/low and starts creating imbalances immediately to the reverse on a smaller timeframe.
Bitcoin on a 12 month chart really makes things EASY.
-2021 ATH broke with a strong imbalance to the upside.
-Exactly the same as it did in 2017, 2020 and now in 2024.
-In 2018 as well as 2022, price returned to BELOW discount and into OTA before a reversal.
If you want to see the future, look at the past...
-FVG will be confirmed at the end of the year. 2026 will likely herald in lower prices and seek DISCOUNT prices.
-Current discount is below $71,000.
-OTA is below $58,000. (61.8%)
-If previous historical swings foretell the future, price did not reverse until at least 78.6%
-This means a reversal could bring us all the way down to BELOW $40,000.
The fact that we will have a reversal is a foregone conclusion at this point. Next year is going to be extremely bearish for Bitcoin, but we are absolutely bulllish in the long run.

Bitcoin SHORT AnalysisBitcoin SHORT Analysis
Our sell zone aligns with the Point of Control (POC) and an unfilled H1 Order Block (OB) & SIBI, which serves as our Point of Interests (POI).
This zone was established following a displacement and the formation of a CISD (Change in State of Delivery), indicating a potential shift in market structure.
Currently, there is a significant draw on liquidity on the sell side, with the previous day’s low (PDL) forming equal lows, suggesting a liquidity pool beneath this level.
I anticipate that price may sweep this liquidity before initiating a substantial move towards the buy-side liquidity.
Given that there have been no major liquidity sweeps thus far, I expect price to respect the H1 Order Block.
Should the appropriate confirmation signals appear, I plan to enter a short position targeting the PDL as the primary objective. 🎯
