BITCOIN isn't diverging from 2022 at all!Bitcoin (BTCUSD) continues to replicate the 2022 Bear Cycle almost in the exact same fashion. This is of course a concept we introduced back in October for the first time and so far it has fulfilled all conditions set in its way.
The most recent is the 1D MA100 (green trend-line) rejection, which in 2022 happened on March 02 and after another Support test, BTC rebounded for the final rejection on the 1D MA200 (orange trend-line). As mentioned before, that could be around $100k.
Assuming the 2026 Bear Cycle continues to repeat the 2022 price action, the next Support level should be around $70k, then $51-52k and finally around $45000.
So do you think it will unfold like 2022? Feel free to let us know in the comments section below!
---
** Please LIKE 👍, FOLLOW ✅, SHARE 🙌 and COMMENT ✍ if you enjoy this idea! Also share your ideas and charts in the comments section below! This is best way to keep it relevant, support us, keep the content here free and allow the idea to reach as many people as possible. **
---
💸💸💸💸💸💸
👇 👇 👇 👇 👇 👇
Bitcoinsignals

BITCOIN is done if it closes below the 1M Bollinger Basis.Bitcoin (BTCUSD) is trading for the third straight month on the 1M Bollinger Bands Basis (black trend-line) and with only 5 days left to close the monthly candle, time is running out for a reversal.
That's because every time in the past 12 years that BTC closed a 1M candle below the BB Basis, it initiated Phase 2 of the Bear Cycle, and right now the price is sitting under it.
If it closes this way, Phase 2 should take it to at least the 1W MA200 (orange trend-line), which has always been hit historically during a Bear Cycle and is in fact where the January 2015 and December 2018 bottoms got priced. Based on the last Bear Cycle though, we should even test the 1W MA350 (yellow trend-line), which is where the November 2022 bottom was formed.
If that happens, the Bear Cycle should bottom around $50000, which falls exactly in the middle of the 0.382 - 0.5 Fibonacci retracement zone, again consistent with all previous Cycle bottoms. Notice that only when BTC reclaimed and closed above the 1W MA200 again (March 2023) was the new Bull Cycle confirmed.
So what do you think? Will a 1M candle closing below the Bollinger Basis be that bad for Bitcoin? Feel free to let us know in the comments section below!
---
** Please LIKE 👍, FOLLOW ✅, SHARE 🙌 and COMMENT ✍ if you enjoy this idea! Also share your ideas and charts in the comments section below! This is best way to keep it relevant, support us, keep the content here free and allow the idea to reach as many people as possible. **
---
💸💸💸💸💸💸
👇 👇 👇 👇 👇 👇

What will happen given the tensions?As you know, the accumulation of military equipment in the Middle East has strengthened speculation about a potential conflict with Iran, and this is impossible to ignore. This alone provides a strong justification for the rise in gold, silver, and other key metals. Additionally, the uncertainty surrounding Greenland and ongoing geopolitical tensions further contribute to this trend.
Now, moving to the technical analysis: since the price has broken down from the descending wedge pattern, it could decline toward $83,000 , or even lower, potentially reaching $79,000 . This bearish movement is likely to continue as long as geopolitical tensions persist.
Best regards CobraVanguard.💚
Give me some energy !!
✨We spend hours finding potential opportunities and writing useful ideas, we would be happy if you support us.
Best regards CobraVanguard.💚

Bitcoin Breaks Key Support – Bear Flag Signals Next DropYesterday, Bitcoin( BINANCE:BTCUSDT ) successfully broke through the support zone ($90,590-$89,320) and the 50_SMA(Daily) and support line.
From a classical technical analysis perspective, it seems that Bitcoin has formed a bearish flag pattern, suggesting a continuation of its downward trend.
From an Elliott Wave standpoint, it appears that Bitcoin has completed its wave 4 after a pullback to the support cluster, and we should now anticipate the next downward wave.
I expect that Bitcoin will begin to decline in the coming hours, potentially dropping at least to the Cumulative Long Liquidation Leverage($87,240-$86,190), and if the support zone ($86,420-$83,830) is broken, we can expect even more downward movement.
I’d love to hear your thoughts on Bitcoin. Do you think the downward trend will persist, and how far do you expect it to drop?
Stop Loss(SL): $90,743
CME gap: $93,060-$92,940
Cumulative Short Liquidation Leverage: $92,620-$91,040
💡 Please respect each other's opinions and express agreement or disagreement politely.
📌Bitcoin Analysis (BTCUSDT), 1-hour time frame.
🛑 Always set a Stop Loss(SL) for every position you open.
✅ This is just my idea; I’d love to see your thoughts too!
🔥 If you find it helpful, please BOOST this post and share it with your friends.

BITCOIN / GOLD ratio's mind-blowing revelation.Bitcoin (BTCUSD) remains under heavy pressure since its October 2025 All Time High (ATH) but the BTC/GOLD ratio reveals that the real selling pressure in terms of the precious yellow metal has been boiling up for some time before that date.
In fact the ratio's last High was in August 2025, which technically was a Lower High as the true Top for BTC/GOLD's Cycle was in December 2024. Mind-blowing revelation indeed and that undoubtedly draws similarities with the previous Cycle, which also had a Double Top in 2021.
The key indicator here is the 1M RSI of the ratio. It has a Lower Lows trend-line, which has priced all Cycle bottoms since 2015. More recently (since January 2019) there is a diverging Lower Lows trend-line (dashed) also. The tight zone within those two trend-lines may be holding the key for this Cycle's bottom.
This shows that the bottom may be closer than we may expect but the last Bear Cycle showed a slowing down behavior once it approached the RSI Lower Lows and turned sideways before it finally made contact with it 6 months later. For the real BTC/GOLD price action though, the downtrend didn't slow down as much, first breaking violently below the 1M MA50 (blue trend-line) and finding bottom 6 months later as mentioned just above the 1M MA100 (green trend-line).
If we have a decreasing rate on the MA bottoms, we can expect the current Cycle to bottom below the 1M MA100 this time, closer to the 1M MA150 (red trend-line).
So closer than it looks or not in terms of bottom, the Bear Cycle is entering its 2nd and final Phase.
So what do you think about the BTC/GOLD approach? Feel free to let us know in the comments section below!
---
** Please LIKE 👍, FOLLOW ✅, SHARE 🙌 and COMMENT ✍ if you enjoy this idea! Also share your ideas and charts in the comments section below! This is best way to keep it relevant, support us, keep the content here free and allow the idea to reach as many people as possible. **
---
💸💸💸💸💸💸
👇 👇 👇 👇 👇 👇

BITCOIN The ultimate RSI Fibonacci cheat-sheet you MUST know.Bitcoin (BTCUSD) continues to consolidate within its 1W MA50 (blue trend-line) and 1W MA100 (green trend-line), a zone whose importance we've covered on various previous analyses. This time we re-introduce a old concept, which was always an integral part of our long-term Cycle analyses, the 1W RSI Channel.
As you can see, the 1W RSI has bounced on its 0.786 Fibonacci level, a trend-line where it always hits and rebounds historically (blue circles) before completing Stage 1 of the Bear Cycle. In the previous two Bear Cycles, this has coincided with the 1W MA50-100 consolidation. After that, the RSI rebounded and tested the 0.618 Fib (orange circles), which again in the last two Cycles coincided with a 1W MA50 test, and got rejected (initiating Stage 2) towards the bottom of the Channel for the eventual Cycle bottom (green circles).
As a result, it is likely to see one last rally for that 1W MA50/ 0.618 Fib rejection (unless the 1W MA100 breaks/ closes first) before the eventual Cycle bottom on Fib 1.0 (Channel bottom). That is expected to be on the 1W MA350 (red trend-line) at least ($50000), which is where the previous Cycle bottomed in November 2022.
So do you think that's a useful RSI cheat-sheet? Feel free to let us know in the comments section below!
---
** Please LIKE 👍, FOLLOW ✅, SHARE 🙌 and COMMENT ✍ if you enjoy this idea! Also share your ideas and charts in the comments section below! This is best way to keep it relevant, support us, keep the content here free and allow the idea to reach as many people as possible. **
---
💸💸💸💸💸💸
👇 👇 👇 👇 👇 👇

BITCOIN 1W Ichimoku just turned red. Massive Bear Cycle signal.Bitcoin (BTCUSD) has turned its 1W Ichimoku Cloud red following an impressive run of more than 2 straight years of green. Historically, every time this development took place, the market was already on a Bear Cycle.
Technically this is the latest signal to confirm the 2026 Bear Cycle and the last times it took place, BTC bottomed at -68% (on all cases) from the following High rejection on the 1D MA200 (black trend-line). Based on the current position of the 1D MA200 a -68% decline would have the market test $35k.
Since however BTC bottomed on its 1W MA350 (red trend-line) during its last Bear Cycle, we should be expecting to hit it again. Based on its current trajectory, that should take place on $55000 at least. And given the fact that since 2018, every Bear Cycle bottom is a +150 MA lower on 1W (2018 bottom on 1W MA200, 2022 bottom on 1W MA350), we can assume that the 1W MA500 (grey trend-line) could get hit. That creates a potential fair bottom zone within $55000 - $40000, for use of optimistic - pessimistic scenarios.
So do you think the 1W Ichimoku Cloud turning red has confirmed the Bear Cycle? Feel free to let us know in the comments section below!
---
** Please LIKE 👍, FOLLOW ✅, SHARE 🙌 and COMMENT ✍ if you enjoy this idea! Also share your ideas and charts in the comments section below! This is best way to keep it relevant, support us, keep the content here free and allow the idea to reach as many people as possible. **
---
💸💸💸💸💸💸
👇 👇 👇 👇 👇 👇

BITCOIN Ultimate Rainbow Cycle AnalysisBitcoin (BTCUSD) is headed towards a 1D MA200 rejection, which as mentioned is what historically kickstarts Phase 2 of the Bear Cycle.
This excellent indicator that illustrates not only the Halving events but also the most optimal Sell and Buy levels based on the Fibonacci Time extension levels shows that the next point of interest is the 4.618 Fibonacci Time extension on the final week of September 2026, where the Cycle is expected to bottom.
With the next Halving estimated in April 2028, we will still be far from the start of the Profit Taking Zone (green vertical layers), which historically starts taking place around 38 weeks (266 days) after the Halving, but the 4.618 Time Fib its technically ideal for long-term buying again. Based on this model the price should be at least at $60000 by that time.
We also see that the price didn't even reach the orange Rainbow Wave on this Bull Cycle, confirming the Law of Diminishing Returns. But the timing of the Fibonacci Time extensions, as we first did more than 7 years ago, worked again to perfection. And this is why on this market (and as a matter of fact on most of them), it is more important to plan buying and selling based on time rather than absolute prices.
So are you expecting this Bear Cycle to have ended by October 2026 and will it reach at least $60000? Feel free to let us know in the comments section below!
---
** Please LIKE 👍, FOLLOW ✅, SHARE 🙌 and COMMENT ✍ if you enjoy this idea! Also share your ideas and charts in the comments section below! This is best way to keep it relevant, support us, keep the content here free and allow the idea to reach as many people as possible. **
---
💸💸💸💸💸💸
👇 👇 👇 👇 👇 👇

BITCOIN Fear & Greed index goes ‘greed’ first time since OctoberBitcoin (BTCUSD) Crypto Fear & Greed index turned to greed for the first time in 3 months. Technically this was confirmed by BTC breaking (and closing) above its 94650 Resistance for the first time in 2 months.
With the 1D MA50 (blue trend-line) turning into a Support and getting confirmed by holding upon the January 08 test, we can see the emergence of a short-term Channel Up.
As we've explained for over a month now, this is potentially the typical market reaction that previous Bear Cycles have done historically, where after completing the first strong decline that gets most of investors off guard, it makes the first counter-trend rally (dead cat bounce) that technically tests the 1D MA200 (orange trend-line). This time, the rebound is being made after the 1W MA100 (red trend-line) got tested and held.
With the 1D RSI about to enter the Overbought Zone (70.00 and above), where the last two times (October 06 and July 14 2025) it got rejected, we may see the current Bullish Leg of the Channel Up extending to around +17.50% (where the previous one was rejected), make a Higher High, then pull-back to re-test the 1D MA50 and then finally go for the benchmark test of the 1D MA200.
We estimate a potential Bear Cycle rejection Zone within $102000 - 105000, before the Cycle starts Phase 2 with a new long-term sell-off.
Do you think that's a realistic scenario to repeat the historic pattern? Feel free to let us know in the comments section below!
---
** Please LIKE 👍, FOLLOW ✅, SHARE 🙌 and COMMENT ✍ if you enjoy this idea! Also share your ideas and charts in the comments section below! This is best way to keep it relevant, support us, keep the content here free and allow the idea to reach as many people as possible. **
---
💸💸💸💸💸💸
👇 👇 👇 👇 👇 👇

BITCOIN: Huge Bear-Flag-Formation, Confirmation Incoming!Hello There,
welcome to my new analysis about Bitcoin from a more local timeframe perspective. Recently the price of Bitcoin has been forming a crucial formational structure that will be highly determining for the future outcome. Therefore, I spotted all the important levels and indications to consider in this pivotal determination. Also, this whole setup is corresponding to the bearish Wyckoff distribution I have spotted previously.
As it is seen in the chart, Bitcoin is trading within this massive descending channel formation. In this channel there is a strong resistance formed by the upper boundary of the channel. The fact that Bitcoin already bounced several times to the downside from there makes it a resistance zone, which should not be underestimated in any case. As Bitcoin is approaching this zone again, a pullback from there is highly likely.
There are also further indicators and formations that make the range between $100,000 and $105,000 a major resistance zone. The fact that there is also horizontal resistance from where Bitcoin bounced several times to the downside already in the past makes this an additional resistance. Also, the 100-EMA crossed already below the 50-EMA. This bearish crossover is, in most cases, a sure sign that the trend moves forward to the downside.
Considering all of these crucial levels and indications, we can watch now that Bitcoin is building this pivotal resistance cluster from where a pullback to the downside is highly likely. Several resistance factors come together within this resistance cluster: the upper resistance boundary of the descending channel, the horizontal resistance, and the EMA resistance. All of these levels confirm the bearishness of the cluster.
For the whole bear flag formation, this now means that the formation will be confirmed once the breakout below the lower boundary of the formation happens. As it is marked within my chart, this will provide the final bearish bear flag setup from where Bitcoin is going to continue to the downside. The main target zones of this formation are marked in my chart. Once they are reached, further considerations need to be made.
With this being said, it is great to consider the important trades upcoming.
We will watch out for the main market evolutions.
Thank you very much for watching!

Bitcoin Ranges as Middle East Tensions Raise Sell-Off RiskBitcoin( BINANCE:BTCUSDT ) has experienced both bullish and bearish moves over the past few days under the influence of various news events, resulting in a clear ranging structure.
One key factor that must be considered for Bitcoin and other risk assets is the escalation of tensions in the Middle East. This situation can act as a catalyst for sudden sell-offs across Bitcoin and the broader crypto market.
Currently, Bitcoin is trading near resistance lines, as well as the Cumulative Short Liquidation Leverage($93,150-$92,970), and has reacted precisely to the Potential Reversal Zone(PRZ) .
From an Elliott Wave perspective, Bitcoin appears to be completing a Double Three Correction (WXY) within this short-term range.
I expect Bitcoin to make another attempt toward the lower line of the ascending channel.
If this level breaks, we should be prepared for a deeper decline toward the Cumulative Long Liquidation Leverage zone($90,360-$89,360).
First Target: $90,773
Second Target: $89,903
Stop Loss(SL): $90,923
Points may shift as the market evolves
CME gap: $88,720-$88,120
What do you think about Bitcoin in the short term? I’d love to hear your thoughts!
Cumulative Long Liquidation Leverage: $87,125-$86,000
💡 Please respect each other's opinions and express agreement or disagreement politely.
📌Bitcoin Analysis (BTCUSDT), 1-hour time frame.
🛑 Always set a Stop Loss(SL) for every position you open.
✅ This is just my idea; I’d love to see your thoughts too!
🔥 If you find it helpful, please BOOST this post and share it with your friends.

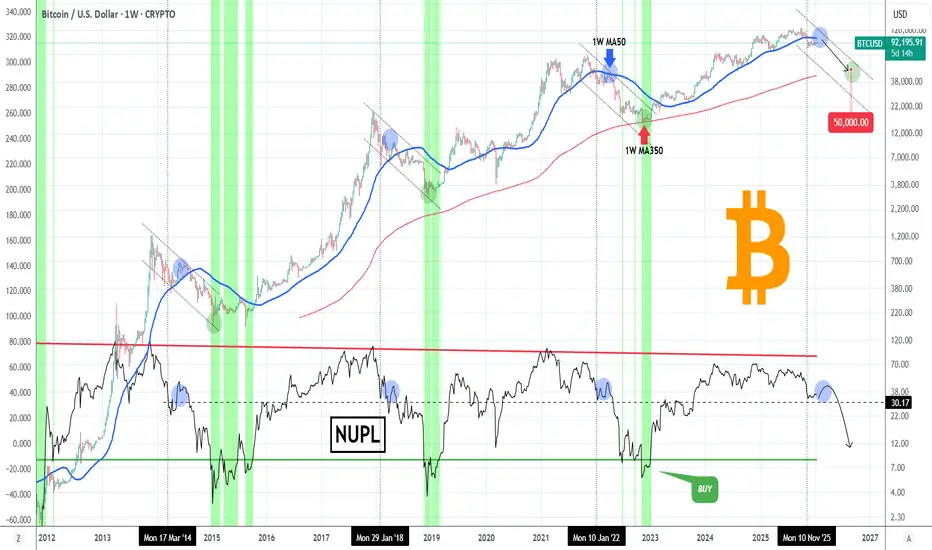
BITCOIN This is one of the best indicators for buying the bottomBitcoin (BTCUSD) continues to consolidate during these (almost) past 2 months as it is headed towards a 1W MA50 (blue trend-line) test, where it was rejected on the last Bear Cycle and started its Stage 2. This Stage is what typically leads to the Cycle bottom, which is essentially the most optimal level for a long-term investor to enter/ buy.
One of the best indicators to call out a Cycle bottom is the Net Unrealized Profit Loss (NUPL). As you can see (black trend-line), when this has historically hit its green line, BTC was on excellent buy opportunity levels (green vertical zones) as the Bear Cycle bottom was priced immediately after.
The last Cycle bottom also happened to be exactly on the 1W MA350 (red trend-line), which the March 2020 COVID flash crash also approached. As a result, it would be no surprise to see BTC hit that level on the next Cycle bottom as well, which according to its current trajectory, this test could be around $50000. But as mentioned, the strongest buy indication would be the NUPL touching its green trend-line regardless of BTC's price at the moment.
So what do you think? Will the NUPL be a indicator that you will look out for? Feel free to let us know in the comments section below!
---
** Please LIKE 👍, FOLLOW ✅, SHARE 🙌 and COMMENT ✍ if you enjoy this idea! Also share your ideas and charts in the comments section below! This is best way to keep it relevant, support us, keep the content here free and allow the idea to reach as many people as possible. **
---
💸💸💸💸💸💸
👇 👇 👇 👇 👇 👇
BITCOIN drops by more than -60% when this signal flashes.Bitcoin (BTCUSD) has closed the last 2M candle on a MACD Bearish Cross. Every time this has happened historically (2 times), Bitcoin has dropped by -67.66% and -68.75% from he top of that candle.
If history is repeated, a new -67.66% would deliver $36500 as the bottom of the current Bear Cycle. This time though, that would be below the MA50 (blue trend-line), so a range of 44500 - 36500 might be more appropriate.
In any case, this latest Bearish Cross comes as another confirmation of a 2026 Bear Cycle.
So are you expecting BTC to fall more than -60% from here? Feel free to let us know in the comments section below!
---
** Please LIKE 👍, FOLLOW ✅, SHARE 🙌 and COMMENT ✍ if you enjoy this idea! Also share your ideas and charts in the comments section below! This is best way to keep it relevant, support us, keep the content here free and allow the idea to reach as many people as possible. **
---
💸💸💸💸💸💸
👇 👇 👇 👇 👇 👇

BITCOIN Realized Price shows where the bottom might be.Bitcoin (BTCUSD) has always priced its bottom below its Realized Price (red trend-line) on every signal Bear Cycle it had.
In fact the bottom was considerably lower than the Realized Price. The last two Bear Cycles (2022 and 2018) have had fairly similar bottoms, dropping by -33.80% and -35.45% respectively from the moment the price broke below the Realized Price.
Based on where the Realized Price is now (which by the time BTC hits it, will be lower) a rounded up -30% decline would have us reach $39000. The Realized Price deviation band (orange cloud) however would be just under $45000 towards the end of the year (which is roughly when we expect the Bear Cycle to end)
As a result, a fair bottom zone could be $45000 - $39000.
Do you think that's a feasible level to expect? Feel free to let us know in the comments section below!
---
** Please LIKE 👍, FOLLOW ✅, SHARE 🙌 and COMMENT ✍ if you enjoy this idea! Also share your ideas and charts in the comments section below! This is best way to keep it relevant, support us, keep the content here free and allow the idea to reach as many people as possible. **
---
💸💸💸💸💸💸
👇 👇 👇 👇 👇 👇

BTC : This May Be Your Last Chance Before Exploding to Upside !!It can be said that if Bitcoin manages to break above 97k, it could easily reach 150k and begin new bullish waves.

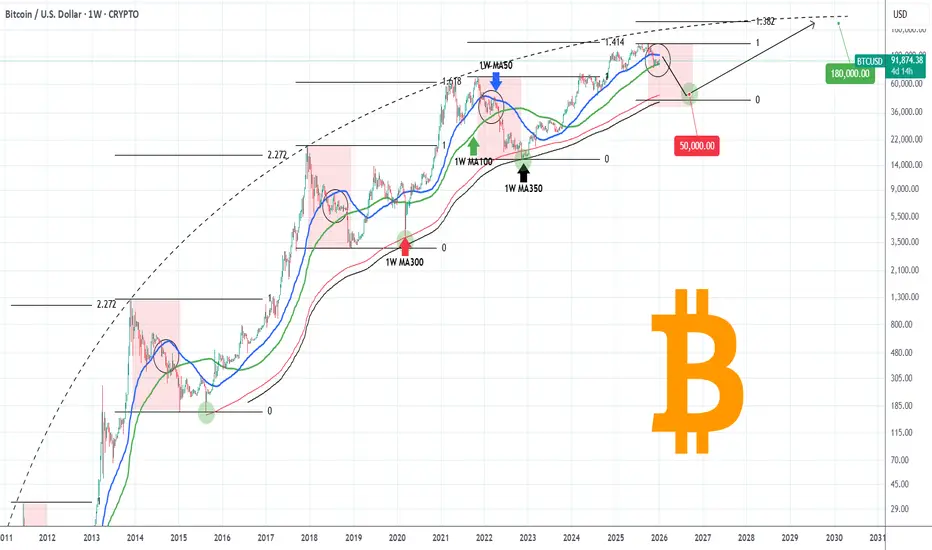
BITCOIN Can it reach $50000 during this Bear Cycle?Bitcoin (BTCUSD) has already started its new Bear Cycle since its October All Time High (ATH). We're past that, we've covered this extensively during the past 3 months. What's more important now is to cover the next stages, which is something we've started doing recently, in order to get a better understanding of the potential course of this Bear Cycle.
Right now BTC is consolidating within its 1W MA50 (blue trend-line) and 1W MA100 (green trend-line), which is a familiar pattern during all prior Bear Cycle, where after a 1W MA50 rejection, it starts Stage 2 of the Cycle.
The last Bear Cycle bottomed exactly on the 1W MA350 (black trend-line). The two before it, hit the 1W MA300 (red trend-line) before rebounding (and it was a secondary Low). As a result the 1W MA300-350 form a strong Support Zone and is the strongest candidate for the new bottom as well. Contact with the 1W MA350 (based on its current trajectory) should be made around $50000. A 45-50k potential Buy Zone would be more fair.
In any case, based on BTC's parabolic growth curve and the diminishing Fibonacci extension on each Bull Cycle Top, we expect the next ATH to be on its 1.382 Fib extension, i.e. around $180000.
Is that a trading plan you would follow if you were a long-term investor? Feel free to let us know in the comments section below!
---
** Please LIKE 👍, FOLLOW ✅, SHARE 🙌 and COMMENT ✍ if you enjoy this idea! Also share your ideas and charts in the comments section below! This is best way to keep it relevant, support us, keep the content here free and allow the idea to reach as many people as possible. **
---
💸💸💸💸💸💸
👇 👇 👇 👇 👇 👇
Bitcoin Pumps With Gold & S&P — But Is a Pullback Coming First?Bitcoin ( BINANCE:BTCUSDT ) started the new week with bullish momentum, pumping alongside Gold( OANDA:XAUUSD ) and the SPX500 Index( SP:SPX ).
At the moment, Bitcoin is trading within a resistance zone($94,840-$93,020), close to the upper line of the ascending channel, while also moving around the Cumulative Short Liquidation Leverage($94,970-$94,300).
From an Elliott Wave perspective, it appears that Bitcoin is in the process of completing microwave 4 of the main wave C.
My expectation is a minimum pullback toward the Cumulative Long Liquidation Leverage($92,190-$91,610) and the nearby support zone($90,960-$90,090). From that support zone($90,960-$90,090), we can look for a potential renewed bullish move.
Note: If geopolitical tensions in the Middle East escalate, a sudden and sharp drop in Bitcoin is possible.
Note: If Bitcoin breaks and holds below the support zone($90,960-$90,090), we should be prepared for a deeper downside continuation.
Cumulative Long Liquidation Leverage: $87,140-$86,210
Cumulative Short Liquidation Leverage: $98,480-$96,970
CME Gap: $91,595-$90,530
CME Gap: $88,720-$88,120
First Target: $90,029
Second Target: $90,867
Stop Loss(SL): $96,223(Worst)
Points may shift as the market evolves
💡 Please respect each other's opinions and express agreement or disagreement politely.
📌Bitcoin Analysis (BTCUSDT), 1-hour time frame.
🛑 Always set a Stop Loss(SL) for every position you open.
✅ This is just my idea; I’d love to see your thoughts too!
🔥 If you find it helpful, please BOOST this post and share it with your friends.

bitcoin is bullish now & many Traders don't see it !!!The price on the 4h timeframe is within an ascending triangle, which can be promising. If the price breaks this pattern with bullish candles, it could easily rise by the distance of AB=CD.

So, Maduro's capture is good for BITCOIN ??Bitcoin (BTCUSD) and especially the altcoin market, has been rising strongly every since Maduro's capture by the U.S., which is the most dominant macro geopolitical event since perhaps Trump's global tariffs a little less than a year ago.
So what does that mean, that such an act is good for the crypto market? Well not quite. Macro economic and geopolitical unrest events like this have acted as catalysts for major market movements that rarely are to the upside.
Some may argue that BTC is purely acting on its original inception role, a safe haven against times of uncertainty/ volatility. But what we see on these first trading days of 2026, is that the market is so far following the historical Bear Cycle print that all previous cycles followed.
What's that? It broke above its 1D MA50 (blue trend-line) for the first time in over 2 months, marking the first Low of the new Bear Cycle. What all previous Bear Cycles did when that break-out took place, was a short-term rebound (counter trend rally) that always hit the 1D MA200 (orange trend-line) and got rejected. In 2 times out of 3, it also tested the 0.5 Fibonacci retracement level from the recent Low.
After that 1D MA200 test was concluded, the bearish trend was resumed and the price bottomed towards the end of that year. In 2 out of 3 Cycles again, the bottom was at or below the 0.382 Fibonacci retracement level from the previous Cycle Low. Only the 2014 Cycle differed but that's to be expected as it was the first one and at the same time most aggressive. The current 0.382 Fib with a Target price of $56700, would be much less aggressive, which is natural due to the Theory of Diminishing Returns and Bitcoin's price stabilization as mass adoption kicks in more and more with each passing Cycle.
As a result, what we still think (presented this possibility over a month ago) the market will do now is rally towards 100k and then start Phase 2 of the Bear Cycle to bottom at least on $56700.
Do you agree that's a viable scenario? Feel free to let us know in the comments section below!
---
** Please LIKE 👍, FOLLOW ✅, SHARE 🙌 and COMMENT ✍ if you enjoy this idea! Also share your ideas and charts in the comments section below! This is best way to keep it relevant, support us, keep the content here free and allow the idea to reach as many people as possible. **
---
💸💸💸💸💸💸
👇 👇 👇 👇 👇 👇

Bitcoin Stuck in a Holiday Range — CME Gap Below?During the Christmas period, Bitcoin ( BINANCE:BTCUSDT ) didn’t exhibit strong momentum and has been moving within a range.
Bitcoin is currently near the resistance zone($90,960-$90,090) and the Cumulative Short Liquidation Leverage($91,840-$90,920).
From an Elliott Wave perspective, it appears that Bitcoin has completed the Double Three Correction(WXY).
I expect that given the weekend and generally lower trading volume at this time, Bitcoin may struggle to break the resistance zone($90,960-$90,090) and could begin to decline, potentially filling the CME Gap($88,720-$88,120). If BTC breaks the support lines, we can expect further declines to the support zone($87,050-$86,420).
Note: Additionally, two important trading levels to watch for Bitcoin are $90,300 and $87,830.
What are your thoughts? Do you think Bitcoin will continue its trend into 2026, or should we prepare for a correction? I’d love to hear your opinion!
Cumulative Long Liquidation Leverage: $87,110-$86,020
First Target: Support lines
Second Target: Support zone($87,050-$86,420)
Stop Loss(SL): $91,880
Points may shift as the market evolves
💡 Please respect each other's opinions and express agreement or disagreement politely.
📌Bitcoin Analysis (BTCUSDT), 1-hour time frame.
🛑 Always set a Stop Loss(SL) for every position you open.
✅ This is just my idea; I’d love to see your thoughts too!
🔥 If you find it helpful, please BOOST this post and share it with your friends.

BTC/USDT | BTC is finally free of shackles! (READ THE CAPTION)BTCUSDT has finally managed to break through the IFVG, going as high as 91,810. It has hit the low of the Bearish Breaker and has dropped in price, currently being traded at 91,360. I expect BTC to retest the bearish breaker, eventually breaking through it.
Current targets for BTCUSDT: 91,400, 91,800, 91,200, 92,600 and 93,000.

Happy New Year with BITCOIN making this for the first time!Happy New Year with our best wishes to you and your loved ones!
Bitcoin (BTCUSD) closed the year with a feat that it has historically never done before. And that's closing a year in red (losses) within a Bull Cycle.
So far, the traditional technical pattern was that after a Bear Cycle, BTC posted at least 3 straight green years. The last, post-Halving year was always green (gains).
That held up until yesterday with a red yearly (12-month) candle after two bullish ones in 2023 and 2024. Could that be the end of the traditional 4-year Cycle Theory? Well we don't believe that quite yet. As long as the market makes a new All Time High (or at least Cycle High in the decades that will follow market maturity and mass adoption) on year 4, then the 4-year Cycle Theory should remain the dominant pattern.
Nevertheless, that was a historic first for Bitcoin and we couldn't be more excited on what the future holds! Happy New Year again everybody!
So does the fact that 2025 closed in losses worry you? Feel free to let us know in the comments section below!
---
** Please LIKE 👍, FOLLOW ✅, SHARE 🙌 and COMMENT ✍ if you enjoy this idea! Also share your ideas and charts in the comments section below! This is best way to keep it relevant, support us, keep the content here free and allow the idea to reach as many people as possible. **
---
💸💸💸💸💸💸
👇 👇 👇 👇 👇 👇

BITCOIN It's really game over if it does that..Not much analysis is needed to address today's topic. Bitcoin (BTCUSD) will close tomorrow not only the year (2025) but also the month (December). This is a critical closing as the 1M (monthly) candle is currently red and if it closes this way (i.e. roughly below $90300), BTC will complete three straight red months.
Why this s important? Because during its 2023 - 2025 Bull Cycle, it never had three bearish 1M candles in a row and that could be a definitive confirmation that the new Bear Cycle is already underway.
In fact it would be almost a perfect match with the first 3 months of the previous Bear Cycle, which were also 3 straight red ones (November 2021 - January 2022), also supported by the 1W MA100 (red trend-line). A lifeline of encouragement would be however that, following those first 3 red candles of the previous Bear Cycle, the market found support on the 1W MA100 and rebounded the next two months (but of course only to drop more aggressively in the later stages).
It has to be noted also at this point that 3 straight red months has historically been a strong feature of Bear Cycle activity. In fact only twice Bitcoin displayed 3 straight red months during Bull Cycles: April - June 2021 and July - September 2019.
So if December closes in red tomorrow, would that be GAME OVER for BTC? Feel free to let us know in the comments section below!
---
** Please LIKE 👍, FOLLOW ✅, SHARE 🙌 and COMMENT ✍ if you enjoy this idea! Also share your ideas and charts in the comments section below! This is best way to keep it relevant, support us, keep the content here free and allow the idea to reach as many people as possible. **
---
💸💸💸💸💸💸
👇 👇 👇 👇 👇 👇
