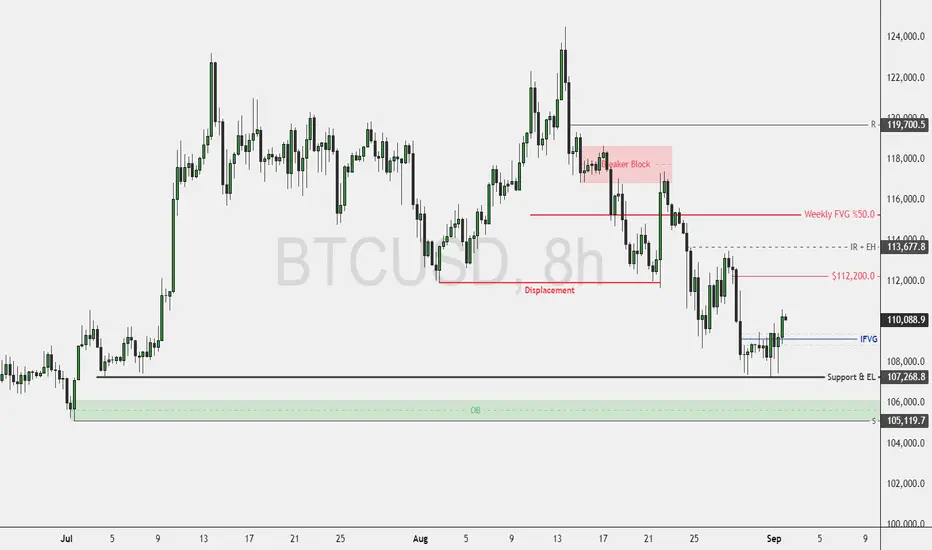
Bitcoin’s Temporary Rebound Targets Key HighsFenzoFx—Bitcoin remains bearish, though the downtrend paused after tapping equal lows at $107,268.0. BTC has since flipped above the recent fair value gap near $110,200.0.
We anticipate the downtrend will resume, targeting the bullish order block at $105,119.0. BTC/USD may rise toward $112,200.0, followed by equal highs at $113,677.0.
Once these levels are swept, the bearish trend is likely to continue. Traders and investors should monitor these key zones for potential bearish setups.
Bitcoinsignals
Bitcoin at Heavy Support – Will Bulls Defend or Break Below?Bitcoin ( BINANCE:BTCUSDT ) fell as I expected in my previous idea .
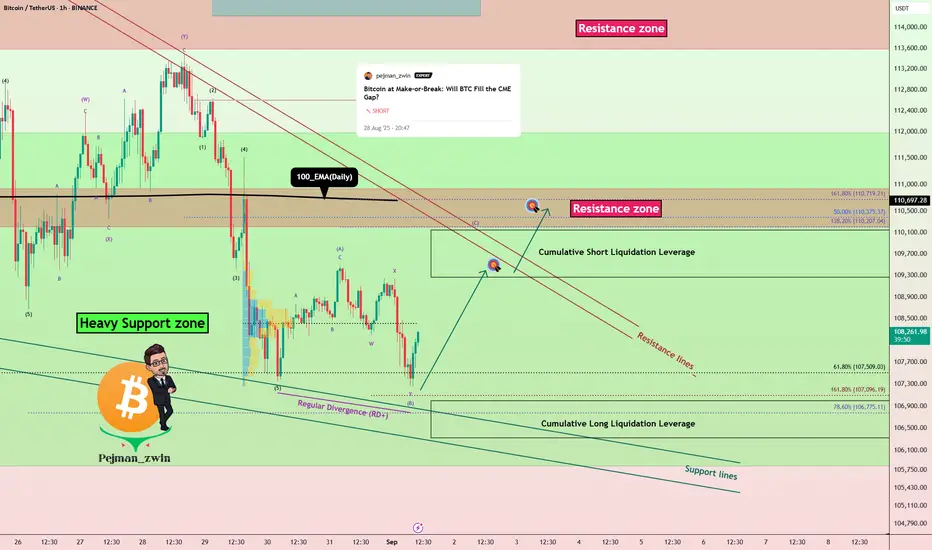
The question is, can Bitcoin break the Heavy Support zone($111,980-$105,820) ?
Bitcoin is currently trading in the lower areas of the Heavy Support zone($111,980-$105,820) and near the Support lines and Cumulative Long Liquidation Leverage($107,000-$106,330) .
In terms of Elliott Wave theory , it seems that Bitcoin has completed 5 downwaves at the support lines, and we should expect upward corrective waves . The corrective waves could follow the Expanding Flat(ABC/3-3-5) .
Also, we can see the Regular Divergence(RD+) between Consecutive Valleys.
I expect that if Bitcoin is going to break the Heavy Support zone($111,980-$105,820) , it will attack the Resistance zone($110,920-$110,200) and the Resistance lines first. Do you agree with me!?
Cumulative Short Liquidation Leverage: $110,147-$109,266
CME Gap: $117,235-$113,800
Stop Loss(SL): $105,600(Worst)
Please respect each other's ideas and express them politely if you agree or disagree.
Bitcoin Analyze (BTCUSDT), 1-hour time frame.
Be sure to follow the updated ideas.
Do not forget to put a Stop loss for your positions (For every position you want to open).
Please follow your strategy and updates; this is just my Idea, and I will gladly see your ideas in this post.
Please do not forget the ✅' like '✅ button 🙏😊 & Share it with your friends; thanks, and Trade safe.
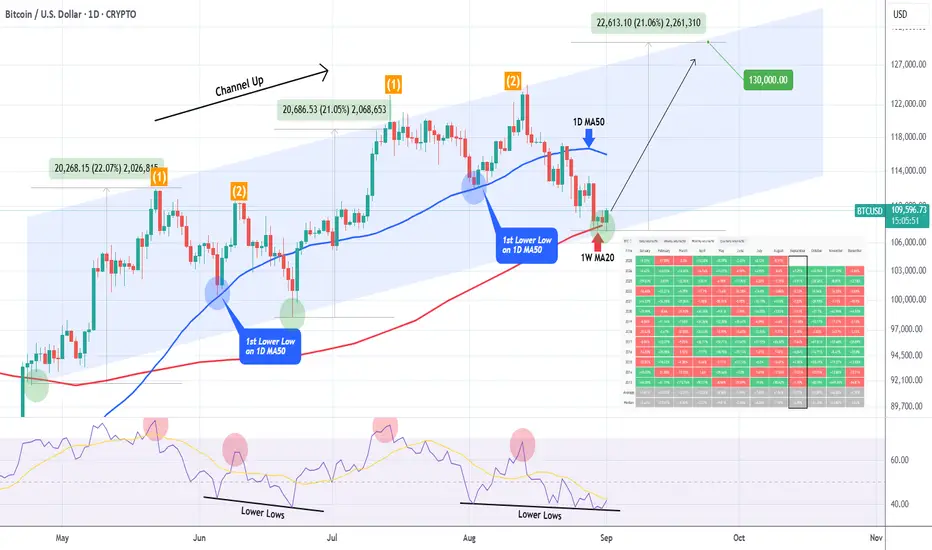
BITCOIN ahead of September crash on historically worst month??Despite the obvious hint of 2 potential rate hikes by the end of this year, Bitcoin (BTCUSD) has found itself on a downtrend. And as today we entered the first day of September, this sentiment is further empowered by one simple statistical fact: that September has historically been BTC's worst performing month.
As this table on the chart shows (source: CoinGlass), September's average returns have been -3.77%, the worst average score out of all months since 2013. An interesting fact however is that out of all the Septembers that ended in green (4), they did so when there was a red August (like the one we just closed at -5.91%). At the same time out of all the times August was red (8) four times September followed in red. This shows that historical probabilities are equally distributed there.
Statistics aside, the market has a strong case of a bottom on the current levels and that's purely a technical one. As you can see, since May 01, Bitcoin has been trading within a Channel Up. This pattern has seen so far two Bullish Legs of almost identical rise (+22.07% and +21.05% respectively) and when they corrected (Bearish Legs), the first Low was on the 1D MA50 (blue trend-line) and the second on the Channel Up bottom.
This time there is an even stronger technical case, as the price hit the 1W MA20 (red trend-line), which as we've shown on a recent study, is a Support level that historically kickstarts the final rallies during Bull Cycles.
Even their 1D RSI sequences are similar, with the indicator currently being on a Lower Lows formation that previously marked the June 22 (Higher) Low.
As a result, assuming we will see the 'minimum' of +21.07% Bullish Leg, we should be expecting a $130000 Higher High, which matches our realistic Cycle Top study, based on most studies we've conducted.
So do you think Bitcoin will again declined this September or we are currently forming a new bottom? Feel free to let us know in the comments section below!
-------------------------------------------------------------------------------
** Please LIKE 👍, FOLLOW ✅, SHARE 🙌 and COMMENT ✍ if you enjoy this idea! Also share your ideas and charts in the comments section below! This is best way to keep it relevant, support us, keep the content here free and allow the idea to reach as many people as possible. **
-------------------------------------------------------------------------------
💸💸💸💸💸💸
👇 👇 👇 👇 👇 👇
BITCOIN Bearish Breakout!
HI,Traders !
#BITCOIN made an epic
Bearish breakout of a very
Strong key horizontal level
Of 112340.5which is now a
Resistance and the breakout
Is confirmed so we are
Bearish biased and we will
Be expecting a further
Bearish move down !
Comment and subscribe to help us grow !

BITCOIN The NIGHTMARE BEAR CYCLE fractal that Bulls must avoid!Bitcoin (BTCUSD) has been on a strong correction lately after the August 14 All Time High (ATH) at $124500. Every High since has been sold and the price has found itself below the 1D MA50 (blue trend-line).
Whether that's alarming or not yet, this sequence draws a lot of comparisons with the pattern that led to the Cycle Top on 2021.
As you can see both patterns started off with Lower Highs that pushed the market to a new bottom on Lower Lows. A 1D Death Cross confirmed the bottom formation (along with a 1D RSI bullish divergence on Higher Lows) and BTC started rising aggressively again, flipping both the 1D MA50 and 1D MA200 (orange trend-line) into Supports and forming a Bull Flag on a 1D Golden Cross.
At the end of this sequence in 2021, a Double Top Higher Highs pattern, was what formed the Cycle's Top. Unfortunately for the Bulls' case, this is very similar to the Higher High formation we got on August 14. Even the 1D RSI patterns among those two fractals are similar.
Do you think we are in a similar situation as in late November 2021, which initiated the 2022 Bear Cycle?
Feel free to let us know in the comments section below!
-------------------------------------------------------------------------------
** Please LIKE 👍, FOLLOW ✅, SHARE 🙌 and COMMENT ✍ if you enjoy this idea! Also share your ideas and charts in the comments section below! This is best way to keep it relevant, support us, keep the content here free and allow the idea to reach as many people as possible. **
-------------------------------------------------------------------------------
💸💸💸💸💸💸
👇 👇 👇 👇 👇 👇

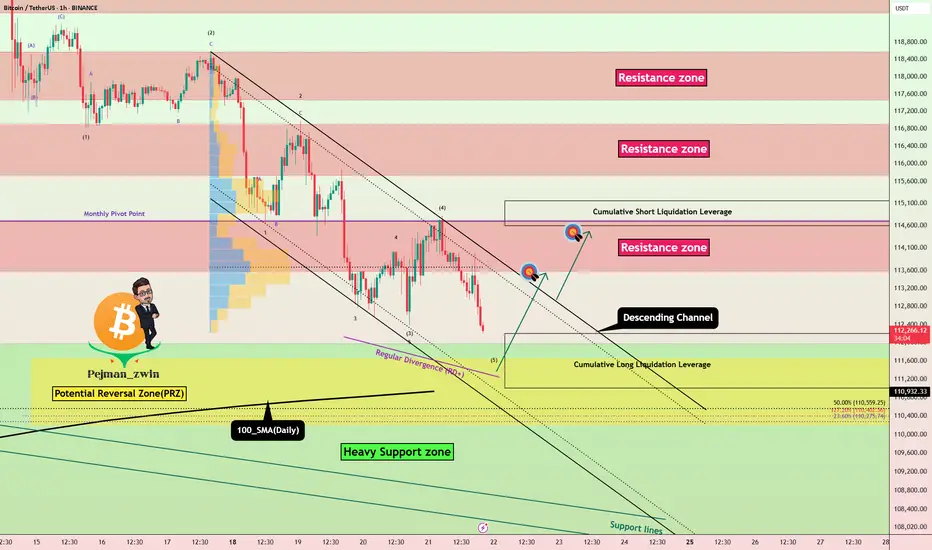
Bitcoin at Heavy Support Zone –Will Bulls Defend $110K or Break?Bitcoin ( BINANCE:BTCUSDT ) rose to $114,400 and even higher, as I expected in my previous idea . Of course, Powell's words also played a significant role in this increase.
Bitcoin has started to decline after the rebound and is currently trading at a Heavy Support zone($111,980-$105,820) near the Potential Reversal Zone(PRZ) , Cumulative Long Liquidation Leverage($110,157-$109,000) , 100_EMA(Daily) , and Support lines .
The question is whether Bitcoin will manage to break the Heavy Support zone($111,980-$105,820) or will it start to rise again. What do you think?
In terms of Elliott Wave theory , Bitcoin appears to be completing microwave 5 of the downtrend waves the past two days . Microwave 5 could be completed at Potential Reversal Zone(PRZ) and Cumulative Long Liquidation Leverage($110,157-$109,000) .
Also, we can see the Regular Divergence(RD+) between Consecutive Valleys.
I expect Bitcoin to rise to at least $113,500 after entering the Potential Reversal Zone(PRZ) or hitting the Support lines . Market conditions may get a little emotional with the US market opening , so please observe money management.
Second Target: $114,517
Cumulative Long Liquidation Leverage: $108,000-$106,747 =Important
Cumulative Short Liquidation Leverage: $114,246-$113,326
Cumulative Short Liquidation Leverage: $117,939-$115,500
CME Gap: $117,235-$113,800
Stop Loss(SL): $108,670 /If your long position trigger was near the lower lines of the descending channel, it could be =Stop Loss(SL)=$106,417
Please respect each other's ideas and express them politely if you agree or disagree.
Bitcoin Analyze (BTCUSDT), 1-hour time frame.
Be sure to follow the updated ideas.
Do not forget to put a Stop loss for your positions (For every position you want to open).
Please follow your strategy and updates; this is just my Idea, and I will gladly see your ideas in this post.
Please do not forget the ✅' like '✅ button 🙏😊 & Share it with your friends; thanks, and Trade safe.

BITCOIN The key importance of the 1W MA20 that was just tested!Bitcoin (BTCUSD) almost hit early this week its 1W MA20 (blue trend-line) and so far it appears to be holding it. Whether that leads into a sustainable rebound or not it remains to be seen but this is historically a critical level for the market.
More specifically, as you can see on the charts above, the 1W MA50 has initiated every Cycle's final rally since 2013! To make this special occurrence even more interesting, every such consolidation/ pull-back before the final rally, took place within the August - September period (2021, 2017, 2013).
So if it holds once again, we see no reason why it shouldn't start again the Cycle's last rebound. And since the first two Cycles are more similar with each other, we might assume that the current would be more similar with 2017. Since that one topped very close to the 2.0 Fibonacci extension from the low of the final pull-back, we could get a peak this time around $140k.
Do you think history will repeat itself again and hit at least $140000? Feel free to let us know in the comments section below!
-------------------------------------------------------------------------------
** Please LIKE 👍, FOLLOW ✅, SHARE 🙌 and COMMENT ✍ if you enjoy this idea! Also share your ideas and charts in the comments section below! This is best way to keep it relevant, support us, keep the content here free and allow the idea to reach as many people as possible. **
-------------------------------------------------------------------------------
💸💸💸💸💸💸
👇 👇 👇 👇 👇 👇

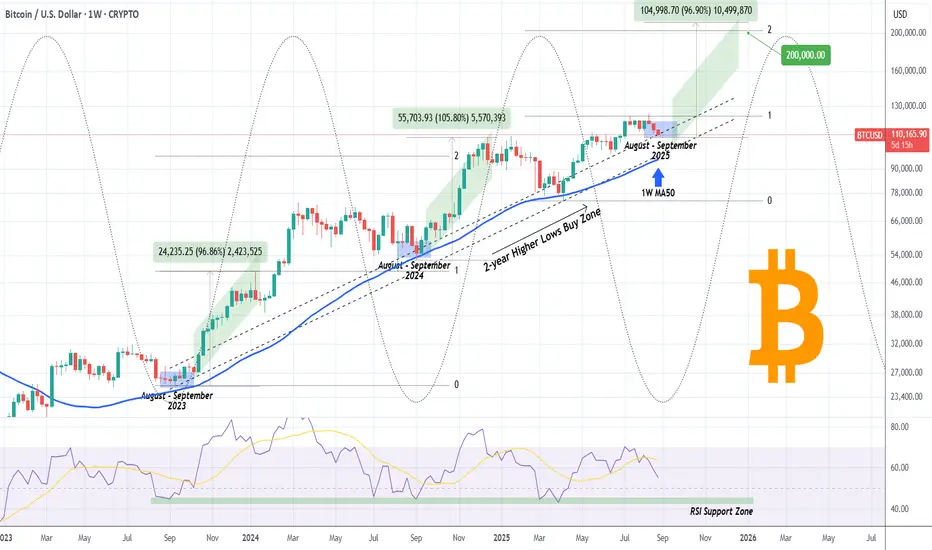
BITCOIN The August-September bottom cheat sheet!Bitcoin (BTCUSD) has just entered its 2-year Buy Zone, which is a Higher Lows belt that has priced its last 3 major bottoms and since the November 2022 Bear market bottom, has been the most optimal long-term buy entry.
A very interesting fact is that the August - September period since 2023 has been such a bottom formation, with the 1W RSI Support Zone, providing an additional confirmation for a long-term buy entry, also present during the March - April 2025 Tariff led correction.
As a result, it is highly likely to start seeing the new Bullish Leg starting by the first 1-2 weeks of September, with the previous two rising by +96.86 and +105.80% respectively. That suggests that BTC could marginally surpass $200k before the Cycle peaks. That would also be just below the 2.0 Fibonacci extension from Aprils Low, similar to the December 2024 High.
So do you think $200000 is possible for this Cycle? Feel free to let us know in the comments section below!
-------------------------------------------------------------------------------
** Please LIKE 👍, FOLLOW ✅, SHARE 🙌 and COMMENT ✍ if you enjoy this idea! Also share your ideas and charts in the comments section below! This is best way to keep it relevant, support us, keep the content here free and allow the idea to reach as many people as possible. **
-------------------------------------------------------------------------------
💸💸💸💸💸💸
👇 👇 👇 👇 👇 👇
Distribution Pattern Signals Crash Into CME Gap at 92kIt is always the same playbook at this point and it is getting boring to watch. The same double top distribution pattern repeats again and again. This is the game they play, wiping out both shorts and longs before the real rally begins.
The last time we saw this setup Bitcoin pulled back 32 percent into the CME gap at 77k. The next gap sits at 92k and you can bet they will dump it down there too. In reality it is not even that big of a move, just 26 percent, perfectly in line with previous pullbacks.
The real story is the fear it will create. This lines up with September, historically Bitcoin’s worst performing month and a time when blood usually runs in the streets.
DO NOT FALL FOR THIS BEAR TRAP AND SHAKE OUT
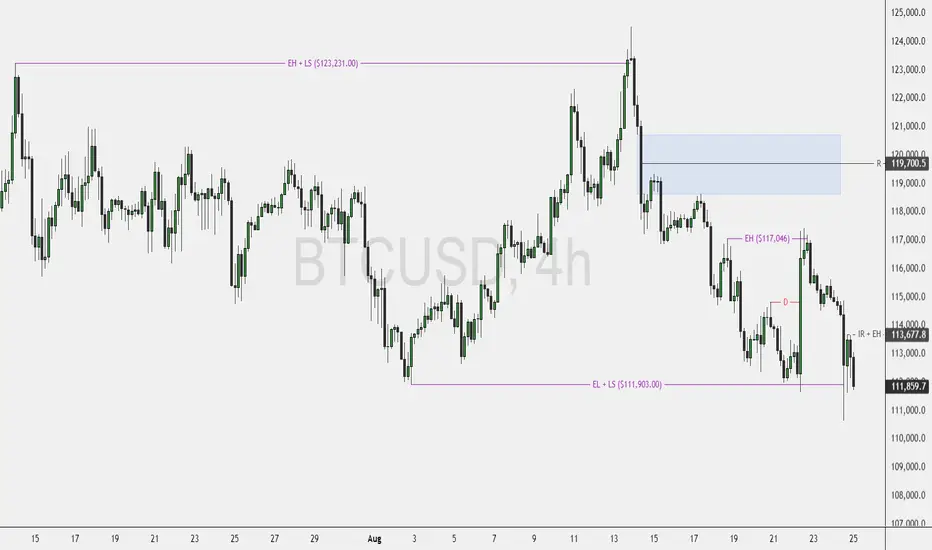
Bitcoin Holds Bullish StructureFenzoFx—Bitcoin formed equal highs after sweeping liquidity above $117,046.00 on Friday. Technically, Bitcoin remains bullish due to Friday’s price displacement.
Immediate resistance lies at $113,677.00. If bulls close and stabilize above this level, the uptrend may resume, targeting the equal highs at $117,046.00. A further rise could fill half of the bearish fair value gap toward $119,700.00.
Currently, no bearish setup is expected unless BTC reaches the premium price zone of $119,700.00 and above.
Bitcoin Long Setup: PRZ + Heavy Supports in Action!Bitcoin ( BINANCE:BTCUSDT ), as I expected in the previous idea , fell to at least $112,640 and is completing the second target (Full Target) .
Bitcoin is approaching the Heavy Support zone($111,980-$105,820) and 100_SMA(Daily) , Potential Reversal Zone(PRZ) , and Cumulative Long Liquidation Leverage($112,200-$111,000) , generally , heavy supports and resistances are NOT broken with the first attack , so I am publishing this analysis with the label ''LONG'' .
In terms of Elliott Wave theory , Bitcoin is completing a main wave 5 , as the main wave 3 was an extended wave .
Also, we can see the Regular Divergence(RD+) between Consecutive Valleys .
I expect Bitcoin to start rising from the Potential Reversal Zone(PRZ) and Cumulative Long Liquidation Leverage($112,200-$111,000) and increase to at least $113,617 .
Second Target: $114,391
Cumulative Short Liquidation Leverage: $115,157-$114,599
Note: Stop Loss(SL): $110,100
Please respect each other's ideas and express them politely if you agree or disagree.
Bitcoin Analyze (BTCUSDT), 1-hour time frame.
Be sure to follow the updated ideas.
Do not forget to put a Stop loss for your positions (For every position you want to open).
Please follow your strategy and updates; this is just my Idea, and I will gladly see your ideas in this post.
Please do not forget the ✅' like '✅ button 🙏😊 & Share it with your friends; thanks, and Trade safe.
BITCOIN Are the 0.5 Fib and 1D MA100 coming to the rescue?Bitcoin (BTCUSD) has been trading within a Channel Up pattern for exactly the past 4 months (since April 22) and the recent correction off its All Time High (ATH) has broken below the 1D MA50 (blue trend-line) for the first time since July 02 and is about to test the 1D MA100 (green trend-line).
The 1D MA100 has been intact since the day the Channel Up started so it is on its own a strong Support. It gets stronger though, considering that this is where the 0.5 Fibonacci retracement level is from its ATH, which is exactly where BTC rebounded (and priced the previous Higher Low) on June 22.
As you can see, there is a very high degree of symmetry among the Bullish and Bearish Legs of the Channel Up and the 0.5 Fib is -11.09% from the recent High, which is again the % correction of BTC's last Bearish Leg.
Notice also the similarities between the Bearish Legs' fractals, being on Lower Highs and Lower Lows. A new Lower Low now, would potentially signal the bottom.
As far as the next Bullish Leg is concerned, based on the previous one, we can expect a rise to the 1.5 Fibonacci extension, which is at $140000.
Do you think history will be repeated once more? Feel free to let us know in the comments section below!
-------------------------------------------------------------------------------
** Please LIKE 👍, FOLLOW ✅, SHARE 🙌 and COMMENT ✍ if you enjoy this idea! Also share your ideas and charts in the comments section below! This is best way to keep it relevant, support us, keep the content here free and allow the idea to reach as many people as possible. **
-------------------------------------------------------------------------------
💸💸💸💸💸💸
👇 👇 👇 👇 👇 👇

Bitcoin Maintains Bearish MomentumFenzoFx—Bitcoin stayed bearish, trading around $113,500.0 in today’s session. During the Asian hours, it swept liquidity above the previous day’s high and quickly dipped below $114,627.00.
The next buy-side liquidity zone lies at $111,903.00. The bearish outlook remains intact unless this level is swept.

BTC Trendline Broken: 110k Support Is the Last Stand1. Recent Context
In my previous BTC analysis, I wrote that as long as the ascending trendline held, bulls had nothing to fear. But on Monday, that line was broken to the downside. After a few hesitations, I decided to close my long positions around 116k.
________________________________________
2. The Key Question
Can bulls defend 110–111k, or are we heading for a deeper correction?
________________________________________
3. Why the Chart Looks Weak Short-Term
• The trendline break changes the bullish structure.
• Bulls must defend 110–111k; if this zone cracks, the damage could be significant.
• To regain momentum, BTC must break back above 120k. Without that, upside looks limited.
________________________________________
4. Trading Plan
At this point, I’m out of the market.
• I won’t buy into 111k support even if a rebound is probable.
• Instead, I’ll treat that rebound as a chance to sell short at better prices.
• 120k zone is the ideal level for a short setup, both technically and from a risk/reward perspective.

BITCOIN 2020 fractal gives huge buy signal now.Bitcoin (BTCUSD) broke below its 1D MA50 (blue trend-line) emphatically for the first time in 2 months, sounding short-term fear alarms ahead of the key macroeconomic news of this week. The 1D RSI hit 40.00 however, which has been an automatic buy on both major recent lows (August 01 and June 21).
Short-term aside, it is a fractal from BTC's last Cycle in 2020 (chart on the right) that perhaps offers the most comprehensive long-term outlook, which is what has always helped us maintain an objective, stress-free perspective.
As you can see, both today and 2020 fractals display not only similar price actions but also RSI sequences. Even though naturally the 2020 rebound on the Pivot trend-line has been way more aggressive as the market was still recovering and adjusting the price from the COVID crash, today's price action display's similar phases but in a more sustainable rise.
Based on the RSI fractals, we could be in similar phase as early December 2020. This suggests that there is still upside potential that may extend to as high as 150 - 170k before this Cycle is over.
Do you think that this is a solid Profit Zone for the Cycle? Feel free to let us know in the comments section below!
-------------------------------------------------------------------------------
** Please LIKE 👍, FOLLOW ✅, SHARE 🙌 and COMMENT ✍ if you enjoy this idea! Also share your ideas and charts in the comments section below! This is best way to keep it relevant, support us, keep the content here free and allow the idea to reach as many people as possible. **
-------------------------------------------------------------------------------
💸💸💸💸💸💸
👇 👇 👇 👇 👇 👇

Bitcoin on the Edge! Will $114K Hold or Break?Bitcoin ( BINANCE:BTCUSDT ) started to decline from the Potential Reversal Zone(PRZ) as I expected in the previous idea .
Bitcoin currently appears to have managed to break the Support zone($116,900-$115,730) and is currently trading near the Support zone($114,720-$113,570) , 50_EMA(Daily) , Monthly Pivot Point , and Cumulative Long Liquidation Leverage($114,300-$113,841) .
In terms of Elliott Wave theory , it appears that Bitcoin is completing microwave 4 of the main wave 3 (probably), and we should expect a re-attack on the Support zone($114,720-$113,570) in the coming hours .
I expect Bitcoin to attack the Support zone($114,720-$113,570) at least once more after completing the pullback to the Support zone($116,900-$115,730) from Cumulative Short Liquidation Leverage($116,411-$115,760) and if it breaks , we should expect a drop to the Heavy Support zone($111,980-$105,820) .
Cumulative Short Liquidation Leverage: $120,115-$118,751
Note: Stop Loss(SL): $117,320
Please respect each other's ideas and express them politely if you agree or disagree.
Bitcoin Analyze (BTCUSDT), 1-hour time frame.
Be sure to follow the updated ideas.
Do not forget to put a Stop loss for your positions (For every position you want to open).
Please follow your strategy and updates; this is just my Idea, and I will gladly see your ideas in this post.
Please do not forget the ✅' like '✅ button 🙏😊 & Share it with your friends; thanks, and Trade safe.

BITCOIN Below its 1D MA50. Is there any Support?Bitcoin (BTCUSD) broke today below its 1D MA50 (blue trend-line) for the first time since July 02, having previously rebounded on it (August 02) on a perfect technical bounce that delivered a new All Time High (ATH).
Naturally, the 1D MA50 is the first medium-term line of Support and last time it broke convincingly, the price found a bottom (June 22) closer to the 1D MA100 (green trend-line). That was during BTC's previous Accumulation Phase of the 4-month Channel Up.
If that pattern is repeated, then Bitcoin's next Support could be within 112000 - 111000. On top of that, it would be useful to keep an eye on the 1D RSI, which is printing a pattern similar to he previous Accumulation Phase that bottomed on the 39.00 level.
As far as the next High is concerned, if it repeats the +22.72% rise that the previous Bullish Legs delivered from the 1D MA50 contact, then we're potentially looking at $137000 as the pattern's next Higher High.
So what's your view? Do you think the 1D MA100 will come to BTC's rescue and push it to $137k? Feel free to let us know in the comments section below!
-------------------------------------------------------------------------------
** Please LIKE 👍, FOLLOW ✅, SHARE 🙌 and COMMENT ✍ if you enjoy this idea! Also share your ideas and charts in the comments section below! This is best way to keep it relevant, support us, keep the content here free and allow the idea to reach as many people as possible. **
-------------------------------------------------------------------------------
💸💸💸💸💸💸
👇 👇 👇 👇 👇 👇

Bitcoin Tests Key Support at $115KFenzoFx—Bitcoin's downtrend extended to $115,000, filling the bullish fair value gap now acting as support. The current price equals 25.0% of the previous bullish leg. If BTC closes and stabilizes below $115,000.0, the downtrend may deepen toward the $112,000.0 support order block.
Conversely, a close above $117,445.0 would invalidate the bearish outlook. This level marks the last bearish candlestick pattern and a break of structure. If confirmed, BTC/USD could recover recent losses, targeting resistance at $119,339.0.

bitcoin - Time to buy again!The price seems to have completed the fourth corrective wave, and from now on, it's time for a price increase, which will continue up to around $150k .
previous analysis

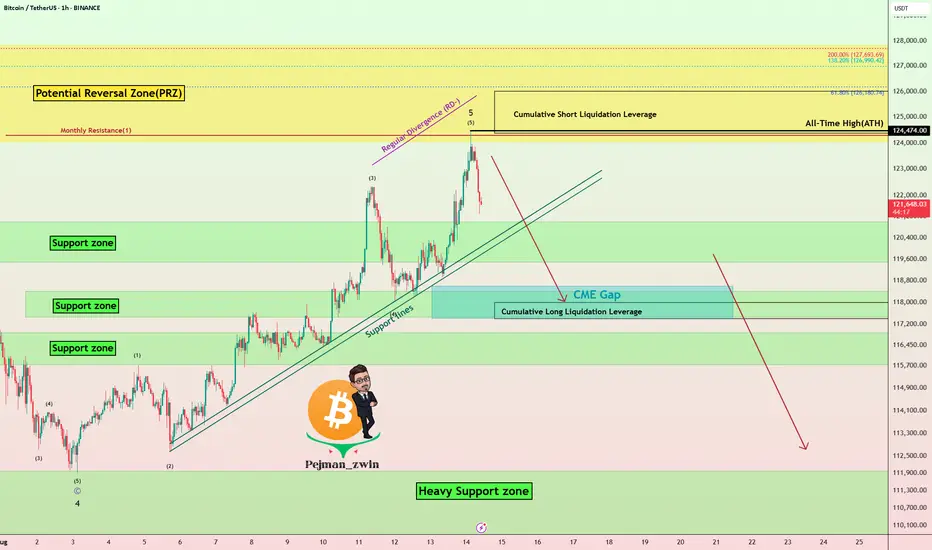
Bitcoin Hits New ATH – Is This the Final Pump Before a Crash?Bitcoin ( BINANCE:BTCUSDT ) reacted well to the Potential Reversal Zone(PRZ) that I told you about in the previous idea and started to decline, but Bitcoin managed to create a new All-Time High(ATH=$124,474) in this rally.
Do you think Bitcoin can create a new All-Time High(ATH) again in the coming hours or should we wait for a main correction?
In terms of Elliott Wave theory , Bitcoin appears to have completed the main wave 5 in the Potential Reversal Zone(PRZ) , and we should expect corrective waves .
Also, we can see the Regular Divergence(RD-) between Consecutive Peaks .
Looking at the USDT.D% ( CRYPTOCAP:USDT.D ) chart, it also seems that with the breaking of the upper line of the descending channel, we can expect an increase in USDT.D% , which could cause a decrease in the price of Bitcoin .
I expect Bitcoin to at least move towards filling the CME Gap($118,600-$117,425) AFTER breaking the Support lines .
Cumulative Short Liquidation Leverage: $126,000-$124,367
Cumulative Long Liquidation Leverage: $118,000-$117,400
Note: Stop Loss(SL): $126,123
Please respect each other's ideas and express them politely if you agree or disagree.
Bitcoin Analyze (BTCUSDT), 1-hour time frame.
Be sure to follow the updated ideas.
Do not forget to put a Stop loss for your positions (For every position you want to open).
Please follow your strategy and updates; this is just my Idea, and I will gladly see your ideas in this post.
Please do not forget the ✅' like '✅ button 🙏😊 & Share it with your friends; thanks, and Trade safe.
BITCOIN The vast importance of the Pivots. Is $180k possible?Bitcoin (BTCUSD) is most likely starting the new Bullish Leg of this Cycle, as stated on our recent analysis following the 1D MA50 (red trend-line) rebound.
Today we point out the critical role of Pivot trend-lines, which throughout the entirety of the current Bull Cycle, have provided a Support level and initiated massive rebounds.
Those Bullish Legs not only tend to be similar in strength (+60% to +92%) but the time between their starts is roughly the same (39 to 46 weeks).
Given also the fact that the 1W RSI has printed the same kind of consolidation it always forms when such a Bullish Leg started, we do expect a strong rally next, which if the +60% minimum rise holds, may very well be as close as $180000.
So do you think BTC can reach $180k before this Cycle is over or it's too high? Feel free to let us know in the comments section below!
-------------------------------------------------------------------------------
** Please LIKE 👍, FOLLOW ✅, SHARE 🙌 and COMMENT ✍ if you enjoy this idea! Also share your ideas and charts in the comments section below! This is best way to keep it relevant, support us, keep the content here free and allow the idea to reach as many people as possible. **
-------------------------------------------------------------------------------
💸💸💸💸💸💸
👇 👇 👇 👇 👇 👇

Bitcoin Near $125K Resistance — Is the Rally Over?Bitcoin ( BINANCE:BTCUSDT ) increased to $120,000 after breaking resistances , as I expected in my previous idea .
Bitcoin has already managed to break the Resistance zone($121,000-$119,000) and is moving near the Potential Reversal Zone(PRZ) .
According to Elliott Wave theory , Bitcoin is completing the 5th major impulse wave . In my opinion, this is the last bullish wave of Bitcoin, and after that we should wait for the main correction of Bitcoin . Do you agree with me that it is time to run and take profit!?
To get a better view of the main waves , I suggest you look at the idea below .
Also, since Bitcoin is correlated with the S&P500 Index ( SP:SPX ) and since I also foresee the possibility of a correction in the S&P500 Index, it is also possible to expect a decrease in the price of Bitcoin based on the S&P500 Index analysis .
I expect Bitcoin to start declining after entering the Cumulative Short Liquidation Leverage($125,000-$122,580) and Potential Reversal Zone(PRZ) and at least fill the CME Gap($119,100-$117,425) .
Note: There are heavy sell orders around $125,000.
Cumulative Long Liquidation Leverage: $120,866-$119,442
Cumulative Long Liquidation Leverage: $117,743-$115,452
What is your opinion on Bitcoin and its trend? Can it see $130,000, or will a main correction begin?
Please respect each other's ideas and express them politely if you agree or disagree.
Bitcoin Analyze (BTCUSDT), 2-hour time frame.
Be sure to follow the updated ideas.
Do not forget to put a Stop loss for your positions (For every position you want to open).
Please follow your strategy and updates; this is just my Idea, and I will gladly see your ideas in this post.
Please do not forget the ✅' like '✅ button 🙏😊 & Share it with your friends; thanks, and Trade safe.

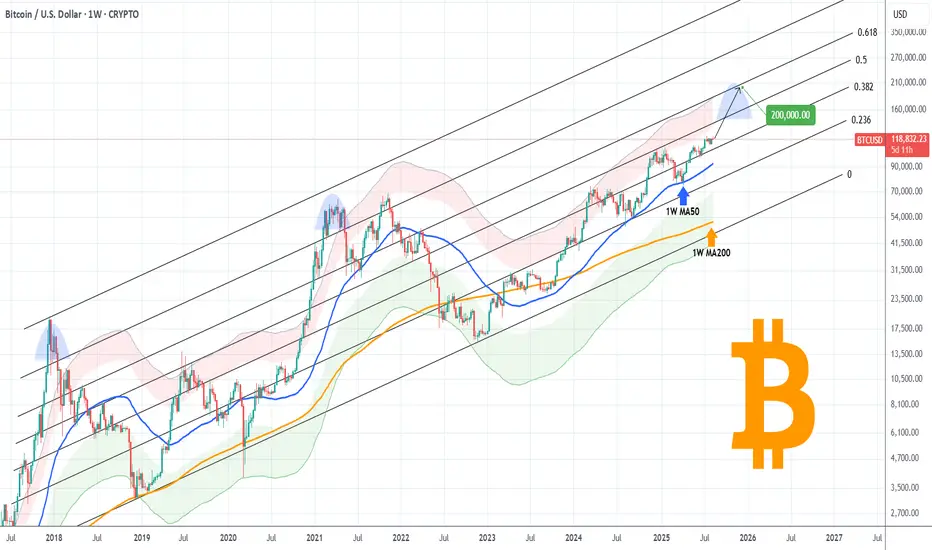
BITCOIN Can it break above this 3-year Resistance and hit $200k?Bitcoin (BTCUSD) is extending its main 1W MA50 (blue trend-line) fueled rebound, which only recently confirmed the continuation with a short-term bounce on the 1D MA50. The short-term setting is transferred now back to the long-term and the next Resistance, which is the middle (0.5 Fibonacci level) of the macro Channel Up, that has been dominating BTC's price action since late 2017.
The 0.5 Fib has made its last rejection/ failed attempt to break on December 16 2024. It's been holding as a Resistance since May 02 2022. The last two Cycle Tops however haven't only been priced above the 0.5 Fib but above the 0.786 level too (obviously as close to the Channel Top as possible).
As a result, if BTC does break above the 0.5 level, a 'mere' test of the immediate upper Fib (the 0.618) could be translated by the end of the year (timing of Cycle Top) to a $200k test. That would also be a test of the Top of the 1st SD above (red Zone) of the Mayer Multiple Bands (MMBs), which is technically still within high tolerance levels.
So do you think we can get near $200k by the end of the year if the 0.5 Fib breaks? Feel free to let us know in the comments section below!
-------------------------------------------------------------------------------
** Please LIKE 👍, FOLLOW ✅, SHARE 🙌 and COMMENT ✍ if you enjoy this idea! Also share your ideas and charts in the comments section below! This is best way to keep it relevant, support us, keep the content here free and allow the idea to reach as many people as possible. **
-------------------------------------------------------------------------------
💸💸💸💸💸💸
👇 👇 👇 👇 👇 👇