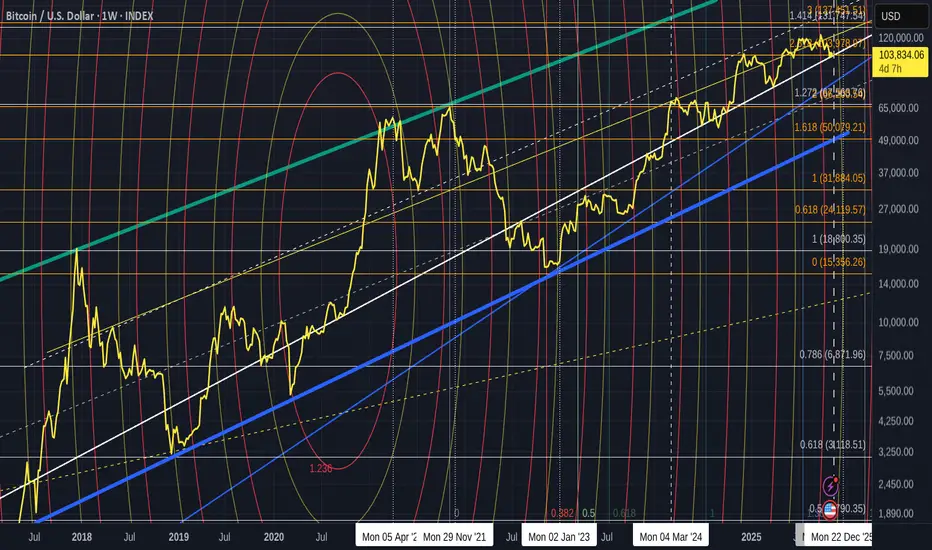
BTC/USDT Analysis. The level is broken — what’s next?
Hello everyone! This is the CryptoRobotics trader-analyst with a daily market update.
Yesterday, the previously outlined scenario played out as expected. After a brief consolidation around the $95,000 level, Bitcoin continued its upward move. The balance structure has been broken, but the key question now is whether it makes sense to chase longs at current prices.
Despite Bitcoin’s strong weekly performance, retail traders remain cautious. Moreover, activity from small-cap market participants continues to decline. Historically, this behavior suggests there is still room for further growth, and a move toward six-digit prices may follow.
On a local scale, we are observing anomalous activity in the $96,900–$97,500 zone. When price returns to this area, delta shifts toward buyers, yet this dynamic also signals seller pressure at resistance. If Bitcoin fails to confidently break and hold above the local hourly high at $97,200, a corrective move toward the nearest strong support becomes likely.
That said, the broader market sentiment remains bullish. In the event of a clean breakout and consolidation above this level, the $96,900–$97,500 zone may act as a support area.
Buy zones
$94,400–$93,200 (volume anomalies)
$92,000–$90,400 (accumulated volumes)
$88,400–$87,000 (accumulated volumes)
$86,000–$84,800 (anomalous activity)
$84,000–$82,000 (strong volume anomalies)
Sell zones
$96,900–$97,500 (potential resistance, volume anomalies)
$101,000–$104,000 (accumulated volumes)
This publication is not financial advice.
Bitcoinsupport

Quick Bitcoin DAILY Bullish moves continue, now testing support
Strong moves by Bitcoin so far this week and potential for more.
PA is taking a breather ,as it needs to and will come back down and test that Dotted line as support. This same Trend line was used in September 2024 to push Bitcoin up to New Highs.
This 4 hour chart shows us more detail
Would be SO VERY Bullish for PA to come back here and test that line as support and hold it.....
Can it do that?
My opinion is YES but we do have some very strong resistance over head, in many forms.
It maybe Good if PA sits on top of this line for a while....And it may do so, as it cools off.
The Daily RSI
RSI not over bought yet but in an area that shows RSI could do with Cooling and it has turned down slightly...It may continue to do so.
The Daily MACD
This is one I am watching CLOSE>
See that descending line that has rejected MACD twice already.
It may do that again....and as we get nearer the end of the month, I am wondering which way this will go
The Month candle is currently Green and is statistically, likely to remain that way, However, this could change very easily should we loose this line and PA looses the Bulish sentiment.
So, remain Alert and have a plan.

BTC/USDT Analysis. Emergence of Activity at a Key Level
Hello everyone! This is a CryptoRobotics trader-analyst with a daily BTC analysis.
In yesterday’s weekly overview, we outlined two scenarios for Bitcoin. During the attempt to execute the second scenario — a decline toward the $88,400–$87,000 zone — price encountered strong volume-based support. As a result, BTC was quickly pushed back into the resistance range of $92,000–$93,000 (buying absorption, selling activity).
At the moment, Bitcoin is trading within this resistance zone, while delta shows increased buying pressure. This behavior can be interpreted in two ways: either as continued absorption of buyers by sellers, or as accumulation by buyers ahead of a potential breakout.
A confirmed move above or below the $92,000–$93,000 zone will determine the near-term market direction. The primary scenario remains a decline and retest of the more significant support at $88,400–$87,000 (accumulated volume), though a bullish breakout scenario cannot be ruled out.
Buy zones
$88,400–$87,000 (accumulated volume)
$86,000–$84,800 (anomalous activity)
$84,000–$82,000 (strong volume anomalies)
Sell zones
$92,000–$93,000 (buying absorption, selling activity)
$101,000–$104,000 (accumulated volume)
This publication is not financial advice.

BTC/USDT Analysis. Attempts to Break the Global Range
Hello everyone! This is the CryptoRobotics trader-analyst. Due to the holiday period, we temporarily paused daily updates, but now we are back with regular weekday analysis.
Ahead of the New Year, Bitcoin spent an extended period trading within a range. As previously mentioned multiple times, the breakout potential was directed toward the upper boundary of this range — and this scenario began to materialize.
On January 2, we observed a local “Santa rally” and a move toward the higher-timeframe resistance zone at $94,000–$97,500, from which a subsequent downward movement developed.
At the moment, after testing the now-mirror support zone around $90,000, the market received a strong reaction: selling pressure was absorbed, and buying activity resumed.
We are currently considering a move toward the newly formed resistance at $92,000–$93,000, where previous buying absorption and seller activity were observed. This zone is now ключевая:
— a confident breakout and consolidation above it would open upside potential toward $100,000;
— strong resistance and failure to break higher could intensify the pullback and return the market to a range-bound structure. In this case, the primary downside target would be the $88,400–$87,000 zone, where significant accumulated volume is located.
Buy zones:
• $88,400–$87,000 — accumulated volume
• $86,000–$84,800 — anomalous activity
• $84,000–$82,000 — strong volume anomalies
Sell zones:
• $92,000–$93,000 — buying absorption, seller activity
• $101,000–$104,000 — accumulated volume
This publication is not financial advice.

BTC/USDT Analysis. Return to a Range-Bound Structure
Hello everyone! This is CryptoRobotics trader-analyst, and here is the daily analysis.
Yesterday, we closely monitored the reaction around the mirror buy zone $89,400–$88,800, but the expected support failed to appear. This invalidated the short-term scenario of a move toward the upper boundary of the range.
After breaking below that support, price returned into the sideways structure and reacted from a stronger zone at $87,200–$86,800 (anomalous activity).
At the moment, we observe absorption of selling pressure on the delta, indicating local demand. The current potential is directed toward the upper boundary of the range. Resistance is now defined by a broader zone $89,500–$90,300, rather than the single $90,000 level as before.
The primary scenario for the coming week remains rotation between major volume zones.
The breakout potential is still considered to the upside. Even if the range expands downward, we maintain a bullish bias and will look for long opportunities from lower volume areas.
Buy zones
$86,000–$84,800 (anomalous activity)
$84,000–$82,000 (strong volume anomalies)
Sell zones
$89,500–$90,300 (anomalous activity)
~$92,400 (local zone)
$94,000–$97,500 (volume zone)
$101,000–$104,000 (accumulated volume)
This publication is not financial advice.

Bitcoin Support LevelsBitcoin Current 89088
Short Term Supports 87720 83904 ( Fibonacci Resistants)
Med Term Support 73867 ( Fib Resistant) and psycological 70000

Quick Bitcoin Update - BTC entered a Squeeze. Needs to react
Simply, PA is now on a line of support that goes way back to 2017
PA Rose above it in 2019, COVID caused a Drop below but PA Recovered.
The 2022 Bear kept PA below for a Long Time but we broke back over.
And now, we test it again at te end of the 3rd Ranging period this Cycle.
There are things that Both Support and wtroy the idea that Oa can stay here and so we really do need to remain vigilant...
This Zoomed chart explains the situation clearly.
So we see, PA is now in a triangle, with the 2.618 Fib extension at around 103978, acting as resistance and the Long Term line f support mentioned above , as support.
This is a tight Squeeze. The Apex is around 17 November
PA ALWAYS REACTS BEFIRE THE APEX
This could be abytime from now till then.....
Be Ready
Bulls....We need you
Oceania trading week about to commence NZ. USD, Gold, Bitcoin
*
The USD could see some weakness this week, probably not coming until mid-week price possibly propelled by double/bottom structures on mid-timeframes, however the Daily timeframe is indicative of some weakness with price below the moving averages. It's possible later in the trading week the USD could retreat to the 100.60 - 100.85 zone where there is support. Let's see how that play out.
The whole idea is a bit counter-indicative of a short I am expecting on EUR/USD which is very overbought at the moment.
* In other developments, Bitcoin BTCUSD showed some strength during Sunday's session but is since off its' highs in the weekend session. However, BTCUSD is getting support on the 200 EMA on the Daily. I would not be surprised to see some bullishness in Cryptocurrency this week, with the shine perhaps coming off Gold which is overextended and overbought across all timeframes. The Silver price has further to run but will generally follow Gold's lead.
* In precious metals, as I point out above I see a short in XAUUSD very soon probably today, there is more buying demand on the higher timeframe for Platinum XPTUSD, XAGJPY, XAGUSD, XAUJPY whereas XAUGBP, XAUAUD & XAUUSD look over-bought. As I point out above, it's always tricky because I find they all mostly track the gold-price.
Have a good trading week, Oceania trading in NZ commences in 30 minutes (6pm New York time) and the Australian ASX kicks off in just over 2 hours time.
Chris

Bitcoin support levels reached & heldIf you've been holding out on Bitcoin, here are the levels a smart trader would be buying. We've finally reached a level on the chart where history has shown high demand, as marked by my white circles.
This analysis is strictly Technical, as Fundamentals don't matter once you get to high demand levels that are watched by Top Traders.
I won't predict a new high or breakouts, but I will say that history has proven that levels like this are very strong & highly predictable, based on my technical experience.
If you're willing to swing trade this move, I'd be looking to take profits around the $38,350 level.

Bitcoin trying to fightback but stiff resistance weakness ahead.Bitcoin trying to fightback but stiff resistance ahead 33031 which was a major support is not a major resistance.
Supports for Bitcoin: 29757, 28616, 26101. If 26101 broken next major support will be only at 19808. (reaching 19808 very likely in the medium term).
Resistances for Bitcoin: 33031, 34787, 37173 and major resistances will be 39303 and 43086.(reaching 43086 very unlikely)

Bitcoin's Next Short-Term Target (Support & Resistance)Here you have beautifully mapped Bitcoin's next resistance (targets) and also support levels.
This is a short-term move.
The main resistance range is set around $45,000 $45,850, the most important level to watch for.
Keep in mind that Bitcoin can hit up to $55K and we still keep our long-term bearish view.
Feel free to leave a comments with your questions, opinions and charts.
Thank you for reading.
Namaste.

Bitcoin Big Picture LevelsUPDATE #BTC levels.. A break of 35.9k opens move to 34.5k looks like it could send it much lower toward a target near 26k-30k.
#Bitcoin support levels: 36,300 / 34,500 / 33,000 / 29,000 / 26,300
Bitcoin resistance levels: 38,800 / 39,250 / 40,000-40,200 / 45,800 / 50,000
The facts are: Bitcoin isn’t a good hedge against inflation when Fed is tightening. It’s not really leading into a favorable seasonality trend for end of Feb into March. Google search trends peaked in 2021.
USD strength = BTC sells off (most likely) / The mechanics of a credit unwind are essentially a short squeeze on the deflating (appreciating) fiat currency. What is the main denomination of Bitcoin? = USD

Wyckoff accumulationa again - BTCI realized a pattern of Wyckoff accumulation forming again. It is expected to be similar to the pattern happening during summer 2021. Have a look of it!
As this is my first video, please support it with like and share.


BTCUSDT CONSOLIDATION AREAcurrently btc is at support area and there is lots of chances to go up after touching the support.
what is support?
support is where buyers are sitting
what is resistance?
where selllers are sitting.
HOPE YOU ALL ARE FINE.

Bitcoin trend updateas I have marked on my idea if breach down 53k we gonna roll down to 52 but after that, it's 51 waiting for us. if you see my rectangle after one breakout, it gonna go down sharp but, there is no reason for it and as I imagine, bitcoin gonna range max one day between 53-55,5 until one good break that shows the future bitcoin days. there is no reason for a fall so I think it gonna range for some hours and after that gonna breach upwards forward to 57k and maybe sharp forward to 61,5 k. every number in this text is approximately number for a nearly exact number check my chart.

Bitcoin S/R zones / favorite patterns Hello Community and all crypto fans!
In this idea I wanna to show you my favorite price action patterns which I am using for my daytrading. Also in the chart you can see my key levels and support/resistance zones.
In comments bellow I will share also VWAP and Orderflow charts.
Hope you like it and feel free to ask me anything.


BITCOIN APPROACHING MAJOR SUPPORT !The Purpose of this chart is to serve as a guide for you to know when it's safe to buy bitcoin, as you know charts are made by two axis, price and time, both variables are equally important, therefore a good buy must be placed at the right price and at the right time, trying to anticipate a good buy opportunity can result in a failure of the timing causing you to lose money. So when is safe to buy? simple, keep track of this chart and buy when the price meets the yellow support line, right now price is in the middle of the road, don't buy now, The line on the right chart (big picture) I pointed a major support for bitcoin, this line has held since 2012, it raises about $200 every 12 days, the longer bitcoin holds above $6000 the less it will drop, this line with reach $6000 at around December 23, it is an estimated, all this numbers and dates have a small error. why this support will continue to hold? because the bitcoin fundamentals for what it was created still remain intact, this support is the representation of those fundamentals, it shows us that Bitcoin is has been in a major uptrend since then. If you want to get more detailed updates keep in tune with this link t.me
