BITCOIN: Deadlines and CommitmentsPRIMARY LONG-TERM SELL SIGNAL PENDING: (upper panel)
According to my primary long-term trading signal, BITCOIN has a two week deadline to stage a rocket launch rally to negate a long-term SELL confirmation at the close of November trade.
EARLY RSI BUY SIGNAL for 2026? (lower panel)
My custom weekly RSI is rapidly heading toward the oversold 30 level. The good news going forward, insofar as this RSI is concerned, is that in the past, upon closing beneath 30 on a monthly basis, and then closing back above 30 in similar fashion, it has produced sustainable long-term rallies of significance.
WEEKLY MOMENTUM: (bottom panel)
Long-term momentum has moved into bearish territory with readings below zero. If the big cycle top is in with the November 126,272 print high, it is then likely that momentum will continue to test its lower bound before consolidating and registering some bullish momentum divergences as it did in the last move down to the 15,479 print low.
ELLIOTT WAVE COUNT:
Despite the growing possibility that the big cycle top is already in place, I am giving BITCOIN bulls the benefit of the doubt in labeling the current move down as that of a 4th wave of primary degree, with another move higher to fresh all time highs to mark the larger Cycle Degree 3 wave terminal.
In this most bullish case, it is essential that Bitcoin maintain trade above the 69,000 Cycle Degree wave 1 high. Any print beneath that level going forward, and it might be lights out for Bitcoin, at least in terms of Elliott Wave Tenets.
If you are sitting on substantial profits and do not want to see them wither away any further, it may be wise to get a lot smaller on any rallies going forward.
Bitcointrading

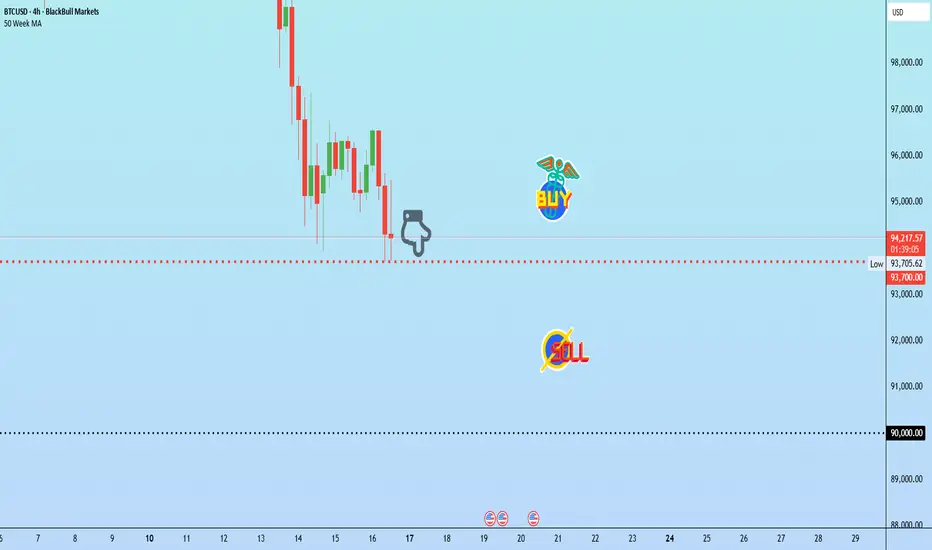
BTC needs to hold this level or risk a slide toward 90K?Bitcoin is at a crucial juncture. This week’s move could possibly prove vital for the cryptos forecast leading into Christmas.
Bitcoin has extended losses for a 4th session, now trading less than $95K. 93,700 dollars is possibly the most immediate support on the chart.
For any recovery to gain traction, price might need to reclaim 101,150 dollars and establish higher lows above it.
Perhaps the most important fundamental issue pressuring BTCUSD are the remarks from Fed officials questioning whether a December rate cut is warranted. Adding to the downside, Japan Exchange Group has apparently paused the listing of three crypto treasury firms while it reviews new compliance and disclosure rules. Japan remains the largest market in Asia for listed Bitcoin treasury firms, with fourteen companies currently holding BTC.
Bitcoin Breaks Below $100,000 – The Downtrend Isn’t Over Yet!Bitcoin is entering one of its most vulnerable phases of the quarter, as both fundamentals and technicals strongly point toward a continued downside. The break below the psychological $100,000 level has triggered a wave of widespread fear , pushing the market firmly into defensive mode.
Recently, ETF outflows have accelerated , with institutional funds pulling out more than $3.4 billion since October. At the same time, expectations for a Fed rate cut in December have weakened , while the U.S. Dollar rebounds , adding more selling pressure across the crypto market. The Fear & Greed Index plunging into “Extreme Fear” highlights how fragile and cautious overall sentiment has become.
On the chart, the downtrend is now unmistakable. Price continues to move within a descending channel , repeatedly getting rejected at the upper trendline. The $100,000 level has flipped into strong resistance . Without substantial buying pressure, BTC is likely to rebound only slightly into the $100,000–$102,000 zone before sellers step in again.
The most probable short-term scenario: BTC trades weakly, makes a small bounce into resistance, then continues sliding toward the $90,000 support zone. If this level breaks, the next destination sits near $87,600, where major support aligns with the bottom of the channel.
Given the negative news flow, weak liquidity , and bearish technical structure , the dominant trend remains to the downside. This is not an ideal moment to attempt bottom-picking—at least not until the market shows genuine signs of recovery or institutional capital begins flowing back in.

Bitcoin is painfully weakBitcoin ATH break at was the first sign of weakness, now relative strength index is at levels bitcoin hasn't been at since early 2023 - big difference in price $96k 3 years in a bull market vs $22k after the horrible painful 2022 bear market. I think 2026 will be bearish for bitcoin. Mid term elections will offer uncertainty and if you look at bitcoin's performance in 2025 under the "pro crypto" administration it has been painfully weak only up around 1% YTD. I think around $75k is a good area to watch. Full global economic meltdown like 2022 and Im looking at $48k region. COINBASE:BTCUSD

Bitcoin Market Analysis: Correction or Downtrend?Bitcoin: Correction Wave or Beginning of a Downtrend?
Overview of Recent Bitcoin Trends
At the end of the second week of March 2023, a clear confirmation of an uptrend emerged in the Bitcoin chart. Since then, Bitcoin has experienced a series of corrections, each time reaching historical price levels. This consistent pattern has led to ongoing speculation about when a genuine downtrend might begin.
Current Market Outlook
Presently, from a long-term perspective, Bitcoin appears to be undergoing another correction wave. This wave closely resembles the previous correction that concluded in the second week of April 2025, though the current correction is notably more aggressive.
Short-Term vs. Long-Term Strategies
For short-term traders, there are indications that the recent uptrend may be reversing. A clear signal for a potential short-term downtrend has emerged after Bitcoin broke below the price point of $106,710.00. Traders are closely monitoring whether prices will continue to decline, which could result in significant losses for many who are already experiencing substantial daily losses. Alternatively, there remains the possibility that this correction is temporary, and a new uptrend could push prices to new highs in the coming months.
Critical Price Levels to Watch
•Long-Term Traders: A decisive break below $75,000 is a critical level in the current correction wave.
•Short-Term Traders: The ongoing downtrend is expected to end if prices climb to $106,500 or higher.
However, it is important to consider the risk-to-return ratio before taking any position. Assessing the potential risk and potential reward is crucial in making informed trading decisions.
It's worth noting that the analysis provided is based on the information given and assumes the accuracy of the mentioned technical indicators. However, market conditions can change rapidly, and it's always important to conduct comprehensive and up-to-date analysis before making any investment decisions.

SOLUSDT – When Buyers Start to Lose MomentumAfter an exciting short-term rally, Solana is beginning to show signs of losing steam , as buying pressure weakens around the $167–$170 zone — an area aligning with the long-term descending trendline .
The technical picture is tilting slightly in favor of the bears: price has been repeatedly rejected near $170, forming a pattern of lower highs, while trading volume continues to decline. This indicates that buyers no longer have enough strength to break through the current downtrend structure.
If this scenario persists, Solana could pull back toward the $153 support zone, where buying activity previously emerged. Holding above this level will be crucial in determining whether the market can consolidate again or extend its decline further.
Overall, the short-term bearish trend remains dominant. Unless a strong catalyst or fresh liquidity enters the market, Solana may continue to drift lower within the current descending channel — a necessary “step back” before the next potential bullish phase begins.

BTCUSDTBTCUSDT price is in the key support zone 100025 - 99036. If the price cannot break through the 98491 level, it is expected that the price will rebound. Consider buying the red zone.
** Very Risky Trade
🔥Trading futures, forex, CFDs and stocks carries a risk of loss.
Please consider carefully whether such trading is suitable for you.
>>GooD Luck 😊
❤️ Like and subscribe to never miss a new idea!

BTCUSD – Signs of Recovery Within the Downward Channel?Currently, BTC is moving within a clear descending channel on the 4H timeframe, but bearish momentum has started to weaken. The 99,600 USD zone is acting as a key support level , where strong buying pressure tends to appear whenever price approaches this area.
The price structure suggests a possible retest of this support zone , followed by a rebound toward the upper trendline of the channel around 105,000 USD. The formation of higher lows in the short term indicates that buyers are gradually regaining control of the market.
I expect BTC to hold above 99,600 USD and start forming a short-term bullish reversal . If price breaks above the 105,000 USD resistance zone, the uptrend will likely be confirmed, opening the way toward 108,000 USD in the upcoming sessions.
Main Scenario:
Prefer Buy positions near 99,600–100,000 USD, taking short-term profits at 105,000 USD.
The bullish outlook remains valid as long as price holds above 99,000 USD.

FIL / USDT: Breaking down from channel,10-20% downside potentialFIL / USDT is breaking down from the parallel channel.
Watch for clear confirmation to catch a 10–20% downside move.
⚠ Manage risk wisely and don’t enter without proper confirmation.

BTC Strong Surge: Heading Towards 110,700 USD!BTC/USDT is in the process of a strong recovery after reaching the important support level at 99,500 USD. After forming a bottom and bouncing from this level, the current trend indicates a high potential for continued growth.
The next resistance level for BTC is 110,700 USD. If the pair can break through this level and maintain above it, the price could continue its strong upward momentum, opening the opportunity to reach higher levels in the short term.
However, if it fails to hold above the 99,500 USD support, BTC may face difficulties and could pull back to lower support levels. Despite this, with the current positive technical signals, the likelihood of BTC continuing to rise in the next 24 hours is very high.
Traders should carefully monitor these support and resistance levels to formulate an appropriate trading strategy.

BTCUSD – When the Whales Dump, Bitcoin Free-Falls Without BrakesHey traders,
The crypto market is once again in turmoil! Bitcoin has just dropped below $100,000 , its lowest level in months, after whales unloaded over $45 billion in positions — a powerful blow that shook the entire market.
At the same time, expectations for a Fed rate cut in December are fading , spreading a broad “risk-off” sentiment. Investors are pulling money out of risk assets, flowing instead into the USD and bonds, adding more downward pressure on crypto.
On the 4-hour chart, the bearish structure remains dominant. Price continues to move inside a descending channel , with the $104,600 area now acting as a critical short-term resistance. Every rebound has been swiftly rejected — a clear sign that the market isn’t ready for any meaningful recovery yet.
If price fails to retest and hold above $104,600, the next likely scenario is a drop toward $96,700, where the next major support zone lies.
Right now, the market looks like it’s exhaling after a leverage hangover . With both fundamental and technical pressure converging, the bearish trend remains the dominant direction for Bitcoin in the short term.

Bitcoin update + new setupsETH was leading the move to sweep the lows, and it did.
Now that both BTC and ETH have cleared liquidity below the previous lows, we have new setups, depending on the confirmations at key S/R levels.
⚠️ These setups are based on a bounce scenario toward the SSL. Setups become invalid if the market drops further toward the lower Pivot areas. When that happens, a new update will follow.
BTC: (When support confirmed above SSL)
- Entry around SSL ~103540
- tp1 ~104900
- tp2 ~106200
- close ~108200
- stop depends on previous low when support confirmed above SSL
BTC: (When SSL is rejected and confirmed)
- DCA around SSL ~103500-102500
- tp1 ~100600
- tp2 ~98900
- close ~104800
Note: Don't forget to take partial profits on the way to secure your trade.

Bitcoin Losing Steam – Is the $100,000 Zone Calling?Hello everyone, BTCUSDT is currently trading around $109,600, still facing strong pressure from the medium-term descending trendline . After three failed attempts to break above the $112,000 resistance, selling momentum is gradually taking control.
On the macro side, although the Fed cut rates by 0.25% , Chair Powell’s cautious remarks suggest the central bank isn’t ready for an aggressive easing cycle. This “hawkish rate cut” keeps the USD strong and weakens risk appetite — an unfavorable setup for Bitcoin in the short term.
Adding to the pressure, October — typically known as “Uptober” — closed with a sharp red candle , signaling widespread pessimism. Meanwhile, Spot Bitcoin ETFs continued to record hundreds of millions of dollars in outflows , showing that institutional investors remain on the sidelines.
From a technical perspective, the lower-high structure is clearly visible, with EMA34 and EMA89 sitting above the price, reinforcing the bearish bias. If the $105,000 support fails to hold, the next key target lies near $100,000, a level that has historically attracted strong buying interest.
Combining both fundamentals and technicals, BTCUSDT appears to be in a short-term corrective phase , and the likelihood of a retest of the $100,000 zone in the near future remains quite high.

BTC/USD 4H Bullish Reversal Setup — Support Zone Holding with ?Key Levels:
Support Zone: Around $108,700–$109,000 — identified as a demand area where price recently rebounded.
Target Zone: Around $112,400, marking the next resistance and profit-taking region.
Structure:
SMT (Smart Money Trap): Indicates a liquidity sweep at the lows before reversal.
MSS (Market Structure Shift): Confirms a bullish break in market structure.
Trade Idea:
Bias: Bullish
Entry: Near support zone
Stop Loss: Below $107,400
Take Profit: Near $112,400
Rationale:
After the SMT sweep and subsequent MSS, price shows bullish intent to retrace toward previous structure highs. The highlighted area suggests an optimal long entry with a favorable risk-to-reward setup.

BitcoinBTCUSD
- Completed " 1234 " Impulsive Waves
- Break of Structure
- RSI - Divergence
- Bullish Channel as an corrective pattern in Short Time Frame
- Demand Zone

Bitcoin (BTC/USD) - Bullish Continuation from Order Block (OB)The analysis uses concepts from Technical Analysis and Smart Money Concepts (SMC), indicating a short-term bullish bias:
Recent Trend: The chart shows a recent strong upswing followed by a slight pullback. The overall movement from October 27th onwards suggests a continuation of the upward momentum.
Market Structure Shift (MSS): The price recently broke above a local swing high (near $114,500), which is often termed a Market Structure Shift (MSS) in SMC. This break confirmed that the prevailing short-term trend is upward.
Order Block (OB): The gray shaded box, labeled OB, represents an Order Block. This is a specific area where smart money (institutions) may have placed buy orders, and it is identified as a strong area of support.
The current price action shows the price has dropped back into this critical support zone (around $112,500 to $113,500).
Consequent Retracement Levels (CRT):
CRT-L (around $111,800) is the lowest level of the recent swing or the bottom of the structure being referenced for support.
CRT-H (around $116,000) is the swing high, which is also identified as the primary target for the expected bullish move.
Proposed Price Action: The primary black arrow suggests that after testing the OB support zone, the price is expected to turn sharply upward and rally back toward the high at CRT-H ($116,000). The current slight rebound from the OB supports this idea.
Interpretation and Trading Bias
The analysis has a clear bullish continuation bias. The trader is looking for long (buy) entries inside the Order Block (OB) zone, anticipating that the price will hold this institutional support and target the previous swing high at $116,000.

SOLUSDT – Bullish Trend Supported by Technical Structure and NewAfter a brief correction, SOLUSDT is showing strong signs of a continued upward movement. The ascending triangle pattern on the H4 chart indicates that SOL is building a solid base, with higher lows and testing the resistance at 200.00 USD. The price is currently above the EMA34, signaling strong buying momentum.
Notably, the price has recently broken through the important 200.00 USD resistance and is now approaching 216.00 USD. If SOL continues to hold above the 200 USD mark and confirms further upward movement, the next target would be 216 USD.
With positive news surrounding Solana and increased investment interest, SOL is likely to maintain its bullish momentum in the short term.
Strategy: Buy around 200.00 USD, target 216.00 USD, stop loss below 195.00 USD.
Summary: The short-term bullish trend remains strong, and SOLUSDT may reach the 216 USD target if it holds above the 200 USD support level.

BTCUSDT – When the Bullish Wave ReturnsBitcoin is showing a notable recovery phase after a series of previous corrections. On the daily timeframe, price continues to move within an ascending channel that has been forming since the beginning of Q3.
Currently, BTC is approaching the midline of the channel around 115,000–116,000 USD , with key support at 106,700 USD and upper resistance near 127,700 USD.
If the price retests the 112,000–113,000 USD zone and holds, this could become a perfect “launchpad” for the next bullish move.
From a fundamental perspective, expectations of a Fed rate cut and South Korea’s more open stance toward crypto are providing positive momentum for risk assets like Bitcoin. However, signals from the options market and investor sentiment still show some caution, meaning the upward move may be gradual and range-bound rather than explosive.
Overall, BTC remains under bullish control , and as long as the price holds above the 106,000–107,000 USD zone, the gradual climb toward 127,000 USD remains the most likely scenario.

Bitcoin Rises After the Trade Storm?Bitcoin/USDT has surged strongly after confirmation of a high-level meeting between the U.S. and Chinese leaders, easing concerns over tariffs and trade tensions. At the same time, U.S. CPI data for September came in below expectations, reinforcing the possibility that the Federal Reserve may soon cut interest rates — creating a favorable environment for risk assets like Bitcoin.
On the chart, the price has rebounded from the 107,000 USD support zone and is now testing the 111,000 USD level — a clear sign that the bullish structure remains intact. If the support holds and the price breaks above nearby resistance, the next target could lie around 120,000 USD or higher.
Current strategy: prioritize buying on minor pullbacks around 108,000–110,000 USD while aiming for higher targets. However, if the 107,000 USD support breaks, it would signal the need for a more cautious approach.

BTCUSD – When the rebound is just a trapAfter a short technical rebound around 111–113k, Bitcoin is now facing a strong resistance zone — where both EMA 34 & EMA 89 converge, along with a key supply area that triggered the mid-October selloff.
Structurally, the chart is forming a series of lower highs , while the recovery momentum remains weak and buying volume keeps fading — clear signs that bulls are losing strength. If BTC fails to break above the 113k–115k zone, the price could turn lower toward 107k support , or even retest the long-term ascending trendline.
Although recent news shows continued ETF inflows, their impact seems to be diminishing. With the USD showing mild strength and market sentiment still cautious after the earlier crash, bears are gradually taking control in the short term.
Scenario to watch
Resistance zone: 113k – 115k
Target zone: 107k – 105k
Upcoming trend: mild downside or support retest

$BTC Update: Last Sunday, we discussed that Bitcoin could move CRYPTOCAP:BTC Update:
Last Sunday, we discussed that Bitcoin could move toward $115K, and after that, a pullback was expected. However, this week the market showed clear manipulation — Bitcoin jumped back to $114K, then dropped to $106K, reacting to a mix of news around China, Trump, and tariffs, along with other bullish and bearish headlines.
For now, Bitcoin has reclaimed the $110K support and is trading above it, showing some short-term strength.
If BTC continues to hold above $110K, the next resistance is near $113.5K, around the 1D 50 EMA, which remains the strongest hurdle for bulls. A clean breakout and hold above this zone could trigger a move toward $117K–$120K — that’s where I’ll be looking to add more shorts.
I’m still holding my previous short position with an average entry around $122K, and my plan is to add more if price reaches $115K–$117K. The overall structure remains bearish, and I’m waiting for clear direction.
Today’s CPI report will likely decide the next move:
If BTC pushes higher on the data, I’ll add to my shorts.
If it drops, I’ll continue holding.
The only time I’ll consider closing shorts is if Bitcoin breaks and resists below $100K.
#bitcoin

Bitcoin: Strong Downtrend – Don’t Miss the Sell Chance!Hello traders,
Although Bitcoin showed a slight recovery on Wednesday, the crypto market is still struggling after the sharp decline in early October. Selling pressure remains strong, as the market hovers near recent lows with no clear signs of recovery.
With uncertainty surrounding the U.S. economy and ongoing trade tensions with China, investors are avoiding risk – further weighing on risky assets like Bitcoin. In addition, the drop in gold prices hasn’t provided enough buying momentum for the crypto market to rebound.
The BTC/USDT chart clearly shows a strong downtrend with a steep descending trendline, and resistance around $112,000 has already been pushed back. The price is expected to continue falling, with the next support area around $102,000.
A great opportunity to sell Bitcoin and take advantage of this downtrend!

ETHUSDT – Sideways Trend with Clear Technical StructureETHUSDT is currently trading within a sideways range between $3,750 and $4,580. The support at $3,750 has been tested multiple times and remains strong, while the resistance at $4,580 continues to be tested but has not been broken yet.
Technical Analysis:
EMA34 and EMA89 are providing support from below, indicating that the long-term uptrend is still intact, although in the short term, the market is struggling to break through the current resistance levels.
The price is moving within a narrow range, creating a clear sideways trend. However, if the price cannot break $4,580, there is a possibility it will continue to trade within this range.
News:
Institutional inflows into ETH remain steady, supporting the long-term uptrend, although in the short term, the market lacks the momentum to break the resistance levels.
Macro factors like the U.S. CPI and expectations for Fed rate adjustments will impact the cryptocurrency market, but overall, ETH continues to maintain good stability within this range.
