SOLUSDT – Weak rebound, bears back in controlAfter a sharp drop on October 14, Solana made a slight recovery but quickly hit resistance at the downtrend line — where sellers stepped back in strongly. The $208 zone continues to act as a tight lid on price action, signaling that current buying pressure isn’t strong enough for a reversal.
With U.S.–China trade tensions still simmering, the overall crypto market — including SOL — remains under pressure. If the price fails to break above this descending trendline, SOL could likely fall back toward the $188 support zone, or even $175 in the next move.
In short, the main trend remains bearish, and current rebounds look more like opportunities for sellers to reload for the next push downward.
Bitcointrading

ETH/USDT – Ethereum’s Downtrend May ContinueAlthough Ethereum saw a slight recovery on October 14th, it remains under significant pressure from US-China trade tensions, negatively impacting the financial markets and Ethereum’s value. The US imposing 100% tariffs on Chinese goods, along with retaliatory measures from China, has raised concerns about global economic stability. These factors have pushed ETH/USDT down to a low of $3,893.
The chart shows that Ethereum is trading within a clear downtrend channel, with $4,130 acting as a strong resistance level. After hitting this resistance, Ethereum may continue to decline towards $3,530 in the coming days if there is no positive shift in the fundamental factors.
With the market still uncertain and US-China trade tensions unresolved, Ethereum is likely to remain under downward pressure in the short term.

BTC/USDT – Downtrend ContinuesBitcoin is facing downward pressure after the escalation of US-China trade tensions. Although President Trump made more conciliatory remarks, which helped ease short-term concerns, the global economic uncertainty remains a major factor driving BTC/USDT into a downtrend.
On the chart, BTC/USDT is moving within a clear downtrend channel. Despite a slight recovery, the price is currently fluctuating around $113,129 and could continue to adjust towards the 106,500 USD and 101,800 USD targets in the near term.
With ongoing macroeconomic instability and no strong signs of recovery, Bitcoin may continue to decline in the short term.

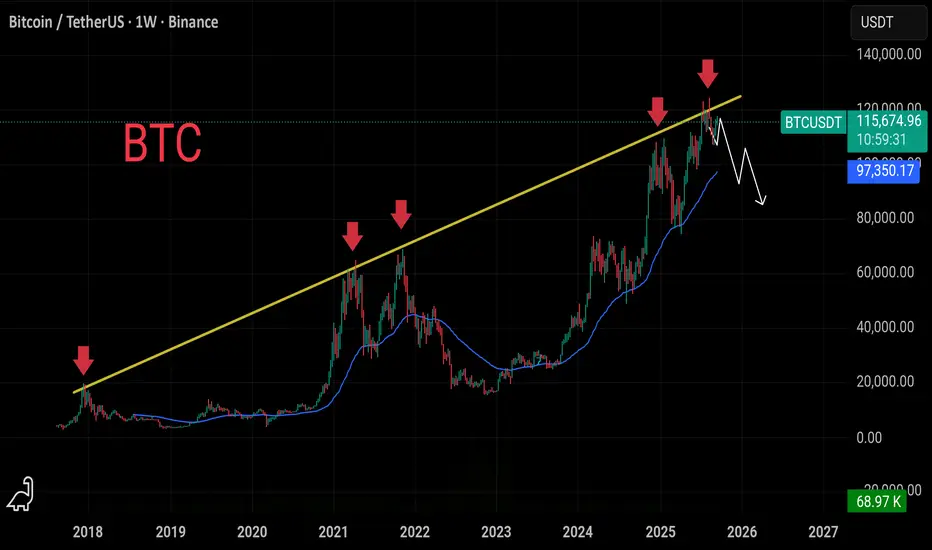
Bitcoin Faces Rejection — Bearish Continuation SetupKey Observations:
Price Action & Rejection Zone:
The highlighted green area represents a short-term supply zone, where previous buying momentum weakened and sellers re-entered the market. Price briefly retested this zone and faced rejection, confirming bearish intent.
Stop Loss Placement:
The red zone above, around $114,300, marks the stop-loss level, strategically set just above the rejection wick to protect against a false breakout.
Bearish Confirmation:
A clear lower high structure has formed, signaling weakening bullish momentum and potential continuation of the downward move.
Target Zone:
The blue dotted line near $111,070 identifies the target level, aligning with a prior support zone and liquidity area — a likely destination for bearish momentum to complete its next leg.
Projected Path:
The curved black and white arrows indicate the expected retracement and continuation pattern, showing price potentially retesting the supply zone before dropping toward the target.

BTCUSD Plunges: USD Intensifies Downward Pressure!BTCUSD is currently in a downtrend, with the chart showing Bitcoin's price moving below a clear downward trendline. The resistance level at 116,100 USD remains a key point to watch. If the price fails to break this level, BTCUSD is likely to continue its decline towards the next support levels at 104,500 USD.
A strong increase in USD buying by hedge funds and asset managers, combined with rising trade tensions between the US and China, is driving the strength of the US dollar. As the USD strengthens, BTCUSD faces downward pressure, as risk assets like Bitcoin tend to decrease in value.
With fundamental factors supporting the USD and the chart showing a bearish adjustment, BTCUSD is likely to continue its downward trajectory in the short term, targeting the support zone at 104,500 USD.

Bitcoin BTC price analysis after crash📈 OKX:BTCUSDT held above the key psychological level of $100,000, remaining within the long-term uptrend 💪
💀 Altcoins suffered heavy losses — liquidity vanished across the board.
This highlights the importance of balance:
🔸 20% in low-cap alts
🔸 80% in resilient assets
💰 The official $19–20B liquidation figure seems understated —
data suggests the cascade started on CEX platforms after algorithmic issues and liquidity gaps.
📊 Fear & Greed Index: 38 — still fear, volatility ahead ⚠️
🇺🇸 The U.S. market open could set the tone for the week 🎢
💭 Do you expect CRYPTOCAP:BTC to retest lower levels before the next leg up?
______________
◆ Follow us ❤️ for daily crypto insights & updates!
🚀 Don’t miss out on important market moves
🧠 DYOR | This is not financial advice, just thinking out loud

Continuously making HH HLBTC Analysis
CMP 112510.14 (12-10-2025 02:58AM PST)
Continuously making HH HL & is Still Bullish in the
longer run.
as shared on 02-06-2025, Cup & Handle Target hit
around 115000 - 120000 & then dropped.
3 Important Support levels are :
S1 around 108000 - 108450
S2 around 95000 - 95200
S3 around 86000 - 86500
S2 seems to be a Stronger Support as this range is
also around Channel Bottom.
Upside Targets seems to be around 132000 - 132300
initially.
BTC seem safe as long as it stays above 74000; if it
breaks this level, we may witness trend reversal.

Bearish Divergence on Bigger tf
CMP 105228.47 (02-06-2025)
Bearish Divergence on Bigger tf (Cautious
approach should be taken).
However, if 109350 is Crossed, we may
witness 115000 & then 120000 - 121000.
and if 112000 is crossed & sustained, be ready
to get New Highs :-)
Lets be more cautious & dig out 3 Important
Support Levels.
S1 around 103000 - 102500
S2 around 97800
S3 around 93400 - 93500.

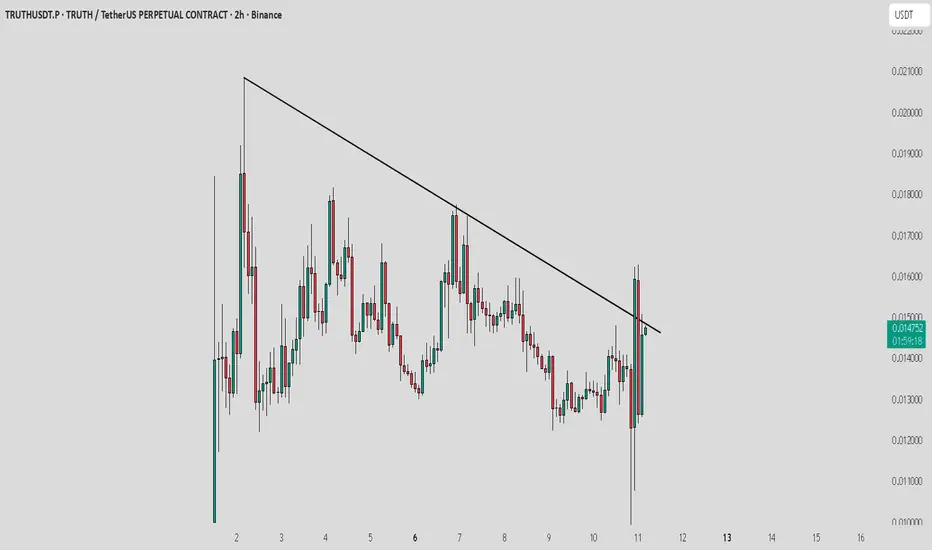
TRUTH / USDT : Showing strength after huge market dumpTRUTH / USDT is showing strength after yesterday’s pullback. If the next candle takes support from the trend line resistance, it could confirm continuation and offer a good profit opportunity.
Keep a close watch and trade with proper risk management.
Solana and Bitcoin Update ! Whats Next Quick update covering BTC and Solana .
I had done videos previously anticipating this move to the downside and wanted to cover the current price action and add a little clarity to the situation .
We have had a great reaction off of BTC so far and thus some alts have also followed suit .
Bitcoin holds the fate for the alts so we want to see btc hold the current range 113K .
Take it level by level and dont panic . This is a great opportunity but we want to see a sign of strength in SOL before taking positions .

BTCUSD 30m – Bullish Continuation ExpectedBITSTAMP:BTCUSD
Structure | Trend | Key Reaction Zones
Price formed a strong base at 120,800, bouncing from the demand zone.
Accumulation structure confirmed, with multiple liquidity grabs before breaking the descending trendline.
Currently retesting breakout — bullish continuation likely if price holds above 123,200.
Market Overview
BTC has successfully broken out from a short-term bearish channel after sweeping liquidity from the lower side. The demand zone between 120,800–121,200 provided a solid foundation for buyers, signaling fresh momentum. Now retesting the broken trendline, and if held, we could see a continuation toward the upper supply zone.
Key Scenarios
✅ Bullish Case 🚀 → Bounce from 123,200 → 🎯 Target 124,500 → 🎯 Target 125,700 → 🎯 Target 126,200
❌ Bearish Case 📉 → Break below 122,000 → 🎯 Target 121,000 → 🎯 Target 120,000
Current Levels to Watch
Resistance 🔴: 124,500 / 125,700
Support 🟢: 123,200 / 121,800
⚠️ Disclaimer: This analysis is for educational purposes only. Not financial advice.

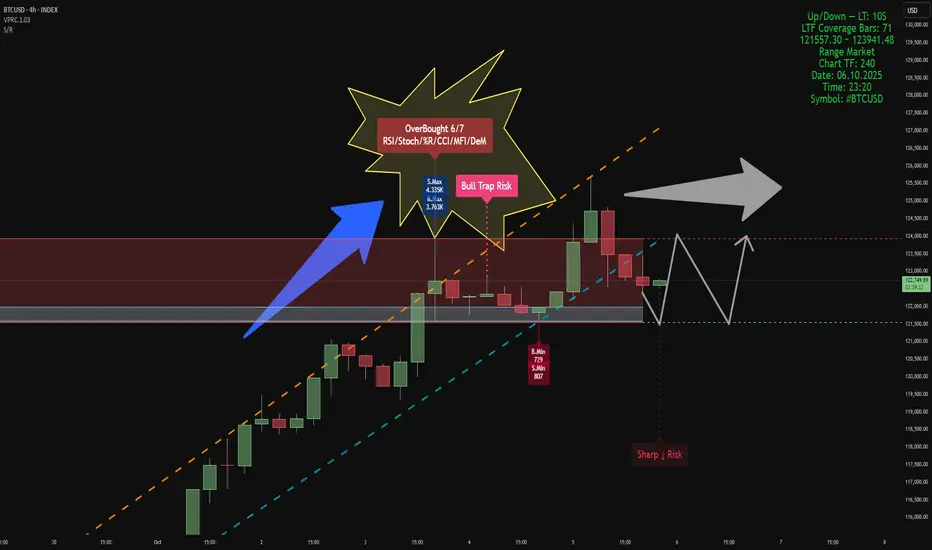
BTCUSD – 4H Volume-Structure Analysis
Indicators
Smart Money Support/Resistance (Lite) & ATAI Volume Analysis with Price Action V1.03
Analytical Setup
• LTF: 10 seconds
• LTF Coverage Bars: 70
• Global Volume Period: 52
• Market Type: Range
• Active Zones:
- Support Zone: 121,557 – 123,941 USD (current active range shown in panel)
The analysis timeframe ensures valid volume coverage, as the period (52) is smaller than total LTF bars (70).
Resistance Area & Bull Trap Risk
In the upper range (≈123,900 USD), a Bull Trap Risk has formed immediately after an OverBought 6/7 condition — confirmed by RSI, Stoch, %R, CCI, MFI, and DeM modules in ATAI. At this point, both buy and sell volumes peaked within the 52-bar window, with S.Max = 4.33K and B.Max = 3.76K. This slight dominance by sellers indicates demand absorption at the top of the structure. The setup matches ATAI’s trap logic — high wick, overbought context, and volume imbalance — signaling potential exhaustion near resistance.
Support Area
Support is currently anchored near 121,550 USD, derived from B.Min and S.Min lows (B.Min = 7.29, S.Min = 807). This aligns with the lower projection from Smart Money S/R, marking the point where cumulative delta begins to compress. Historically, compression at minimum-volume zones often precedes short-term accumulation or range stabilization.
Structural Behavior
The chart shows a defined upward channel (orange and cyan dashed lines). After testing the upper boundary, price entered the resistance zone and generated a Bull Trap Risk followed by moderate rejection. Below, the Sharp ↓ Risk tag signals potential for a short liquidity sweep before stabilization. Volume readings still support range continuation rather than a confirmed reversal, consistent with the Range Market tag.
Probable Scenario
1. A short pullback toward the lower boundary of support (~121.5K) is expected.
2. If support holds and volume compression persists, a rebound toward 123.9K (resistance ceiling) is probable.
3. A breakdown below 121.5K could trigger a deeper correction toward the next S/R projection near 120K.
This represents a neutral-to-bullish range bias: short-term weakness, but constructive above support.
Summary
• OverBought 6/7 + Bull Trap Risk detected at resistance (≈123.9K).
• Support around 121.5K built from B.Min and S.Min.
• Sellers slightly dominant at the trap peak.
• Likely scenario: retest of support, then rebound toward resistance if volume confirms.
• Bias: range continuation until breakout beyond 123.9K or breakdown below 121.5K.
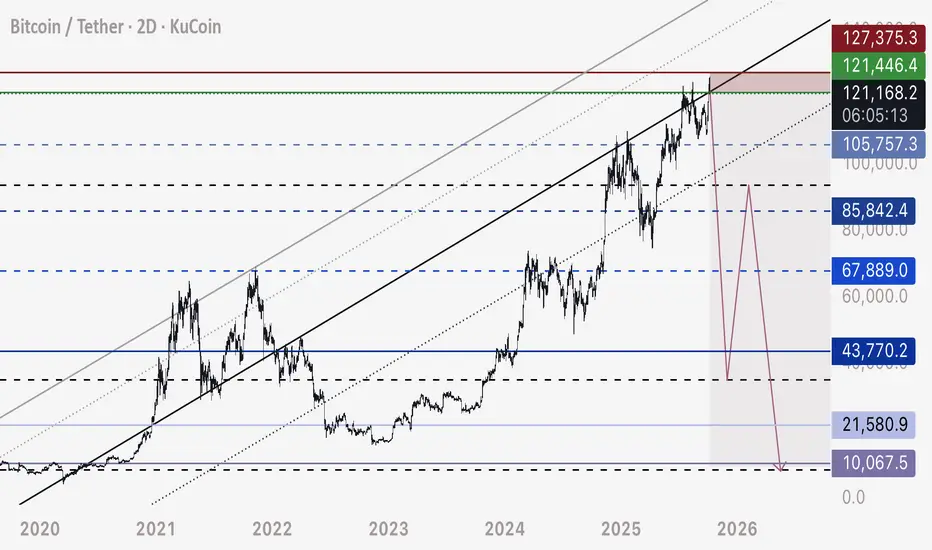
BTC - Trade Setup Today for my Flash Crash Plan Branching off my previous two posts today, which are linked below and give an in depth analysis and theory behind this idea and plan, here are the details of my short trade on Bitcoin.
Entry - 121,400 to 121,700
Stop Loss - Keep it Tight at 127,400 in case Bitcoin moves up to 126,800 to form the head of an inverse head and shoulders (unlikely but I keep two direction ideas in mind always)
Take Profits:
105,700 - 10% Closure
85,800 - 10% Closure
67,900 - 20% Closure
43,800 - 60% Closure
From here, if I see Bitcoin start to rise from 35,000 - I will open a hedge long position, fully close 80% of short, and DCA all profits back into my short at 92,000 to 93,000
21,600 - 60% Closure
10,000 - 100% Closure
From here, I will buy BTC on spot at 8,000 to 10,000
Any questions feel free to comment below.
For each laughing face I will add in more to my short, which I am logging for a future post.
Yours truly,
- DD
BTC/USDT Bullish Channel – Eyes on $130K Targets🔍 Key Observations:
Trend Direction: Bullish
Price is moving consistently within an upward sloping channel, suggesting a strong and steady uptrend.
Current Price: ~$124,353
Price is near the lower boundary of the channel, indicating a possible bounce opportunity to ride the trend higher.
Targets:
Target 1: $128,001
Target 2: $130,100
These are potential resistance zones or profit-taking levels if the bullish move continues.
Structure:
The marked zig-zag path suggests anticipated higher highs and higher lows, in line with a typical channel-based bullish continuation.

My idea on how Bitcoin can move the coming months!I will let the chart tell the story!
If we break the rising wedge top line we are set to visit the "bubble could fill zone"
Fingers crossed we break up instead of down, because that looks terrible if we do!

Bitcoin establishes early Uptober support baseToday was a positive sign as bitcoin rose $3236, or 2.9%, to $114,3500. That move potentially helped establish a potential floor for the Uptober rally.
From a technical perspective, Bitcoin is holding above the rising 100-day exponential moving average, which has acted as dynamic support at times since April. The price has broken this trendline multiple times over the past few months, and each time buyers have stepped in to defend it.
Upside levels to watch:
$116,500 – First resistance from late September intraday highs.
$120,000 – Key swing high from July, a strong psychological barrier.
$124,000 – Major resistance from August.
$128,000 – Year-to-date peak.
$140,000 – Round number resistance and measured move target if Bitcoin clears $128K. Also lines up with Fibonacci extensions of the April–August rally.
$150,000 – Big psychological milestone.

Bitcoin Below $109K, Correction or Buying Opportunity?On September 25, 2025 , Bitcoin dropped below $109,000, the lowest point in the past three weeks. The $22 billion options expiration at the end of the month could create short-term selling pressure, but it may also present a recovery opportunity once this pressure eases.
BTCUSDT is trading within a clear downward channel, with lower highs and lower lows . Notably, the price has just faced strong resistance at $109,900, which also aligns with the downtrend line connecting previous highs.
If BTCUSDT cannot break through $109,900, we may see a strong correction towards the nearest support level at $106,000.
With a combination of news and technical analysis, BTCUSDT could continue its downward trend in the near future. Stay prepared and take advantage of the trading opportunities!

Bitcoin Tests Support at $110,500: Will the Downtrend Continue?The chart shows that Bitcoin is in a descending channel, with higher price levels being blocked, creating lower highs. Recent price action has formed a "lower high" pattern and is continuing to move downward.
BTC is currently testing support at the $110,500 level, and if broken, Bitcoin could easily drop to the $109,800 region. This is a level that traders need to watch closely, as if it fails to hold, the price may fall even further.
Recent news about significant liquidations from whales and cautious sentiment from Bitcoin ETFs is pushing the market toward a bearish trend. The actions of large investors, along with the fluctuations of other currencies like the USD, and price adjustments from previous resistance levels further reinforce the downtrend.
Wishing you successful trading!

SOLUSDT: Strong Uptrend with Solid SupportSOLUSDT is currently showing a strong upward trend thanks to the stability of the cryptocurrency market and a positive risk sentiment from investors. The Solana (SOL) token is receiving significant support from fundamental factors, such as a stable commodities market and the pressure on the US dollar due to the Federal Reserve's interest rate cuts.
From a technical perspective, SOLUSDT is testing the important support level at $199.00. If this level holds, the likelihood of a rebound and continuation of the uptrend is very high. The next resistance level is expected to be at $218.00, and if this level is breached, the price could continue towards $230.00.
The upward trend line remains intact, providing positive signals for the next move. Based on both fundamental and technical factors, SOLUSDT is likely to maintain its upward momentum if the support at $199.00 holds.

How to Avoid Bear and Bull Traps When Trading BitcoinWhen trading Bitcoin (BTCUSDT), you’ve probably heard of terms like Bear Trap and Bull Trap. These are traps that the market sets to deceive us, causing us to make wrong decisions and suffer losses. Let’s explore how to identify and avoid these traps.
1. What are Bear Trap and Bull Trap?
Bear Trap: This occurs when Bitcoin's price drops significantly, leading us to believe that a downtrend has begun, so we sell. But then, the price suddenly rises sharply. The result? We sell at the wrong time and miss out on potential profits.
Bull Trap: On the other hand, a Bull Trap happens when Bitcoin's price surges, making us think that an uptrend will continue, so we buy. But then, the price reverses and drops sharply, causing us to lose money by buying too early.
2. How to Identify Bear Trap and Bull Trap
Bear Trap: When the price drops but without strong trading volume, and RSI is in the oversold region, but the price does not continue to fall.
Bull Trap: When the price rises but trading volume does not follow suit, and RSI is overbought, but the price fails to maintain the uptrend.
3. How to Avoid Falling Into These Traps
Use Stop-Loss: Set stop-loss orders at key support and resistance levels to protect your account if the market moves against your expectations.
RSI: Use RSI to identify when the market is overbought (Bull Trap) or oversold (Bear Trap), helping you make better decisions.
EMA: Use moving averages like EMA 50 and EMA 200 to determine the main market trend and avoid being misled by “false moves”."
XRPUSDT: Downtrend and Future Trading StrategyHello traders, based on the chart and the latest news on XRPUSDT, the current trend is leaning towards a downtrend. The gradually decreasing resistance indicates strong selling pressure, and XRP is trading below the Ichimoku Cloud, confirming the short-term bearish trend. XRP has dropped sharply from $2.87 to $2.77 on September 23, 2025 , due to a contract liquidation event worth $1.7 billion, mainly from long positions, causing further price correction.
With resistance at $2.8900, if the price cannot break through this level, the likelihood of a further decline towards $2.6200 is high. This is the next key support level to watch. If the downtrend continues, this support zone could be tested again.
Trading Strategy: Watch for selling opportunities near the $2.8900 resistance and set a stop-loss if the price moves above this level.

$BTC Sunday Update Nothing has changed, structure still intactCRYPTOCAP:BTC Sunday Update
Nothing has changed, structure still intact I’m still holding my short, staying patient for the lower targets ahead. If BTC makes a push into 120, 125K, that’s where I’ll load more. My downside map stays the same: 105K → 100K → 95K → 90K. Altcoin pumps look like nothing more than liquidity traps set by market makers before the real drop unfolds.
BITCOIN GOLDEN ZONE RESISTANCE FOR NEXT LEG DOWNThis is continuation and update on my previous analysis on Bitcoin. As noted earlier Bitcoin found support on the weekly 21 EMA and has retrace to the golden fib zone. The overhead resistance on the weekly chart is still intact with the double tops shooting stars. The daily chart is presenting itself as the lower high at the golden fib zone. Indicators are also pointing to the lower side as there is no strength on RSI and MACD. From these signals I still expect BTC to sell off to the bearish targets with the initial target at $105,724. There is also the likelihood that price consolidates at this zone for a moment before the pullback.
The trade idea and plan will be invalidated if we get a candle open and close on the daily chart above the golden zone of about $118k.
Thanks for listening and reading my publications and please share your thought in the comments sections if you see otherwise or support the trade idea. Let beat the market together. Cheers!!!
