Bitcointrading


Daily range, supports and resistances !
I hope you are all well !
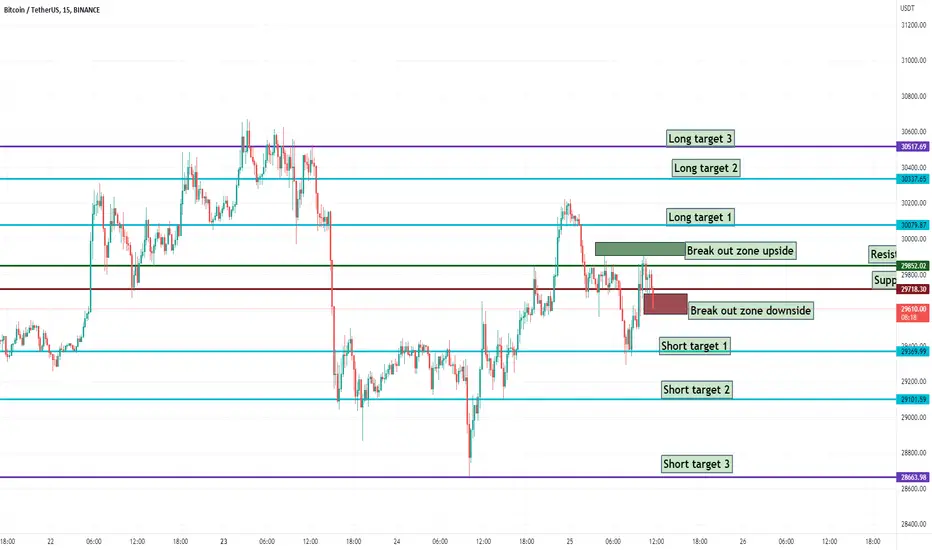
The range is between 30 517$ and 28 663$
we got a support at 29 743$ and a resistance at 29 852$.
Be ready for the long breakout zone colored in green and the short breakout zone colored in red.
Long targets are : 30 079$, 30 337$ and 30517$.
Short targets are : 29 369$, 29 101$ 28 663$.
Be careful in your trading and don<t forget to subscribe, I will do range, supports and resistances analysis everyday.
Thanks
-Frank
Bitcoin BTC Entry Range, Take Profits and Stop LossBTC/USDT
Entry Range: $28880 - 30300
Take Profit 1: $32000
Take Profit 2: $33845
Take Profit 3: $36500
Stop Loss: $26550

A clean break above 29650 will send BTC to test 30700 againBTC found support at the bottom of the channel and has enterend back into the flag. Now it just needs to clear the midline


Bitcoin is bouncing off support and moving towards resistance.Hi Guys
The chart shows BTC vs USDT on the 8 hourly on Coinbase.
Bitcoin is bouncing off the June 2021 ATL (Green Horizontal Line), which is seemingly providing a level of support so far.
Bitcoin is about to re-enter a downward parallel channel (Red Lines) in which you can see has formed strong price points (support/resistance) with the white highlights.
Breaking this channel with strong volume would be a bullish move.
Right now we are getting a lot of side action but it will have to end at some point.
What are your thoughts guys, bullish or bearish?
Like if you agree.
Many thanks,
Casey
Disclaimer: Not professional Advice

BTC Update - Next Target @ $25,000The 4 Hour chart is over bought.
Momentum is dying and it looks like BTC will be on its way down soon.
Opening longs here might not be the best idea while inside this bear flag / pennant however you want to look at it.
Small bounce expected once it hits #5.
Entry Between:
$30,791.00 - $29,414.00
Take Profit:
TP 1 - $26,736.10
TP 2 - $25124.80
Stop Loss:
$31,262.00
If you'd like me to analyse any other crypto send me a message or leave a comment 👍🏽
Happy trading!
Not Financial Advise. Do Your Own Research.

Btc Bitcoin technical analysisBTC remains determined to complete its pattern.
Accordingly, I think of the possibility of throwing a needle in the fib 1.27 region, which I show on the chart.
Most likely the price will find support at fib 1.13. But I expect a spike to fib 1.27.
In this case, our price expectation may be in the range of 23K and 18K. In the previous analysis, I gave a detailed explanation on this subject.
Although this decline may seem sad, it may actually herald the end of the bear season. Because all things exist as inseparable and contradictory opposites
I think the next pattern will appear again as a harmonic pattern.

BTC Bitcoin Entry Range, Take Profits and Stop LossBTC/USDT
Entry Range: $29560 - 30900
Take Profit 1: $32150
Take Profit 2: $34250
Take Profit 3: $36500
Stop Loss: $26550
short targets reached

BTC forecast - Two short-term trades!Today we will consider two potential trades that we plan to trade on the BTCUSDT chart.
The logic of the trading situation on the first trade:
The first wave of the Bitcoin price rebound is not yet complete. The price of BTCUSDT is moving in a consolidation wedge. Buyers will try to organize another wave of growth.
Entry - $29341
stop - $29107
TP-1 - $30600
TP-2 - $31750
The logic of the trading situation on the second trade:
The price completed its first wave of growth within the global rebound. However, after the correction, a second wave of growth is expected. Bitcoin price is moving in a wide consolidation channel and we expect a test of the lower trend line of the channel.
Entry - $27455
stop - $26562
TP-1 - $29100
TP-2 IS $31750.
In this case, before entering into a position, we should calculate the probable amount of losses on the stop orders of two positions ahead. And just after that make a decision on how much of the deposit to enter into the trade. Let us remind you that now we trade counter-trend deals, which are more risky than trading along the trend.

Bitcoin weekly support and targets !
Bitcoin is sitting on the 31 100$ mark. We are currently bullish and are looking for a breakout of the main resistance at 31 886$.
Lets look at the zone of interest for this week.
Its possible so a retrace the the 3 lower support 30 836$, 28 797$ and 37 136$.
If we Break the around the 32 000$ , we look for bullish action.
Target 1 : 33 831$
Target 2 : 35 535$
Target 3 : 37 861$
Be ready for movement and be careful the market is very volatile these days.
- Frank

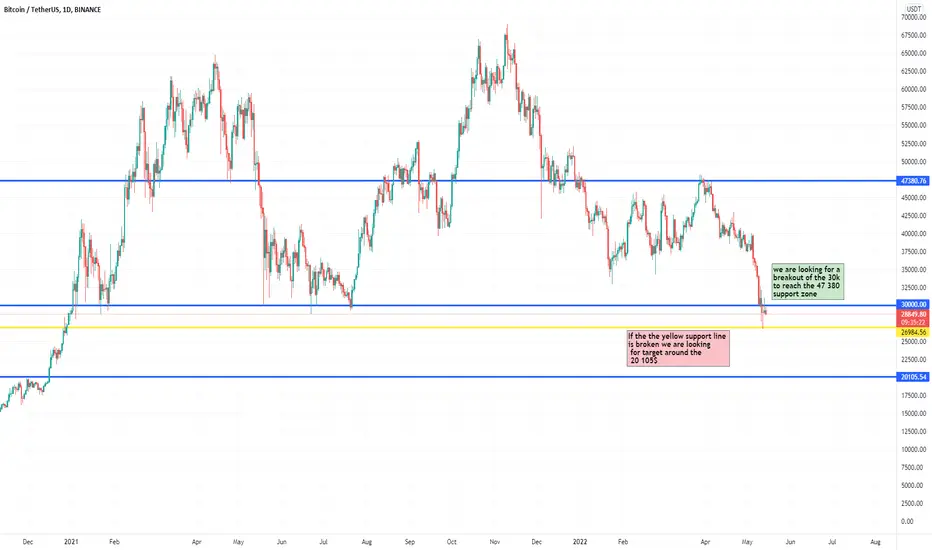
Bitcoin to 20 000$ or 50 000$ ?
We had crazy price action in the past few months and its not over.
We have 3 blue line supports area : 47 380$, 30 000$ and 20 105$. We are near the 30 000$ resistance, if its broken we are bullish and the target is the upper resistance.
If not and the yellow smaller resistance we are bearish until we enter the lower support.
What you believe its going to happen next ? let me know in comment
Enjoy your weekend
- Frank
Bitcoin road to a new high...Hello cryptofolks
Bizzare I dea for Bitcoin here
Will get invalidated if the IHS pattern doesn't come out
Looking for bottom around $19k
-Goodluck
Forza Luna holders

Bitcoin medium term analysisHello
We are watching the Bitcoin bounce from the areas of 26k dollars that I previously identified, and how you see the chart, we have a high probability that the Bitcoin will rise to the areas of 40k dollars in the medium term.

LONG-TERM BITCOIN PROJECTIONHi Guys
We have possibly hit the bottom and here's an idea you may find very interesting that could predict a rough route Bitcoin could take to see new ATH's.
THE LONG ROAD AHEAD
First off the chart: KRAKEN; WEEKLY; BTC vs USDT. The red, yellow and green lines represent areas of support and resistance. The pink dotted line represents a 50% price point between the ATH and the recent low (possibly ATL for 2022). Th blue horizontal Line represents the lowest weekly close since 2021. The White lines represent a price projection.
Unless you've been living under a rock, you would of heard about the Wyckoff Approach, which outlines how massive financial machines buy up or sell off assets.
I found an interesting Reaccumulation Schematic. (See Reaccumulation Schematic 2 in the website bellow)
halotrader.medium.com
This schematic shows very similar price movements (so far) with the weekly price action of bitcoin. Not 100% of course but similar enough to compare.
I traced the exact lines onto the chart and came up with this scenario.
I'm 100% confident the exact lines will NOT be followed but COULD be a helpful guide to judge price direction.
Please Like if you agree and comment with your thoughts.
Many thanks,
Casey
DISCLAIMER: NOT PROFESSIONAL ADVICE.
