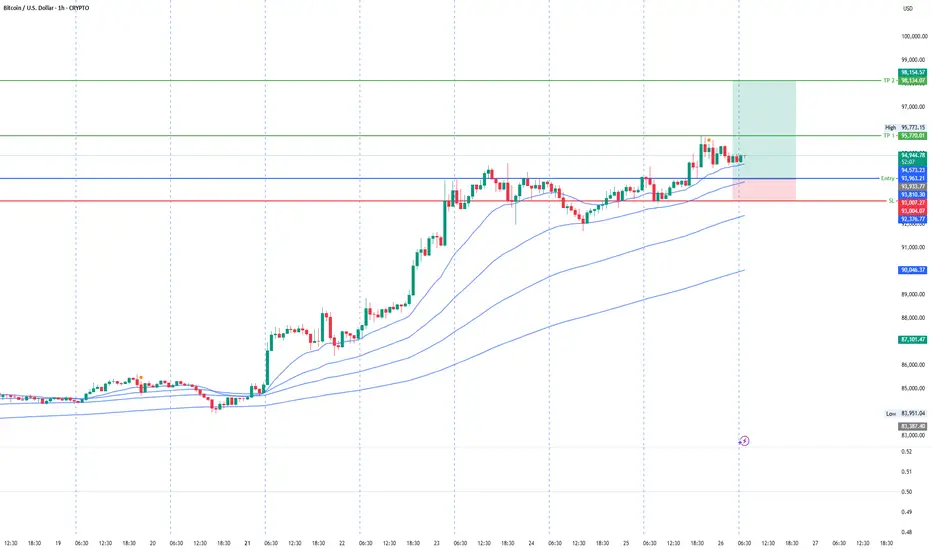
BTCUSD BUY IDEA-EASY CONFLUENCE PLAY??After reaching an all-time high (ATH) last week, Bitcoin is currently positioned at a pivotal $105,484 at the .23 level according to the Fibonacci trend. It has retraced to previous highs around $105,000 to $106,000. Recently, it bounced off the support level of approximately $102,740 on the 4-hour and daily charts and seems to be forming higher lows. I believe we could see a confluence play that aligns with the previous price action that led to the ATH.
Bitcoinusd

SOLVUSDT Forming a Bullish waveSOLVUSDT is showing a strong bullish wave pattern after an extended downtrend, suggesting that it may have completed its accumulation phase. The chart clearly illustrates a double-wave reversal formation with higher lows, pointing toward a bullish continuation. The recent breakout candle combined with solid trading volume indicates renewed market interest and a possible start of a major uptrend. Based on the structure, a potential move of 90% to 100% from current levels seems realistic, as highlighted in the price projection zone.
Solv Protocol, the project behind SOLV, has been making strides in the decentralized financial instrument space, particularly around tokenized vouchers and structured assets. With increasing on-chain activity and protocol developments, investor sentiment appears to be turning positive again. SOLV’s listing on major exchanges like Binance further supports the legitimacy and growing traction of the token. As crypto markets rotate capital into emerging sectors, tokens like SOLV are gaining more visibility.
From a technical perspective, SOLVUSDT has broken out from a significant descending channel, forming a base with strong upward momentum. Each retracement is being bought up quickly, confirming bullish strength. If the price holds above key support zones, the upside continuation may play out rapidly as traders and algorithms begin to follow the breakout signal.
With bullish market structure, increasing investor attention, and favorable tokenomics, SOLVUSDT looks poised for a powerful upward run. This is one of the more promising setups for traders looking to ride a fresh wave with high risk-reward potential.
✅ Show your support by hitting the like button and
✅ Leaving a comment below! (What is You opinion about this Coin)
Your feedback and engagement keep me inspired to share more insightful market analysis with you!

TRBUSDT Forming classical Bullish BreakoutTRBUSDT has recently broken out of a long accumulation zone, forming a classic bullish breakout structure on the daily chart. The asset saw a significant surge from the key support zone between $28 to $32, which has now been confirmed as a strong demand area. The breakout was backed by a sharp spike in volume, indicating strong buyer conviction and institutional interest entering the market. This breakout marks a pivotal shift in momentum and suggests that the bulls are in full control.
The technical setup points to a potential rally of 100% to 130%, targeting levels around the $75 mark and beyond. The previous resistance zones have been decisively cleared, and the strong green candles hint at the possibility of a sustained uptrend. If the asset holds above the breakout level and continues to consolidate at higher levels, it could build a strong base for the next impulsive move. This kind of vertical price action is often seen in assets with growing investor demand and limited supply pressure.
Investor interest in TRB is noticeably rising, as reflected in the increased social media chatter, positive sentiment across crypto forums, and higher engagement on trading platforms. The coin is benefiting from renewed market confidence and strong fundamentals. With macro tailwinds in the crypto market and a technically sound chart, TRB appears poised to outperform in the coming weeks.
Traders should closely monitor the price action around $50–$52 for potential retest opportunities. A successful retest followed by bullish continuation could offer a high-risk/reward long setup. The projected upside remains highly favorable, supported by robust volume and clean technical structure.
✅ Show your support by hitting the like button and
✅ Leaving a comment below! (What is You opinion about this Coin)
Your feedback and engagement keep me inspired to share more insightful market analysis with you!

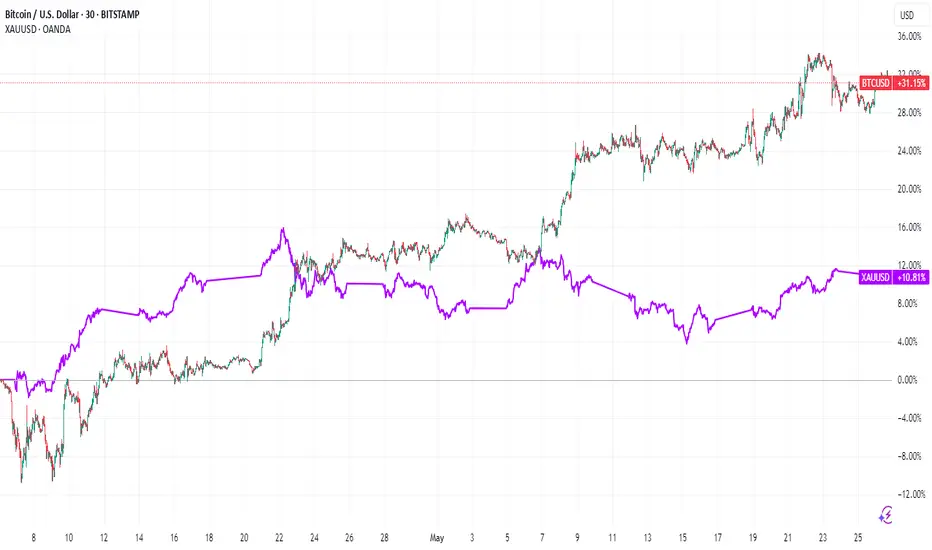
Bitcoin vs. Gold: Central Banks Pick Gold (Here's Why)
The debate over the ultimate store of value has been reignited in the digital age. For centuries, gold, the immutable yellow metal, has been the bedrock of wealth preservation, the trusted haven in times of turmoil, and a core component of central bank reserves. In the last decade, a new contender has emerged: Bitcoin, the pioneering cryptocurrency, often touted as "digital gold." Yet, as the dust settles on initial exuberance and institutional scrutiny intensifies, a clear preference is emerging from the world's most conservative financial institutions. Central banks, the guardians of national wealth and financial stability, are overwhelmingly demonstrating their continued faith in gold, signaling that when it comes to the ultimate safe reserve, tradition and tangibility still trump technological novelty.
The evidence for this preference is not merely anecdotal; it's etched in the consistent and accelerating trend of global gold accumulation by these institutions. In recent years, central banks have been on a gold buying spree, a phenomenon driven by a confluence of potent global factors. The shifting geopolitical landscape, characterized by increased tensions, trade disputes, and a move towards a more multipolar world, has spurred a desire for assets that are not tied to any single nation's political or economic fortunes. Policies emanating from major economic powers, including periods of heightened trade protectionism and shifting global alliances, have historically fanned uncertainty, prompting a flight to assets perceived as universally valuable and politically neutral – a role gold has fulfilled for millennia.
Furthermore, concerns over the long-term value of major fiat currencies, particularly the U.S. dollar which has long dominated global reserves, are playing a significant role. Persistent fiscal deficits, expanding sovereign debt levels, and unprecedented monetary stimulus measures in various countries have led to an undercurrent of apprehension about potential currency devaluation. In such an environment, central banks are actively seeking to diversify their holdings and hedge against the erosion of purchasing power. Gold, with its intrinsic value and finite supply, offers a compelling alternative to holding ever-increasing amounts of fiat currency, whose value can be diluted by policy decisions. This strategic de-dollarization, or at least a diversification away from dollar-centric reserves, sees gold as a primary beneficiary. It is a tangible asset that sits outside the traditional financial system, offering a layer of insulation from the counterparty risks inherent in holding other nations' currencies or debt.
In stark contrast to this institutional embrace of gold stands Bitcoin. While proponents champion its decentralized nature, its mathematically enforced scarcity, and its potential as an inflation hedge, its inherent characteristics currently make it a challenging proposition for central bank reserves. The most glaring issue is its extreme volatility. Bitcoin's price history is a rollercoaster of meteoric rises and precipitous falls. For an individual retail investor, this volatility might be a tolerable, even attractive, risk in pursuit of outsized returns. However, for a central bank, whose primary mandate includes capital preservation and maintaining financial stability, such wild price swings are anathema. Reserve assets must be relatively stable, liquid, and dependable. Bitcoin, in its current state, struggles to meet these criteria consistently. A significant allocation to Bitcoin could expose a nation's reserves to sudden and substantial losses, undermining public trust and potentially destabilizing its financial position.
This volatility poses a tangible risk, not just theoretically, but as observed in the experiences of investors globally, including those in the U.S. While some have reaped fortunes, many others have faced considerable losses due to ill-timed investments or the market's unpredictable nature. Institutional investors, including those in the U.S., while showing increasing interest in Bitcoin as a speculative asset class or a small part of a diversified portfolio, still largely treat it with caution. The kind of deep, unwavering institutional trust that gold commands – built over centuries of proven performance as a store of value and a crisis hedge – has yet to be earned by Bitcoin. Gold’s market is deep, liquid, and well-understood, with established clearing and settlement mechanisms. Bitcoin's market infrastructure, while maturing, is still relatively nascent and fragmented compared to the centuries-old gold market.
Beyond volatility, other factors hinder Bitcoin's adoption as a mainstream reserve asset for central banks. Regulatory uncertainty remains a significant hurdle. The global regulatory landscape for cryptocurrencies is a patchwork of differing approaches, with some nations embracing innovation while others impose strict controls or outright bans. For central banks, which operate within stringent legal and regulatory frameworks, this lack of global consensus and clarity is a major deterrent. The operational risks associated with custody and security of digital assets at a sovereign scale are also non-trivial. While blockchain technology is inherently secure, managing private keys for billions of dollars' worth of Bitcoin requires sophisticated and untested protocols for institutions of this nature.
Furthermore, the narrative of Bitcoin as "digital gold" sometimes overlooks fundamental differences. Gold is a physical commodity with diverse industrial and cultural uses, providing a baseline of demand beyond its monetary role. It is universally recognized and accepted, transcending technological barriers. Bitcoin’s value is derived primarily from its network effects, its code, and investor belief in its future utility and adoption. While powerful, these are different underpinnings than the tangible reality of physical gold bullion held in a central bank's vault.
The actions of central banks speak volumes. While a handful of smaller nations or entities might experiment with Bitcoin, the overwhelming majority of major central banks, those that collectively manage the bulk of global reserves, have either remained silent on Bitcoin or have issued cautious warnings, all while steadily increasing their physical gold holdings. This isn't to say that Bitcoin has no future role or value. It may well continue to evolve as a speculative asset, a niche store of value for some, or a technology platform for new financial applications. However, the idea that it is poised to usurp gold's position in the vaults of central banks appears premature, if not fundamentally misguided, given its current attributes.
In conclusion, the debate between Bitcoin and gold as the preferred store of value and reserve asset has a clear, if perhaps unexciting, winner in the eyes of the world's central banks. Faced with geopolitical instability, the specter of dollar devaluation, and the enduring need for reliable safe-haven assets, these institutions are doubling down on gold. Its long history, proven stability, tangibility, and lack of counterparty risk resonate deeply with their conservative mandates. Bitcoin's volatility, regulatory ambiguity, and operational complexities, while potentially surmountable in the distant future, currently render it unsuitable for the core reserve holdings of nations. While U.S. investors and others may grapple with Bitcoin's risk-reward profile, central banks have largely made their choice, and that choice, for now and the foreseeable future, remains firmly with the ancient, trusted allure of gold.
Bitcoin Lines- What you can see if you remove Bars and replace them by Lines ?
- Congratulation, you just removed the noise in the chart.
- Everything is in graph.
- Covid19 Black Swan included.
- Not a price prediction.🤷♂️.
Happy Tr4Ding !


BTC - Why THIS TIME is DIFFERENT (⊙ˍ⊙)This time IS DIFFERENT. Bitcoin has made a new ATH as I predicted in a few previous posts, but something's off...🤔
If we look at BTC from a macro view, the dates for this run up was quite extended. We do see some similarities in terms of the retracement (highlighted in blue) but from a timeframe analysis, there is no comparing this high to the previous:
stretching from March to October where classical bear market symptoms were show - lower highs and lower lows, with a duration unlike any of the previous cycles.
Interestingly, the previous season we increased not even 7% from the previous peak. And if we were to look at the same fractal, that places us around $116k.
But the ONE thing, that has had me suspicious this entire time (🥁) was ETH. Overlaying the ETH chart, we see that historically, ETH peaked a week or two after the BTC ATH - until this time.
The fact that BTC made such a dramatic ATH and Ethereum didn't? That was a new one. And even up to now, ETH is still 80% away only from it's previous ATH - imagine the altseason we will have IF ETH makes a new ATH... or will this time just be , different ?

BTC UpdateLooking at historical data, we’re at a similar point as in 2021 — diverging RSI, declining volume, and signs of exhaustion. The key difference now is the level of institutional involvement: hedge funds are heavily in, MicroStrategy keeps buying, and even nation-states have exposure.
Despite the bullish narrative, I believe we’re heading down.
Price action isn’t convincing — we're still trading below the January monthly candle close, volume is drying up, and RSI continues to diverge. Each 5–10% pump is followed by a sharp spike in open interest (OI), then a brutal liquidation cascade wiping out $500M–$1B. This is starting to look like a leveraged casino, not a healthy uptrend.
That said, I wouldn’t rule out a final wick toward $120K to trap late longs and suck in liquidity before the real move down.
I called the top after the January rally — they called me a madman. Still, I was right.
Mastery tends to be a funny thing, seems like on a long enough timeframe you cant lose.
Stay safe everyone.

BTC perfect wick to wick symmetrical triangle - 109K or 98K You are looking at a 100% perfect wick to wick symmetrical triangle
Widest vertical range of the triangle from
Top wick: ~$105,700
Bottom wick: ~$100,700
Height = $5,000
Breakout level (horizontal mid-point of triangle):
Roughly $103,500 -104,000
Bullish Breakout Target:
$103,500 + $5,000 = $108,500
$104,00 + $5,000 = $109.000
108.5 to 109K will be your pure pattern target if BTC breaks to the upside with volume.
Bearish Breakdown Target: GETTEX:98K
FOR FUN I ASK CHAT GPT WHAT ARE THE ODDS WE BREAKOUT
Break Direction Target Confidence
Up (likely) $109,000 60–70%
Down (less likely) $98,000 10–15%

BTC | New ATH Incoming | + 135% ??A very interesting fractal from 2021 lead to a 135% increase - and a new all time high.
Bitcoin has been following similar patterns to the bullish twin-peaks in 2021. After a multi-month correction, the price proceeded to increase another 135% over the next few months. Some weeks fast, and some weeks sideways.
Is it possible that BTC follows a similar pattern - and increase another 135%, all the way to 170k?
Hec, I'd even be happy with just a 100% ! That would lead us up to around 149k, which can also be considered a phycological resistance zone.
While you're here! Check out this post on PEPE:
_________________
BINANCE:BTCUSDT

Bitcoin May 13, 20251. Trend Overview (Short- to Mid-Term)
• Bitcoin is in a strong uptrend, supported by the steep rise from ~84,000 to over 104,000.
• The price is currently in a consolidation zone near recent highs, indicating indecision but not yet weakness.
• The price is above all major moving averages (9 EMA, 20 SMA, 50 SMA, 200 SMA) — a classic bullish structure.
• However, the sharp angle of the short-term trendline shows the rally may be overextended and vulnerable to a pullback.
⸻
2. Price Action & Candle Pattern
• The recent small-bodied candles with long upper wicks show buying pressure weakening near 104,000 — a common sign of exhaustion or distribution.
• No strong bullish engulfing or reversal candles yet — currently a neutral-to-cautious stance.
⸻
3. Volume Analysis
• Volume has decreased during this sideways movement.
• This hints at buyer fatigue or waiting for a catalyst.
• Volume spikes were mostly seen on bullish candles earlier, showing strong buying interest earlier in the rally, but less so now.
4. Key Technical Levels
Resistance
104,000
Multiple rejections here; breakout level for bullish continuation
Support
102,100–102,800
Confluence of 9 EMA and rising trendline — make-or-break zone
Support
100,000
Psychological round number + recent base
Support
98,600
20 SMA support — deeper correction zone if trend breaks
⸻
5. Pattern and Risk Assessment
• A rising wedge pattern appears to be forming — typically bearish if confirmed.
• The uptrend is intact, but:
• A close below 102,100 on higher volume could trigger a short-term pullback toward 100,000 or 98,600.
• A close above 104,000 with volume would confirm bullish continuation.
⸻
Overall Conclusion
Bitcoin remains technically bullish, but it’s now at a critical decision point:
• As long as price stays above the 102,100–102,800 zone, bulls are in control.
• Watch volume closely — low volume favors pullback; high-volume breakout above 104,000 favors another leg higher.
• A rising wedge + weakening volume implies caution — partial profit-taking or tight stop-losses would be prudent for short-term traders.

BTCUSD , 1DPattern is looking very good , we can expect a very good move if the upper trendline will Break
wait until for the break of upper trendline
follow for more swing trade ideas

Bitcoin blows up the market: $100,000 broken.Bitcoin (BTCUSD) surged past the key $100,000 mark again on Thursday, May 8, 2025 — for the first time since February this year. During the day, BTC traded between $101,500 and $102,700, posting a daily gain of around 5.3%. Its market capitalization exceeded $2 trillion.
Why Bitcoin is back at $100K — and what’s driving it higher:
Macro tailwinds:
Growing expectations of Fed rate cuts , reinforced by Donald Trump’s calls for lower interest rates, have fueled risk appetite across markets — Bitcoin included.
US – UK trade deal hype : Hints of a potential trade agreement between the US and the UK announced by President Trump added a major boost to market sentiment, sparking a rally.
Institutional demand : Massive inflows into US spot Bitcoin ETFs continue. Over $1.8 billion flowed in last week alone, with some sources reporting $2.68 billion by Thursday — the largest weekly inflow since mid-December 2024. Companies like MicroStrategy are leading the charge with more BTC purchases.
Weaker dollar & falling bond yields : These trends have enhanced Bitcoin’s appeal as a hedge.
Market sentiment & BTC dominance : Breaking above $100K triggered optimism and possible FOMO (fear of missing out). Bitcoin’s market dominance now exceeds 60%, the highest since early 2021, reflecting investor preference for BTC over altcoins in the current phase.
The appointment of Paul Atkins as SEC Chair , along with a softer US regulatory stance and Arizona’s new pro-crypto law, are setting the stage for continued growth.
FreshForex analysts note that the current rally is mainly driven by institutional players, while retail investors have yet to fully engage.

Will it fall? Yes. The reasons are HERE!Reasons why it will drop:
1. hypurrscan.io
This is an insider — take a closer look.
2. Selling pressure during the first attempt to rise.
3. Selling pressure is still ongoing.
4. Very low liquidity ahead. It's easy to push the price down because the rise happened with almost no consolidation.
5. Whoever is applying pressure needs to accumulate cheaper.

Bitcoin BTC price analysis - READ the text !There was some positive news: "The US and China have agreed to reduce tariffs for 90 days."
The price of CRYPTOCAP:BTC has entered the zone of total sales - $105-110 thousand.
🕯 Metrics show that large wallets are now opening short positions worth hundreds of millions of dollars, and on the other hand, no less large wallets that organized this rebound in the OKX:BTCUSDT price are very tempted to launch the final stage of cascading liquidations of shorts.
🍿 So, stock up on popcorn - it's going to be "fun" today/tomorrow, and then we'll go to the stronger side!)
Globally, before the growth wave begins, we want to see the final "shake-up" of the longs who have survived everything and still held their positions and didn't give up.
1️⃣ Weak correction in the range of $90-91k - to close the GAP that formed on this rebound and then continue to confidently update ATH with a clear conscience.
2️⃣ A strong correction to the range of $80-82k - during which it will be very interesting to watch the capital flow and dominance.
Which scenario is closer to your heart? Write in the comments!
_____________________
Did you like our analysis? Leave a comment, like, and follow to get more

BITCOIN - Important Breakout (BoS)Hello Traders !
On Monday 5 May, The BTC reached the support level (92800 - 93500).
The price broke the higher high (Break of Structure).
So, I expect a new bullish move🚀
_______________
TARGET: 104000🎯

Btc alien technologyHello guys i was spot on before and i will continue be spot on 140k-160k FLUSH TO 40-42k maybe wick 38.5k
Thanks retail Waits for 20-30k and not happening Bye ✋
Then load up cause NeXT leg Will be historICAL
ADAPT OR DIE
CRYPTO IS THE FUTURE CURRENCY.
AI IS FUTURE TECHNOLOGY
WEB3 IS EXPANDING.

Bitcoin Struggles at the $95,000 BarrierIn today’s session, BTC has once again posted a decline of over 2%, as the previous bullish bias struggles to break through the $95,000 resistance level. The neutrality forming on the chart around this zone reflects the uncertainty in market sentiment, which is also evident in the Crypto Fear and Greed Index, currently oscillating in the neutral range at 45 points. The market appears to be watching closely for developments in the trade war and the Federal Reserve's interest rate decision on Wednesday before resuming the buying pressure that has driven BTC in recent weeks.
Short-Term Bullish Trend
Since April 9, a sustained bullish trend has been forming in BTC’s price, until momentum stalled near the $95,000 resistance zone. Prolonged price neutrality around this level may begin to slow the upward momentum that had been developing and lead to a consolidation phase. However, the long-term outlook still shows a clear dominance of buying interest.
Technical Indicators:
RSI: The RSI line approached the overbought zone near the 70 level, but has since begun to trend downward, suggesting that the recent buying momentum is weakening. This opens the door for potential short-term bearish corrections.
MACD: The MACD histogram is slowly approaching the zero line, which may indicate a balance of forces in the market. Furthermore, if a crossover between the MACD line and the signal line occurs in the short term, it could be interpreted as the start of a sustained bearish momentum that may affect upward price movements.
Key Levels to Watch:
$95,000 – Major Resistance: The most relevant resistance level for BTC, aligned with the 61.8% Fibonacci retracement. A breakout above this zone could confirm the strength of buying interest and pave the way for a more extended bullish trend.
$90,000 – Nearby Support: This level aligns with neutral consolidation areas from previous sessions and could serve as a short-term support in the face of potential pullbacks.
$86,500 – Key Support: This level is marked by the 50-period simple moving average. A drop to this level could break the short-term bullish structure and extend bearish momentum.
Written by Julian Pineda, CFA – Market Analyst

BTCUSDTLooks like BTCUSDT wants to make us smile again 🙂 A new opportunity for a Sell signal has emerged, and I’ll be taking advantage of it. However, don’t forget that in 35 minutes**, the *U.S. Services Purchasing Managers' Index (PMI)* data will be released — and that could cause some market volatility. I’m opening the trade with that in mind, so make sure you adjust your risk accordingly.
🔍 Criteria:
✔️ Timeframe: 15M
✔️ Risk-to-Reward Ratio: 1:1.60
✔️ Trade Direction: Sell
✔️ Entry Price: 94333.33
✔️ Take Profit: 93908.54
✔️ Stop Loss: 94598.39
🔔 Disclaimer: This is not financial advice. It's a trade I’m taking based on my own system, shared purely for educational purposes.
📌 If you're also interested in systematic and data-driven trading strategies:
💡 Don’t forget to follow the page and subscribe to stay updated on future analyses."

Ratio Charts in TradingView and IAAbove you can see the Bitcoin to Ethereum ratio chart. Ratio analysis between two or more symbols is a critical method for comparing the strength and weakness of assets relative to each other. TradingView offers basic capabilities for this task, but with the help of artificial intelligence (AI) and custom scripts, much more advanced and creative analyses can be conducted.
Here are some practical ideas:
1. Creating Conditional Ratio Scripts
2. Comparing Relative Averages and Issuing Smart Signals
3. Calculating Composite Ratios of Multiple Assets
4. Smart Alerts Based on Price Pattern Breakouts
For more information, search Google for "How to Use Ratio Charts in TradingView: A Hidden Gem for Traders."

BTC - NEW ATH on the HorizonBitcoin has surprised us with a sudden turnaround over the past two weeks.
✅ Technical indicators are bullish
✅ Candle stick patterns are bullish
✅ Trendlines are bullish
I can't help but come to any other conclusion - BTC is now BULLISH, likely making it's way to a new ATH.
This will bring about my much anticipated ALTSEASON:
_________________
BINANCE:BTCUSDT

Bullish Trend Continues upto 98KUnder current market conditions, the area near 93929 has been identified as a critical support zone, where the AI model detects a high-probability trade setup.
Suppose the market demonstrates increased volume and price stability above key moving averages in the 93929 area. In that case, traders are advised to monitor for trend-continuation entry opportunities in alignment with the prevailing momentum.
Profit targets are defined at 95764 and 98143, corresponding to logical technical resistance zones. These levels are designed for staged profit-taking across different trade management styles. Stop-loss should be strictly enforced at the designated level; once breached, the strategy is considered invalidated to limit potential downside.
BTC is trading within the equilibrium zone and..Bitcoin is now trading within my equilibrium zone. This will be one to watch for clues about the broader market, as it's currently leading the way.
Good luck, and always use a stop-loss!
