MARA HIGH PROBABILITY BUY SETUP SOON!!!🚨 MARA HIGH PROBABILITY BUY SETUP 🚨
* Here We Can See Clearly The Next Potential Moves For MARA Coming Hours/Days.
* Keep Your Eyes Close On Your Trading Positions.
* Happy PIP Hunting Traders.
FXKILLA.
Bitcon

BTCUSD – Strong Bounce + Double Rejection Zone AheadBitcoin gave a strong bounce from the ascending support trendline, the same place price reacted earlier.
This repeated reaction shows that buyers are actively protecting this area, creating a clear higher-low structure.
Now price is pushing back toward the major rejection zone marked on the chart — the same level where BTC got rejected twice (eye emojis).
This zone is not a random area; it’s a strong liquidity pocket where sellers previously dominated.
But this time the price is approaching with momentum, and the recovery candle is large and clean.
✨ My View
If BTC breaks above this rejection block with strength, I expect continuation toward the next expansion level.
Based on the structure and extension outlook, my expectation zone is:
🎯 Expectation Level: 96,300
Once this resistance zone is cleared, BTC normally moves quickly because there’s not much structure above it — it’s open space for momentum expansion.
The current trendline bounce + aggressive push makes this level realistic.
🔥 Why This Setup Stands Out
- Clean bounce from a strong diagonal support
- Two previous rejections at the same block → now acting as a breakout point
- Strong upside momentum
- No resistance between breakout level and expectation level
This combination often leads to a fast move.
📘 Disclaimer
This is only my personal market approach, not financial advice.

btcTwo important points seem to me: First, I think we are close to the time to buy and we should be ready to continue. But the second important point is that the red box has not yet allowed to break and has brought the price down. The red triangle area is in high demand, so we need to see if we can make a swing buy at the current prices.

BtcusdtI think Bitcoin will bounce from the 77-80K range and touch a new high in the 140K range.
If the 77K range breaks downwards, we should wait for the 60K range.

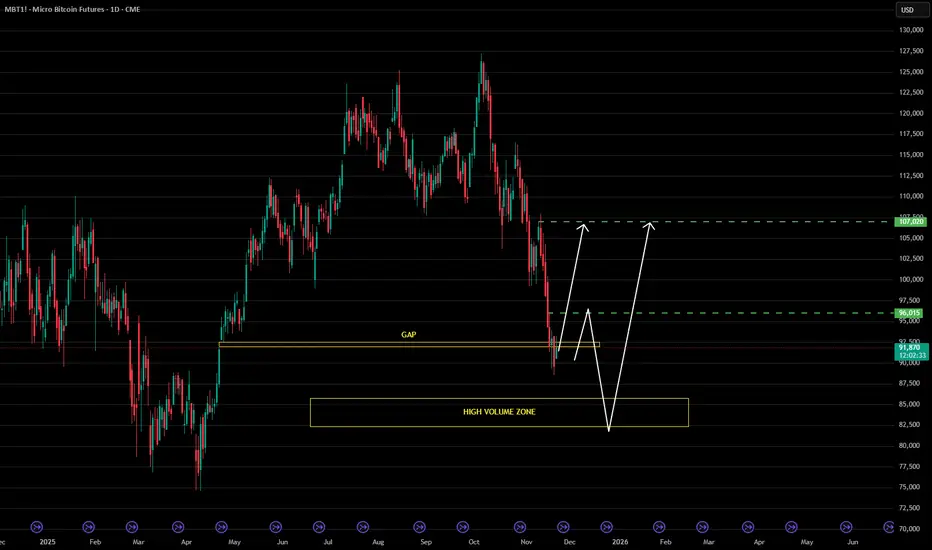
Bitcoin: Two Development Scenarios from Gap Closure ZoneCurrent Situation
Bitcoin has completed a sharp decline and is located in the critical gap closure zone. The chart shows two key technical elements: a resistance level in the upper part of the range and a high volume zone (HIGH VOLUME ZONE) significantly below current prices. Price has stopped precisely in the gap area, creating conditions for institutional players to make their decision.
Primary Scenario: Bounce from Gap Closure Zone
An immediate reversal upward from current levels is possible with subsequent movement toward key resistance. Gap closure often acts as a price magnet and correction completion point. If limit players are ready to defend this zone, a strong bounce is possible without testing lower levels.
Target Levels:
Movement toward the upper boundary of the range
Test of key resistance where price was previously stopped
Alternative Scenario: Test of High Volume Zone
Price may continue declining toward the high volume zone (HIGH VOLUME ZONE) located significantly lower. This area represents interest for forming a long-term reversal, as high volume concentration indicates institutional position accumulation. A more powerful and sustainable reversal upward is possible from here.
Key Levels of Alternative Scenario:
HIGH VOLUME ZONE — area for potential long-term reversal
Possibility of forming a strong base for upward movement
Trading Plan
For Primary Scenario:
Monitoring price reaction in current gap closure zone
Entry into long positions upon formation of reversal patterns
Target: movement toward key resistance
For Alternative Scenario:
Waiting for decline to high volume zone
Looking for signs of selling absorption in HIGH VOLUME ZONE
Entry into long positions with more aggressive risk/reward ratio
Risk Management
Primary scenario: stop-loss below gap closure zone accounting for possible false breakout
Alternative scenario: stop-loss below high volume zone with margin for stop liquidation
Recommended to split capital between two possible entry points
Bitcoin is painfully weakBitcoin ATH break at was the first sign of weakness, now relative strength index is at levels bitcoin hasn't been at since early 2023 - big difference in price $96k 3 years in a bull market vs $22k after the horrible painful 2022 bear market. I think 2026 will be bearish for bitcoin. Mid term elections will offer uncertainty and if you look at bitcoin's performance in 2025 under the "pro crypto" administration it has been painfully weak only up around 1% YTD. I think around $75k is a good area to watch. Full global economic meltdown like 2022 and Im looking at $48k region. COINBASE:BTCUSD

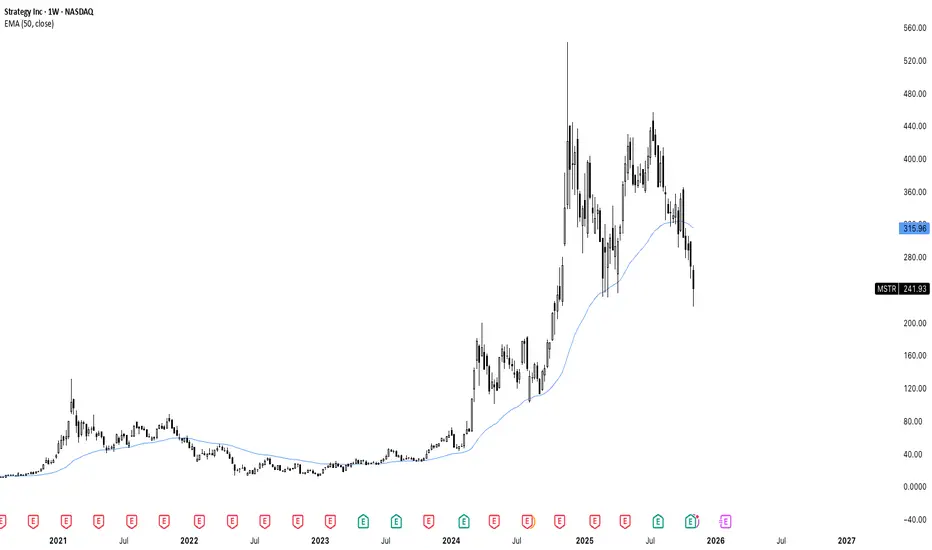
Microstrategy is who Satoshi warned us about. MSTR has broken below the 50 day moving average and is now at 52 weeks low. All while they hold the most bitcoin they ever have, now at 641,000 BTC. Some would even say they are trying to corner the market, using debt - while they claim they will never sell, but also they are not even earning any yield on their holdings. They will owe over $600 million in dividend payments next year. You simply can not create value out of thin air. NASDAQ:MSTR
IS CRYPTOCURRENCY BACK AT IT?Most cryptocurrency are at the range/point of reversal back to the top. With much anticipation and investment made we will be looking at a new ATH. This is followed by a tap into the monthly IRL especially for markets like BTC,ETH and others in line with a strike of reversal. We will hope to see further confirmations as there has been a 4hr market shift and a sweep above last Friday high gearing it down to a smart money support zone for an opportunity to buy, invest and HODL.
FOLLOW FOR MORE TIPS

BITCOIN (BTC/USD): Consolidates—Breakout or Breakdown Ahead?⚠️Bitcoin is currently consolidating following a significant bearish rally.
The price is coiling within a horizontal trading range on a 4-hour timeframe.
Based on the price's reaction to these boundaries, two potential scenarios are anticipated:
Bullish Scenario:
Should the price break and close above 104,640 on a 4-hour timeframe, a bullish trend continuation is expected.
The target for this scenario is 108,000.
Bearish Scenario:
Conversely, if the price drops and closes below 98,780 on the 4-hour timeframe, a bearish movement is anticipated.
The objective for this scenario is 96,000.
Given the current oversold market conditions, a bullish bias is held.
However, further observation is warranted to confirm the market's direction.
What are your expectations?

BTCUSDTHello Traders! 👋
What are your thoughts on BITCOIN?
Bitcoin has entered a corrective phase after reaching the top of its ascending channel and setting a new high.
The correction is still ongoing, and the price is now approaching a major support zone that aligns with the ascending trendline.
This correction is expected to extend toward the marked support area, where we anticipate a positive price reaction that could trigger a bullish reversal and lead to new highs.
In this region, traders can consider using the DCA strategy to accumulate long-term positions, as the overall market structure remains bullish.
Don’t forget to like and share your thoughts in the comments! ❤️

MicroStrategy - Mean ReversionAfter a choppy but still successful call on MSTR in Feb, we are back with another one. Heavily oversold and ready to shoot alongside $BTC.

Bitcoin Consolidates Within Symmetrical TriangleHi guys!
The chart illustrates a symmetrical triangle formation. This pattern typically signals a potential breakout scenario, though the direction must be confirmed by price action.
Key Technical Levels
Resistance Zone: Around $111,000 – $113,000, aligned with the top line of the symmetrical triangle.
Major Support: Defined by the bottom line of the triangle, currently holding near $107,000 – $108,000.
Breakout Target: Upon a confirmed breakout to the upside, the projected target for the triangle stands near $122,587, which aligns with a measured move from the pattern’s height.
Trading Plan
Bullish Scenario:
A breakout and close above the resistance zone ($111,500) would confirm bullish momentum. In this case, a long position could be considered, with the target around $122,500 as marked on the chart. This would also indicate renewed market strength and continuation toward higher levels.
Bearish Scenario:
If the price fails to break above the resistance and instead faces rejection, traders are advised to focus on short positions, anticipating a potential retracement toward the lower boundary of the triangle or even a breakdown below it. A close below the bottom trendline could signal deeper downside continuation.
Conclusion
Bitcoin is currently consolidating within a symmetrical triangle, reflecting indecision in the market. A confirmed breakout above resistance could trigger a bullish run toward $122,500, while rejection at this level would favor short setups. Traders should monitor the breakout area closely and wait for volume confirmation before committing to a position.

BitcoinBTCUSD
- Completed " 1234 " Impulsive Waves
- Break of Structure
- RSI - Divergence
- Bullish Channel as an corrective pattern in Short Time Frame
- Demand Zone

BTC/USDT: Bearish Drop to 108,500?BINANCE:BTCUSDT is signaling a bearish breakdown on the 1-hour chart , where price is trapped in a descending triangle formed by a downward trendline and an upward trendline, with increasing pressure at the convergence point near resistance—indicating potential for a downside continuation if sellers dominate. This classic pattern suggests weakening bullish momentum amid recent pullbacks.
Entry zone between 112,500-114,000 for a short position. Target at 108,500 near the support zone, offering a risk-reward ratio of 1:2 . 📊 Set a stop loss on a close above 114,500 to protect against an upside breakout. 🌟
Look for confirmation on a break below the entry with surging volume, capitalizing on Bitcoin's current choppy range.
Fundamentally , Bitcoin has seen high volatility recently, hitting new all-time highs above $125K earlier this month before dropping to around $105K, now stabilizing near $111K amid mixed macro signals and uncertainty from large holder movements. Additional catalysts include ancient wallet awakenings transferring billions in BTC and ongoing debates on tokenized gold versus Bitcoin's value. 💡
📝 Trade Plan:
✅ Entry Zone: $112,500 – $114,000 (short zone near resistance)
❌ Stop Loss: Close above $114,500
🎯 Target: $108,500 (major support area)
💎 Risk-to-Reward: Approx. 1:2 – clean, structured short setup within a bearish pattern.
What's your take on this setup? Drop your thoughts below! 👇

$BTC Update: Last Sunday, we discussed that Bitcoin could move CRYPTOCAP:BTC Update:
Last Sunday, we discussed that Bitcoin could move toward $115K, and after that, a pullback was expected. However, this week the market showed clear manipulation — Bitcoin jumped back to $114K, then dropped to $106K, reacting to a mix of news around China, Trump, and tariffs, along with other bullish and bearish headlines.
For now, Bitcoin has reclaimed the $110K support and is trading above it, showing some short-term strength.
If BTC continues to hold above $110K, the next resistance is near $113.5K, around the 1D 50 EMA, which remains the strongest hurdle for bulls. A clean breakout and hold above this zone could trigger a move toward $117K–$120K — that’s where I’ll be looking to add more shorts.
I’m still holding my previous short position with an average entry around $122K, and my plan is to add more if price reaches $115K–$117K. The overall structure remains bearish, and I’m waiting for clear direction.
Today’s CPI report will likely decide the next move:
If BTC pushes higher on the data, I’ll add to my shorts.
If it drops, I’ll continue holding.
The only time I’ll consider closing shorts is if Bitcoin breaks and resists below $100K.
#bitcoin

Bitcoin - Losing MA200 SupportBitcoin has just shown a technical warning sign — for the first time since April, 3 daily candles have closed below the 200-day moving average (MA200). This signals a potential shift in trend and raises the risk of a deeper correction.
⸻
🔹 Current View
• BTC is trading around $107,600, struggling to reclaim the MA200 (~$107,700).
• The price had been moving inside a purple rectangular range since July, consolidating between roughly $107K and $123K.
• On October 17th, BTC broke below that rectangular range, confirming a range breakdown and increasing bearish momentum.
• Both the 50 SMA and 100 SMA are now above price, adding downward pressure.
• The RSI sits near 38, showing weakening momentum and potential continuation to the downside.
⸻
🔹 Key Levels to Watch
• Immediate Resistance: $114,000–$115,000 (50 & 100 SMAs)
• Next Supports: $104,000 → $96,000 → $88,000
• A move toward $88,000 would align with the long-term trendline support and could form a strong accumulation zone before the next major rally.
⸻
🔹 Outlook
As long as BTC remains below the MA200 and outside the previous range, the short-term trend is bearish.
However, this correction could present a great buying opportunity for long-term investors once key supports are tested.
⸻
🧠 “Breaking below the MA200 and losing the range often signals weakness — but it’s where long-term setups are born.”
📜 Disclaimer : This is general information only and not financial advice. Always do your own research before investing.

BTCUSDTBTCUSDT price is in a correction phase, the price has a chance to test the 100412-99036 zone, if the price cannot break through the 99036 level, it is expected that the price will have a chance to rebound, consider buying the red zone.
🔥Trading futures, forex, CFDs and stocks carries a risk of loss.
Please consider carefully whether such trading is suitable for you.
>>GooD Luck 😊
❤️ Like and subscribe to never miss a new idea!

#BTC and #ETH: key levels to watch in coming weeksBTC
The recovery pattern from the September lows still looks more like a medium-term correction rather than the completion of the broader bullish cycle.
As long as the price holds above the macro support zone at 108–102K and does not close below the 50-week moving average for more than two consecutive weeks, I consider the macro uptrend intact and expect the correction to conclude in Q4.
However, while Bitcoin remains below 118K, another wave of selling toward the 108K area in the coming weeks cannot be ruled out before a potential new leg higher.
Chart (taken on Oct 12):
Short-term resistance zone: 115.5–118K
Macro support zone: 108–102K
⸻
ETH
The price has moved deeper into the macro support area highlighted in earlier reviews and reached key weekly moving averages (20SMA and 21EMA), which have historically provided support to every major growth cycle.
On the daily timeframe, as long as the price remains above 3290, the main scenario remains bullish — with potential for new highs in Q4.
Ideally, I would like to see ETH hold the 3840–3700 zone during the current recovery attempt and form a constructive consolidation above the 21/50-day moving averages.
If assets maintain their macro support zones, I expect Ethereum could once again outperform Bitcoin in the next phase of the uptrend.
Chart:
Short-term resistance zone: 4180–4360 / 4550
Local support zone: 3960–3700
⸻
In light of the historic liquidation event we witnessed last week, I’d like to share a quote from one of the veteran traders and original Market Wizards — Peter Brandt:
"Greetings crypto traders whose Friday was not a cheerful day. I need to tell you that there will be better tomorrows. While the tunnel may seen dark, there can be bright days in front of you depending upon how you respond to your present circumstances.
...
Wealth - real wealth that is secure and lasting - does not come from "bet the farm" speculative bets. Real wealth comes from accepting investing as a marathon, not a sprint.
Real wealth comes from controlling risk, not from taking huge gambles. Real wealth comes in the accumulation in small pieces, gained, then protected.
I love that the younger generation to which you belong has taken an interest in speculative markets such as crypto and futures. Welcome.
This is the arena I have operated in now in the 6th different decade starting in the 1970s.
I wiped out several accounts in the early days. These are not fond memories. But I kept at it. For me I learned how to control my risk. What does that mean exactly?
Well, for me it means to limit my risk on any given bet to no more than 1% of my total pot. I know that sounds too tame to be meaningful, but if you do not want to go through what you experienced this past week, then perhaps it should be meaningful.
It also means that I do not bet any more than 3% of my entire trading capital on the composite of highly correlated bets.
I have noticed that some in the crypto space wear as a badge of honor that they can sit through 80% drawdowns. Well, that is NOT a badge of honor. It is a crown of shame. Anyone who thinks lightly of 80% drawdowns will end up rekt at the end of the game. If you doubt me, then stay on your present course and find out.
...
So, I encourage you. Take this past week as a serious lesson of investing and of life. Take ownership of your mistakes. Don't blame this past week on some "whale" or manipulator. Own it. And move forward having learned some valuable lesson "
⸻
Thank you for your attention!
In times of heightened volatility, please remember - protecting your emotional capital is just as important as protecting your financial one. Stay disciplined, patient, and kind to yourself through market turbulence - it’s part of every trader’s journey toward mastery.
Let’s leave the past behind, take the lessons it offered, and focus on the next trade with a clear vision and renewed confidence.
Wishing everyone a strong and productive start to the new week!

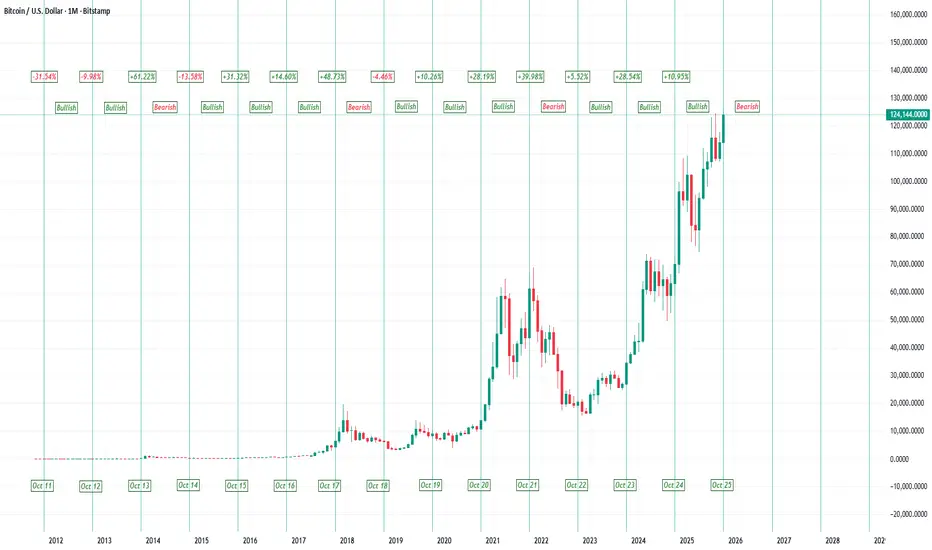
BTC: It’s October againOctober or Uptober (as they say) is a month wherein BTC has demonstrated a beautiful pattern over the course of its history. BTC’s return in October can be guessed depending on where the month falls in BTC’s well-known 4 year cycle.
The month of October that falls after BTC has peaked post-halving is expected to have negative returns as BTC remains in a bearish trend. While the remaining 3 months of October in BTC’s 4 year cycle are expected to have positive returns as BTC remains in a bullish trend.
As such, following months of October were bearish: Oct 2014, Oct 2018, Oct 2022. The remaining months of October had positive returns (except Oct 2011 & Oct 2012; which can be excused as very early months before BTC established a 4 year cycle).
Currently, in Oct 2025 BTC is expected to have a positive return as it is in a bullish post-halving trend. Based on the above facts and future expectations, traders can position themselves better to capitalize gains in their portfolios.
Good Luck!!
Bitcoin Btc usdt daily analysis
Time frame daily
Btc reached my target
It reached new high price last night about 125.000 $
I think btc will play in yellow box that you can watch in the chart and let other assets to grow up
Alt party has started

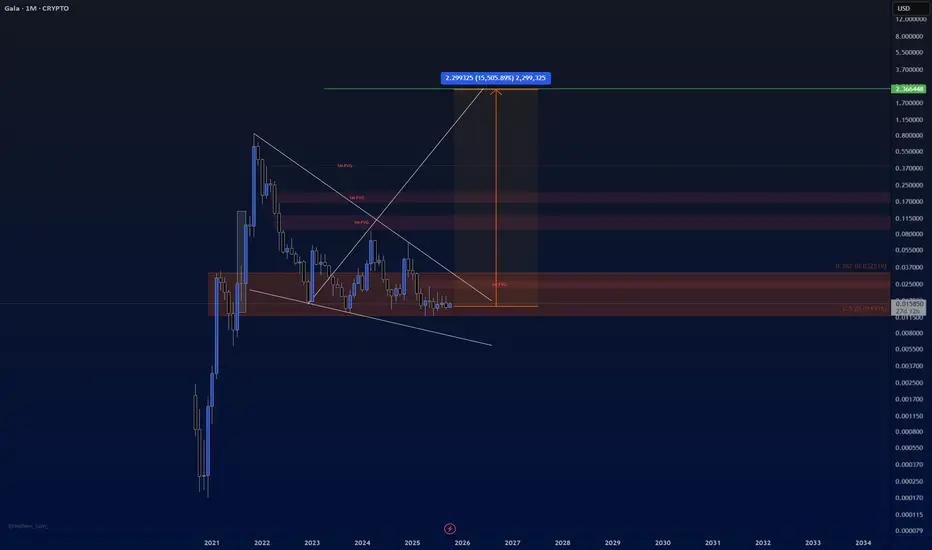
Gala To $2Gala the great crypto looks to be at great levels to purchase a huge load. We are aiming to break ATH and target $2 in 2026.
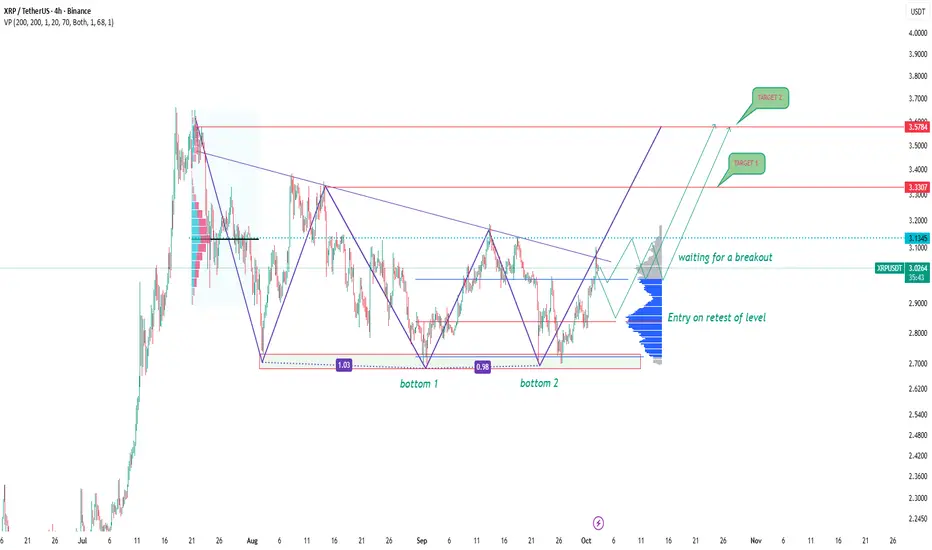
XRPUSDT: double bottom and waiting for a breakoutOn the 4H chart, XRPUSDT is shaping a double bottom around the 1.00 level, and the price is now approaching the key resistance area at 3.14–3.32. A breakout above this zone would be a strong confirmation that the bearish phase is losing momentum.
Technically, the scenario suggests a breakout above 3.14, followed by a retest, and then continuation toward 3.32 and 3.57. This fits the classic pattern where accumulation turns into momentum-driven buying.
From a fundamental perspective, XRP still draws attention thanks to Ripple’s legal battle with the SEC and the use of the token in cross-border transactions. Positive headlines can accelerate the rally, though broader crypto market corrections or regulatory pressure could put the brakes on growth.
This is exactly the kind of setup where expectations and reality may diverge. The structure looks bullish, but without a confirmed breakout, the market can easily roll back. Better to wait for confirmation and trade with discipline.
mrmoney limited BTC/USD swing trading ideaprice approached a key level of support zone on the weekly timeframe which is giving a buy signal
