USDCHF - Getting OverBought!📈USDCHF remains overall bullish in the medium term , but price is now approaching a major confluence resistance where caution is needed. The upper bound of the wedge pattern lines up perfectly with the red supply zone, an area that has rejected price multiple times in the past.
📉As USDCHF moves into this intersection, we will be looking for sell setups, expecting the bears to step in and defend this zone. A rejection from here could trigger a corrective move back toward the lower trendline and the green support zone.
Only a clean break and hold above the red zone would invalidate the bearish outlook and allow the bullish momentum to continue.
For now, sellers have the upper hand as we approach this key resistance… will they take control again? 🤔
⚠️ Disclaimer: This is not financial advice. Always do your own research and manage risk properly.
📚 Stick to your trading plan regarding entries, risk, and management.
Good luck! 🍀
All Strategies Are Good; If Managed Properly!
~Richard Nasr
Bitsgap

XAUUSD - Bulls Still Stepping In at Demand… Watching the Retest!Gold remains overall bullish, holding firmly above the major support zone around $4,000–$4,050. This entire red area has been acting as a strong demand zone for weeks, with price bouncing from it multiple times, a clear sign that buyers are defending this level aggressively.
📈XAUUSD is also respecting the rising trendline , forming a clean higher-low structure. As long as Gold remains above both the trendline and the support zone, the bullish outlook stays intact. I will be looking for long setups on the next retest of this confluence area.
🏹If buyers step in again, the next move could push toward the previous highs near $4,385. But if price breaks below the support zone and the trendline, the bullish structure would weaken and open the door for a deeper correction.
For now, this zone is the key. Will Gold bounce again… or finally break through support? 🤔
⚠️ Disclaimer: This is not financial advice. Always do your own research and manage risk properly.
📚 Stick to your trading plan regarding entries, risk, and management.
Good luck! 🍀
All Strategies Are Good; If Managed Properly!
~Richard Nasr

CADJPY - Overbought at Resistance… Correction Ahead?⚔️CADJPY is approaching a major rejection zone around 111.00 , which aligns perfectly with the upper bound of the rising channel. Price is also showing clear overbought behavior, making this area a critical decision point for the next move.
For now, the pair remains overall bullish, trading inside a clean ascending structure. However, the current location leaves CADJPY vulnerable to a corrective move as long as the 111.00 resistance continues to hold.
If the bulls manage to break and hold above 111.00, the momentum could extend toward higher highs. But if the resistance rejects price again, we can expect a move back toward the lower trendline of the channel to reset the structure.📉
The market is now at a key inflection zone… will 111.00 act as a ceiling or fuel the next breakout? 🤔
⚠️ Disclaimer: This is not financial advice. Always do your own research and manage risk properly.
📚 Stick to your trading plan regarding entries, risk, and management.
Good luck! 🍀
All Strategies Are Good; If Managed Properly!
~Richard Nasr.

USDCHF - Bulls Preparing to Defend the Zone!⚔️USDCHF is currently trading around a key intersection zone , where the rising trendline meets the major green support area.
This confluence makes it a high-interest zone for potential bullish reactions, as the pair has respected this structure multiple times in the past.
🏹As long as the support area holds, I’ll be looking for long setups, expecting the next impulse to push price back toward the upper bound of the ascending channel.
If the support breaks, however, the bullish outlook would weaken, so patience and confirmation are key here. ⚖️
⚠️ Disclaimer: This is not financial advice. Always do your own research and manage risk properly.
📊All Strategies Are Good; If Managed Properly!
~Richard Nasr

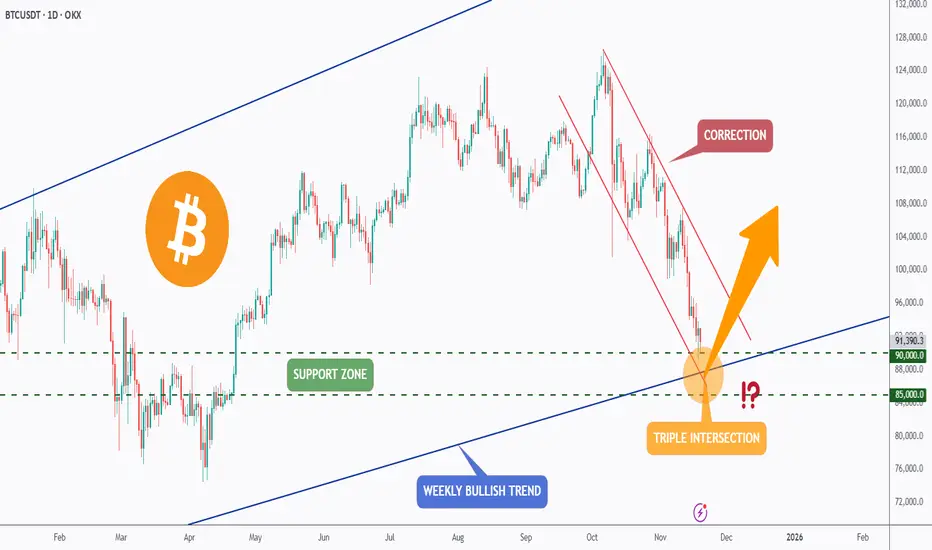
BTC - Triple Intersection… Now or Never for the Bulls?Bitcoin has been in a steep correction for weeks, sliding inside a clear falling channel. Despite the heavy sell-off, price is now approaching one of the strongest confluence zones on the entire chart, a triple intersection.
This key level combines:
1- The major weekly bullish trendline
2- The horizontal support between $85,000–$90,000
3- And the lower boundary of the falling corrective channel
This kind of alignment doesn’t happen often. It’s the area where long-term bulls typically show up.
As long as BTC holds above $85,000–$90,000, the macro bullish structure remains intact. A strong reaction here could trigger a reversal and kick off the next impulsive wave upward. However, if this triple confluence fails, the market may face a deeper correction before stabilising.
We’re standing at a decisive moment… will this zone ignite the next bullish leg or break down into another wave of fear? 🤔
⚠️ Disclaimer: This is not financial advice. Always do your own research and manage risk properly.
📚 Stick to your trading plan regarding entries, risk, and management.
Good luck! 🍀
All Strategies Are Good; If Managed Properly!
~Richard Nasr.
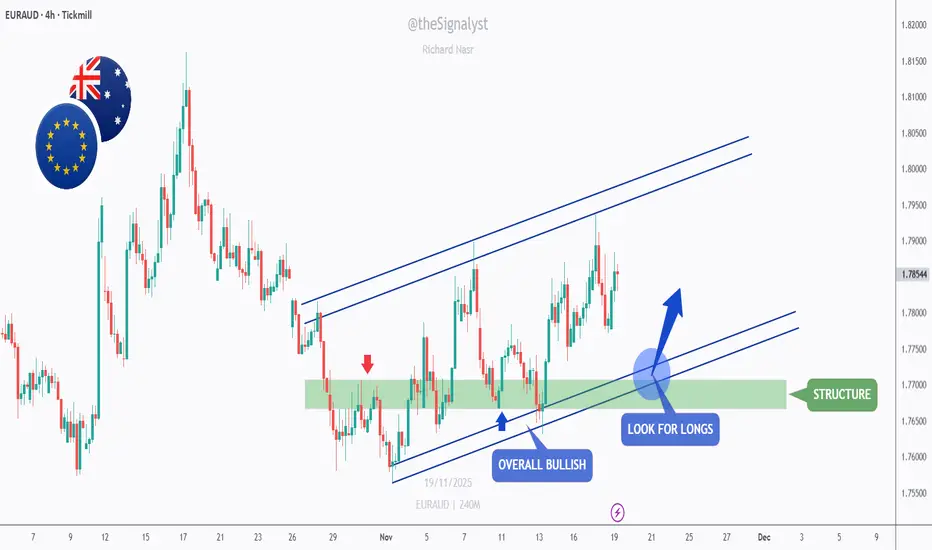
EURAUD - Bulls Still in Control… Waiting for the Next Retest!📈EURAUD continues to hold a clean bullish structure , trading inside an ascending channel while respecting the major support zone around 1.7650–1.7700.
⚔️This green zone has acted as a strong rejection area multiple times , showing clear buying pressure each time price dips into it.
As long as EURAUD remains above this structure, the bullish bias stays intact. I will be looking for longs on the next retest of the channel’s lower boundary, which aligns perfectly with the green demand zone - a powerful confluence area for trend-following entries.
🏹If the bulls manage to defend this zone once again, the next wave upward toward the upper boundary of the channel becomes the most likely scenario. But if price breaks below the structure, the bullish outlook would weaken.
We’re now waiting for the market to make the next move… will the bulls step in again at support? 🤔
⚠️ Disclaimer: This is not financial advice. Always do your own research and manage risk properly.
📚 Stick to your trading plan regarding entries, risk, and management.
Good luck! 🍀
All Strategies Are Good; If Managed Properly!
~Richard Nasr.
FET - Bulls Preparing for a Comeback?FET has completed a clean correction after its previous strong impulse move, retracing all the way back into the support zone around 0.23–0.28, which has been acting as a key demand area for weeks.
Price bounced from that zone and is now attempting to reclaim structure, signaling that buyers might be preparing to take control again.
For now, the market structure is simple:
Impulse upward ➝ Correction ➝ Potential new impulse.
If the bulls manage to hold above the orange zone and break the descending correction trendline, the next impulsive leg toward 0.50 becomes the most likely scenario.
However, if FET breaks back below 0.23, the bullish setup would fail and deeper downside would be expected.
We are now at the stage where the market decides whether the bulls fully take over… or if this bounce is just a pause before another dip. 🤔
⚠️ Disclaimer: This is not financial advice. Always do your own research and manage risk properly.
📚 Stick to your trading plan regarding entries, risk, and management.
Good luck! 🍀
All Strategies Are Good; If Managed Properly!
~Richard Nasr.

BTC & USDT.D - Who Follows Who?The eternal question in crypto, does Bitcoin lead USDT.D, or does USDT.D dictate Bitcoin’s moves?
At the moment, both charts are approaching critical inflection points.
CRYPTOCAP:BTC is retesting the $90,000 support, while CRYPTOCAP:USDT.D is nearing the 6.4% resistance.
As long as BTC holds above $90K and/or USDT.D remains capped below 6.4%, the bulls can still take over, paving the way for another impulsive rally across the crypto market.
But if these levels break… we may be in for a deeper correction before the next leg up.
So, who will make the first move? 🧩
⚠️ Disclaimer: This is not financial advice. Always do your own research and manage risk properly.
📊All Strategies Are Good; If Managed Properly!
~Richard Nasr

Bitcoin - The Calm Before the Next Wave?📉Bitcoin has entered yet another correction phase within its long-term rising channel, following the same rhythm we’ve seen in previous cycles.
Each major correction (highlighted in red) has historically been followed by a strong bullish impulsive move from the lower blue trendline, and this time, price is once again testing that key structural support.
🔁If history repeats itself, this could be the final retest before a major rally toward the upper boundary of the channel, potentially aligning with the next cycle’s exponential phase.
Will Bitcoin bounce from this level one more time, or is a deeper correction still on the table? 👀
⚠️ Disclaimer: This is not financial advice. Always do your own research and manage risk properly.
📊All Strategies Are Good; If Managed Properly!
~Richard Nasr

ICP - After a 250% Explosion, What’s Next?🚀ICP has just witnessed a massive parabolic rally , surging by over 250% in just a few days, an incredible move that pushed the price into overextended territory.
📉Now, after such a vertical climb, a healthy correction is unfolding. The area highlighted in red represents a major demand zone, where previous consolidation took place before the explosive breakout.
🏹As price retraces toward this zone, I’ll be looking for potential long opportunities, expecting buyers to step back in and push ICP higher, possibly toward new local highs in the coming weeks.
Could this correction be the perfect reload before the next leg up? 🔥
⚠️ Disclaimer: This is not financial advice. Always do your own research and manage risk properly.
📊All Strategies Are Good; If Managed Properly!
~Richard Nasr
