ETH – Correction in play, patience matters hereETH did exactly what we were expecting.
Price got rejected from the upper bound of the wedge, and that rejection triggered the correction phase.
Now the focus shifts lower.
As long as ETH holds the lower bound of the wedge, which also aligns nicely with the demand zone, the overall bullish structure remains intact.
I’ll be patiently waiting for trend-following long setups from support, once the market shows clear rejection.
Let the setup come to you...
⚠️ Disclaimer: This is not financial advice. Always do your own research and manage risk properly.
📚 Stick to your trading plan regarding entries, risk, and management.
Good luck! 🍀
All Strategies Are Good; If Managed Properly!
~Richard Nasr
Blockchain

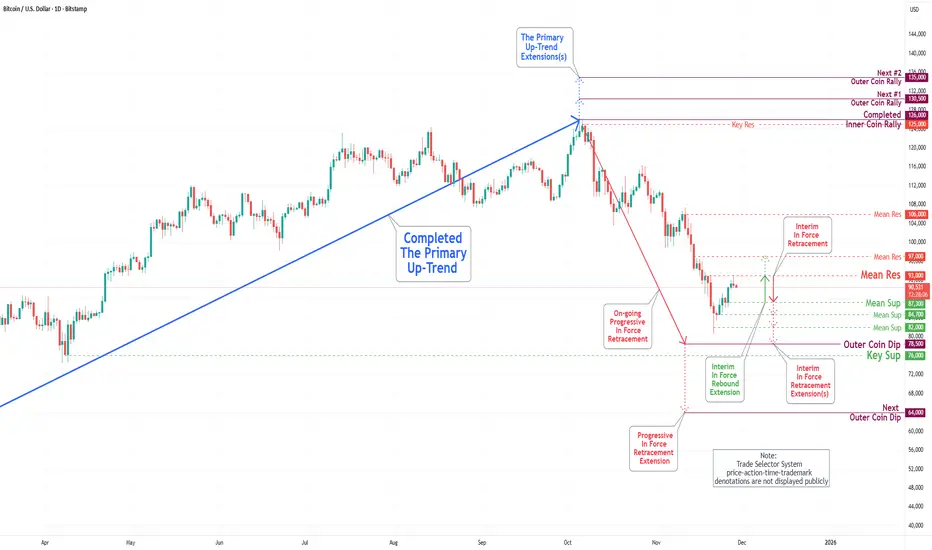
Bitcoin(BTC/USD) Daily Chart Analysis For Week of Jan 16, 2026Technical Analysis and Outlook:
This week’s trading activity has concentrated on completing the Interim Inner Coin Rally, successfully reaching a target price of 98,000. Following this completion, the market experienced an immediate pivot.
The principal downside target is identified at Mean Support, positioned at 94,200, which has been partially attained. Given the prevailing dynamics in the Bitcoin market, traders need to monitor price movements diligently.
A prominent drawdown sentiment is currently exerting downward pressure, and should the initial support level be breached, a further decline to the Mean Support level of 90,500 will be the primary target.
On the upside, there is a conceivable intermediate rebound scenario from the previously mentioned support levels, with the primary objective being a retest of the completed Interim Inner Coin Rally at 98,000.

ETH - is it time for a correction?ETH is starting to look over-bought.
Price is currently hovering around a strong intersection between the orange supply zone and the upper red trendlines. This is not just any resistance, it’s a zone where momentum has historically cooled off.
As long as this area holds, a bearish correction is expected, with price likely rotating back toward the lower blue trendlines, where buyers previously stepped in.
This doesn’t change the bigger picture... it’s simply a reset within structure.
⚠️ Disclaimer: This is not financial advice. Always do your own research and manage risk properly.
📚 Stick to your trading plan regarding entries, risk, and management.
Good luck! 🍀
All Strategies Are Good; If Managed Properly!
~Richard Nasr

Bitcoin(BTC/USD) Daily Chart Analysis For Week of Jan 9, 2026Technical Analysis and Outlook:
This week's trading activity in the Bitcoin market has focused on completing the Interim Inner Coin Rally at a target price of 98,000. However, the market pivoted from the Mean Resistance level at 93,500, validating its strength by establishing a new Mean Resistance level at 94,000. Conversely, the primary downside target for strong support is identified at 87,000, which may be attained should the Mean Support at 89,500 be breached.
Given the prevailing dynamics in the cryptocurrency market, it is essential for traders to monitor price movements closely. A significant bearish sentiment is exerting downward pressure on prices, with the possibility for an Outer Coin Dip to be reached at 78,500. Additional support levels are indicated at 84,500 and 81,500, further underscoring the need for vigilance in trading strategies.

Bitcoin(BTC/USD) Daily Chart Analysis For Week of Jan 2, 2026Technical Analysis and Outlook:
In this New Year's trading week, the Bitcoin market has climbed towards the upper end of our Active Inner Trading Zone (See Daily Chart Analysis For Week of Dec 26, 2025). This breakout from his progressive zone will be met by Mean Resistance at 93,500.
Given the prevailing dynamics in the cryptocurrency market, it is recommended that traders diligently monitor this price movement, as significant momentum is pushing prices toward the Interim Inner Coin Rally at 98,000 and the possibility of advancing to a subsequent Interim Coin Rally at 102,500.
On the downside, the principal target, identified for some time, is the Outer Coin Dip at 78,500, which might be realized once the Mean Resistance 93,500 is hit, along with the Interim Coin Rally at 102,500.

ETH - the Calm before the Storm!From a structure point of view, ETH remains bullish, trading cleanly inside a flat rising channel.
The lower bound of the channel continues to act as support, keeping the broader bullish bias intact.
🔑 The key level to watch is the red structure zone.
For the bulls to truly take over and push price toward the upper bound of the channel, we need a clear break and hold above that structure. That’s the trigger that shifts ETH from consolidation into expansion.
Until then, expect chop and buildup... not weakness.
⚠️ Disclaimer: This is not financial advice. Always do your own research and manage risk properly.
📚 Stick to your trading plan regarding entries, risk, and management.
Good luck! 🍀
All Strategies Are Good; If Managed Properly!
~Richard Nasr

Bitcoin(BTC/USD) Daily Chart Analysis For Week of Dec 26, 2025Technical Analysis and Outlook:
The Bitcoin market has traded within a narrow range in the Active Inner Trading Zone during the current holiday season. This progressive zone is characterized by a Mean Resistance level of 90,500 and a Mean Support level of 84,500.
Given the prevailing dynamics in the cryptocurrency market, it is recommended that traders diligently monitor price movements in this Active Trading Zone. A breakout on the upside from this range may lead to vital targets, including an Interim Inner Coin Rally at 98,000, and a subsequent Interim Coin Rally at 102,500. However, it is important to acknowledge that these targets will encounter resistance at the Mean Resistance level of 93,500 before being attained.
On the downside, the principal target, identified for some time, is the Outer Coin Dip at 78,500. This target will be supported by significant backing from the Mean Support level of 82,500, which is situated below the Active Trading Zone’s Mean Support level of 84,500.

Ascending triangle in playAscending triangle is building its third wave. Watching for breakout back towards the yearly high.
Very Bullish

ETH Holds Support - Bulls Still in Play!?📈ETH has been trading within a rising broadening wedge pattern.
⚔️This week, price rejected the lower boundary of the structure.
🏹As long as the wedge remains intact, and ETH holds above the last major low at $2,750, a bullish continuation toward the upper boundary of the wedge remains the favored scenario.
⚠️ Disclaimer: This is not financial advice. Always do your own research and manage risk properly.
📚 Stick to your trading plan regarding entries, risk, and management.
Good luck! 🍀
All Strategies Are Good; If Managed Properly!
~Richard Nasr

Bitcoin(BTC/USD) Daily Chart Analysis For Week of Dec 19, 2025Technical Analysis and Outlook:
The Bitcoin market in this week's trading session continued to trade within an Active Inner Trading Zone defined by the Mean Resistance level at 93,500 and the Mean Support level at 89,300.
Given the current dynamics of the cryptocurrency market, it is advisable for traders to monitor price action in this Active Trading Zone closely. A breakout may lead to additional targets, including an Interim Inner Coin Rally at 98,000 and a subsequent Interim Coin Rally at 102,500. Conversely, on the downside, the established Mean Support levels are situated at 84,700 and 82,500, with the prospect of an Outer Coin Dip occurring at 78,500.

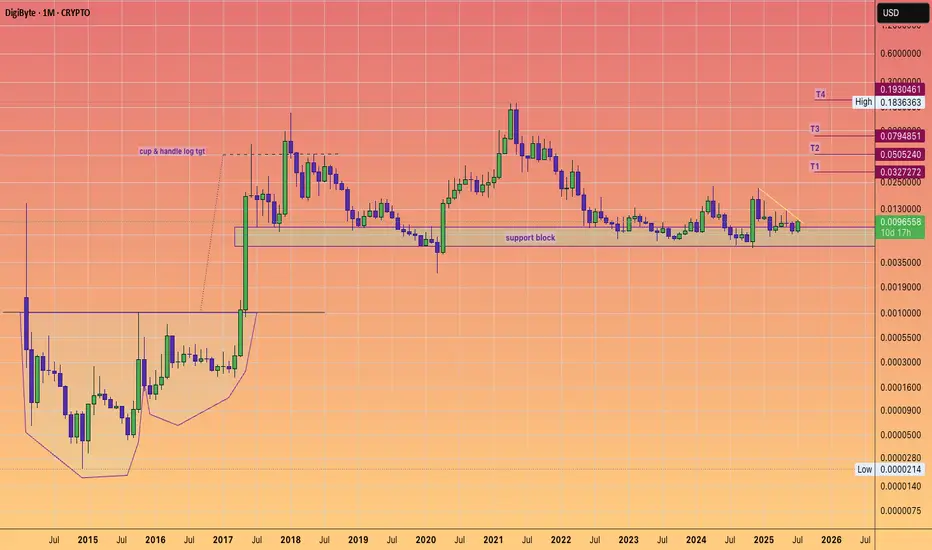
Digibyte $DGB Breakout watch. Bullish surge ahead?Digibyte appears to be reawakening, and a long accumulation phase appears to be ending.
If we scroll back to the beginning of the chart we can see the massive cup and handle and the subsequent moonshot to 5 cents.
I think 5 cents will also come back into play, in these coming weeks and months a healthy 5X.
As we know technically Digibyte is known for speed and decentralisation and UNDERvaluation.
Their much loyal supporter base deserve another moon mission.
Blockchain Payments - Circle ready to make a line play higher?Growing Revenue, blockchain payment solutions gaining traction...Is NYSE:CRCL looking to make a move to the upside?
Our systems have identified a point of potential interest & volatility in CRCL.
If price can hold above $75.55 ... Significant Bullish potential may be unlocked.
If however price falls below $75.55 ... Significant Bearish risk may come into play.
Although momentum may currently be to the downside...Is this about to change?
We're inspired to bring you the latest developments across worldwide markets, helping you look in the right place, at the right time.
Thanks for reading! Stay tuned for further updates, and we look forward to being of service along your trading & investing journey...
Disclaimer: Please note all information contained within this post and all other Bullfinder-official Tradingview content is strictly for informational purposes only and is not intended to be investment advice. Please DYOR & Consult your licensed financial advisors before acting on any information contained within this post, or any other Bullfinder-official TV content.

ADA – Downtrend Dominates, Risk of Deeper PullbackHello everyone,
On the chart, the downtrend remains clearly intact, with a persistent sequence of lower highs and lower lows extending from October to the present. Price is trading entirely below EMA34 and EMA89, both of which are sharply sloping downward. This confirms that sellers continue to control the market, with no meaningful signs of exhaustion so far.
Throughout November and December, all rebound attempts have been weak, short-lived, and repeatedly rejected around the EMA34 near the 0.45 USD area. This behavior suggests that buying pressure is purely technical in nature and insufficient to form a reversal structure. At the moment, ADA is hovering around the nearby support zone of 0.37–0.39 USD. However, the current D1 candle structure — small bodies, short lower wicks, and declining volume — indicates fading momentum, a pattern that often precedes a breakdown of support.
From an EMA perspective, the widening gap between price and EMA34 (0.452) as well as EMA89 (0.560) further confirms that the downtrend is expanding rather than contracting. To shift the market’s bias, ADA would need at least a daily close above 0.45 USD. At this stage, there are no early signals supporting such a scenario. Volume has continued to dry up over recent weeks and is concentrated mainly on bearish candles, implying a lack of fresh inflows, while sellers still require relatively little pressure to push prices lower.
Based on the current technical picture, the highest-probability scenario remains a breakdown below the 0.37–0.38 support zone, followed by an extension of the decline toward deeper support around 0.30–0.33 USD. This area represents a significant liquidity zone that previously acted as a major support, where price could eventually see a technical bounce or begin forming a new accumulation base. Until ADA approaches that region, there is still insufficient evidence to expect a genuine trend reversal.
Wishing you all a successful trading day!

Bitcoin(BTC/USD) Daily Chart Analysis For Week of Dec 12, 2025Technical Analysis and Outlook:
During the most recent trading session, the Bitcoin market navigated within a channel defined by the Mean Resistance level at 93,500 and the Mean Support level at 89,300.
Current market sentiment suggests an upward move, with price action pointing to a retest of the Mean Resistance level at 93,500. Additional targets include the Interim Inner Coin Rally at 98,000 and a subsequent, significant objective: the next Interim Coin Rally at 102,500.
Given the prevailing dynamics of the cryptocurrency market, there exists a potential for an intermediate pullback to the Mean Support level of 89,300. This pullback could extend to further Mean Support levels at 86,400 and 82,400, ultimately culminating in the anticipated Outer Coin Dip at 78,500 before a notable upward momentum is expected to occur.

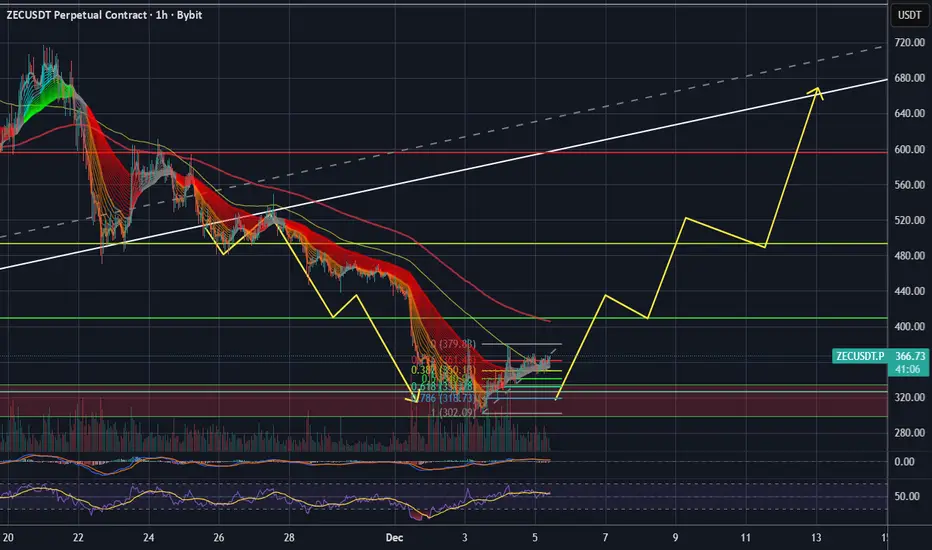
ZEC - From Exhaustion to Expansion!!!📉ZEC spent days trapped in a clear bearish phase on the left side of the chart, forming lower lows and lower highs. But everything changed once price tapped the major swing low, where buyers stepped in aggressively.
📈Since then, ZEC has been respecting a new rising channel , shifting the market structure from bearish to bullish. As long as price remains inside this channel, the bulls remain in control.
We will be looking for longs around the intersection of:
- the lower blue trendline, and
- the most recent higher-low zone
🏹This is where buyers have consistently reacted before, and where the next bullish impulse could start.
If this structure holds, ZEC may push toward the upper boundary of the channel once again.
Do you think ZEC is gearing up for another leg up? Let me know below 👇
⚠️ Disclaimer: This is not financial advice. Always do your own research and manage risk properly.
📚 Stick to your trading plan regarding entries, risk, and management.
Good luck! 🍀
All Strategies Are Good; If Managed Properly!
~Richard Nasr

Bitcoin(BTC/USD) Daily Chart Analysis For Week of Dec 5, 2025Technical Analysis and Outlook:
In the most recent trading session, the Bitcoin market experienced a Pump-and-Dump scenario and continued the downward trend observed over the past week. The price has reached the Mean Resistance level of 93,500.
Market sentiment is declining, with current price action focusing on identifying the Mean Support level at 88,000. Additional support is identified at 84,500, with a further significant drop possible to the Outer Coin Dip at 78,500.
Given the current dynamics of the crypto market, there is potential for an intermediate rebound from the Mean Support level of 88,000 back up to the Mean Resistance level of 93,500. Furthermore, an external extension may target the Interm Inner Coin Rally at 98,000.

Time for XRP?CRYPTOCAP:XRP ➖ Time for XRP?
I checked CoinMarketCap and saw the coin is currently ranked 6th in searches, so I got curious about what's going on with it.
Like every other coin, it dropped hard together with the market on Monday and triggered a ton of trader stop losses.
Looking at the liquidation heatmap, there is still room for upside along with Bitcoin. Basically this will just be a corrective bounce before we head even lower. We'll wipe out the shorts first and then drill a new bottom.
➖ Entry around $2.0210 with a target of $2.3700, good for roughly +17%.
Unless aliens and reptilians don't step in and mess with this little XRP bounce of course 🦖👽.

SOL reversal⚡ SOL/USDT – 1H Reversal Heating Up
BYBIT:SOLUSDT.P holding strong above $136–$138 support — EMA ribbon flipped green and momentum’s curling up.
If bulls defend this level, next leg targets $150 → $160+.
Break below $132 invalidates short-term setup.
“Golden pocket bounce. Calm before the breakout.” ⚙️

ZEC Golden Zone Reversal⚡ ZEC/USDT – The Golden 0.618 Reversal Zone?
BYBIT:ZECUSDT.P just tapped the 0.618 Fib around $326, right inside a strong support zone — classic golden pocket territory. 👀
The setup’s screaming potential reversal:
- RSI: Bullish divergence forming.
- MACD: Losing bearish momentum.
- EMA Ribbon: Flattening on 4H = trend shift brewing.
If bulls can reclaim $410–$490, I’m eyeing a push toward $650+.
Below $320, though — game over, next stop $207.
“Golden pocket bounces are where legends are born… or wrecked.” 💀➡️🚀
XYZ(BLOCK) HIGH PROBAIBILITY LONG SETUP SOON!!!🚨 XYZ HIGH PROBABILITY BUY SETUP 🚨
* Here We Can See Clearly The Next Potential Moves For BLOCK Coming Hours/Days.
* Keep Your Eyes Close On Your Trading Positions.
* Happy PIP Hunting Traders.
FXKILLA.

ETH - Bulls Waiting at the Intersection Zone!📈ETH remains overall bullish, moving steadily inside its rising channel. Every dip toward the lower bound has acted as a clean continuation point for the next push upward.
🏹As price pulls back , we will be looking for long setups once ETH retests the intersection of the lower trendline and the demand zone. This confluence area has been respected multiple times, making it a high-probability level for trend-following entries.
⚔️As long as ETH holds above this orange zone, the bullish structure remains intact, and the next impulse toward the upper channel boundary becomes the most likely scenario. Only a break below the demand zone would weaken the bullish outlook.
Now we wait for the retest… then let the structure guide the entries. 🤔
⚠️ Disclaimer: This is not financial advice. Always do your own research and manage risk properly.
📚 Stick to your trading plan regarding entries, risk, and management.
Good luck! 🍀
All Strategies Are Good; If Managed Properly!
~Richard Nasr

Bitcoin(BTC/USD) Daily Chart Analysis For Week of Nov 28, 2025Technical Analysis and Outlook:
During the most recent trading session, the Bitcoin market exhibited a resilient rebound, continuing a trend observed over the past week. The price has reached the Mean Resistance level of 93,000.
Market sentiment is in declining mode, and the price is likely to trend toward the Mean Support level at 87,300. Current trading activities are focused on identifying the next Outer Coin Dip, projected at 78,500, with additional obstacle support at the Mean Support levels of 84,700.
Given the prevailing trading dynamics, there is potential for an intermediate rebound from the Mean Support level of 87,300 to the Mean Resistance level of 93,000. Furthermore, an external extension may occur as the cryptocurrency market continues to fluctuate in line with current shaky market sentiment. Notably, it is essential to acknowledge the potential for a significant rebound once the Outer Coin Dip target of 88,500 is achieved.
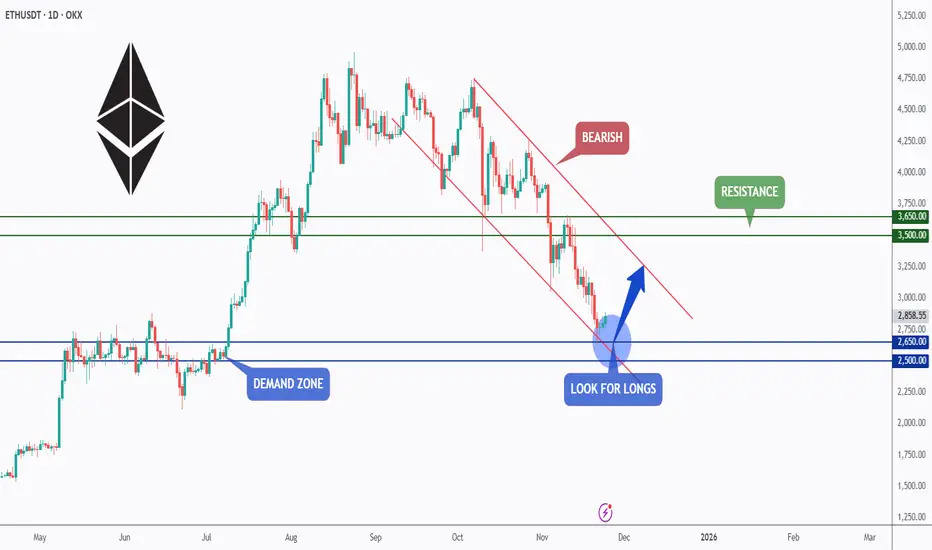
ETH - Demand Zone Meets Channel Support… Correction Loading?⚔️ETH is currently trading around a major demand zone, which lines up perfectly with the lower bound of the falling channel. This intersection forms a strong confluence area where buyers typically step in to absorb the selling pressure.
🏹As long as ETH holds above the $2,500–$2,650 zone, we will be looking for long setups, anticipating a big corrective move toward the upper bound of the falling channel. This would align with the natural rhythm of impulse → correction inside a bearish channel.
If the bulls manage to defend this area, the next targets sit around $3,500–$3,650, which represent the next key resistance levels. However, a break below the demand zone would invalidate the bullish correction setup and open the door for further downside.
ETH is now at a decisive point… will the demand zone trigger the next corrective leg upward? 🤔
⚠️ Disclaimer: This is not financial advice. Always do your own research and manage risk properly.
📚 Stick to your trading plan regarding entries, risk, and management.
Good luck! 🍀
All Strategies Are Good; If Managed Properly!
~Richard Nasr