BMT has prepared up to 400% growth In this review, I will consider in detail the BMT, which I previously took into account. First of all, it is worth noting the issue of this token. At the moment, 50% of tokens have already been unlocked and further issuance is slowing down, which will not put significant pressure on the price. For the next year, the 0.0250 level will remain the main support from which attempts will be made to gain a foothold above 0.05. A very important signal is the opening of the half-year above 0.125, which may lead to a sharp reversal of the half-year candle up to this level. If low volatility persists, the range of 0.100-125 will remain a medium-term target for retest and will be worked out, but with a possible pullback. On a smaller scale, the second half of the quarter opened above 0.0250, which is a signal for a test of 0.050-75. As a result, there is a fairly high probability of an attempt to close the current monthly candle above 0.05, with the trend continuing in the new month. After a local break in the 0.075-90 region, there is a high probability of a rollback to a 0.05 retest followed by an attempt to resume growth.
TURTLE MITO VIC NTRN ENSO CHESS HOOK has a similar growth potential today.
BMT

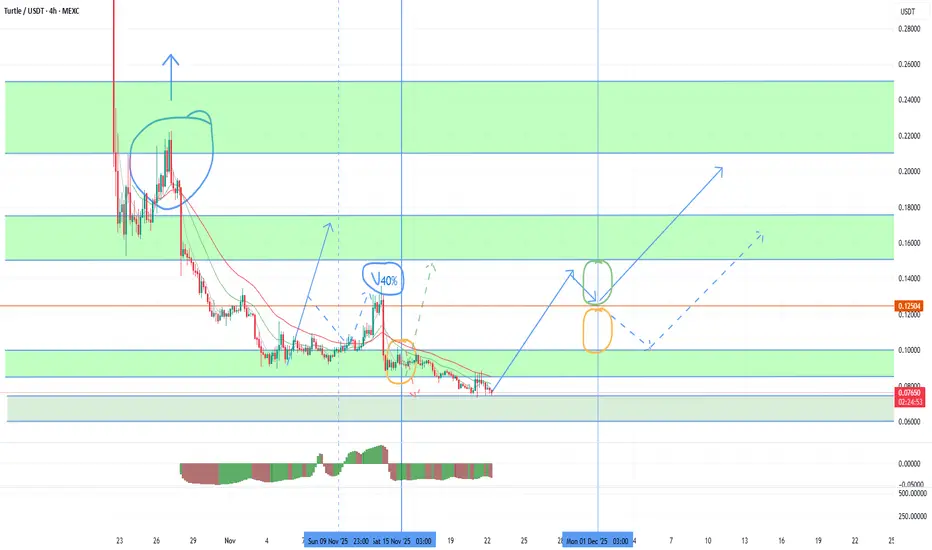
A new wave of growth up to 200%+ for TURTLEAgainst the background of an attempt to reverse the quarter, today there is a new opportunity to make money on TURTLE. Among the recent binance listings, this token is in the most oversold position and is preparing for a powerful growth wave to work out strong technical signals for a retest of 0.21-25 at least and up to 0.5 with a steadily growing market. After the last publication, a wave of growth was expected to retest the nearest resistance of 0.125, which was successfully broken through with a local break. The fall of ETH to the 2600 test was the reason for the disruption of the TURTLE trend, which I warned about, but it provided an excellent opportunity for additional scalping. In the new growth wave, there is a high probability of stable consolidation above 0.125 with tests of the next target range of 0.150-175. The second half of the quarter opened above 0.09, which also gives a signal for a stable exit above 0.1. With sufficient volatility, the current monthly candle will turn bullish with continued growth in the first half of the new month. Among the recent listings, MITO and BMT also have great growth potential with growth targets of up to 300-400%.
I am also considering older VIC HOOK CHESS projects with strong growth signals of up to 200%+.
Also, new growth waves of up to 50-70% can give UTK COS DATA QUICK FIO, which I recommend working with for fewer lots due to the threat of adding the monitoring tag.
Opportunities for market growth at the end of the yearToday we have reached a new major bifurcation point in the middle of the quarter, which I have focused on. For individual coins, starting in the middle of this week, the probability of a bullish quarterly candle reversal with large growth waves will increase, similar to RESOLV and TNSR. Such reversals will be facilitated by a slowdown in the fall of ETH with attempts to change the trend before the end of the year.
So far, the bearish influence has prevailed in the market, with the opening of most major periods below key resistances and stable sales until the middle of the quarter to consolidate below 3,500, which I will indicate in the latest review. The ultimate goal of the bears in this quarter is to test the range of 2500-2750, with an attempt to close the annual candle in it under a negative scenario, and against the background of consolidation below 3500, this goal is still relevant. By the end of the month, we may still see new sales impulses to break through 2750, but with increasing buying activity at the end of each week, against which individual coins will try to grow. The second half of the quarter for ETH opened below 3,250, which gives a signal for sales below 3,000 up to 2,500, but an opening above 3,100 is a technical signal for growth up to 3,500-4,100. The attempt to reverse the quarterly candle is also facilitated by its opening above 4,100.
And so, under an optimistic scenario and a stable transition to a reversal of the quarterly candle in the second half of the week, purchases can be expected until the end of the week, with the aim of opening a new week above 3250, which will ensure continued growth until the end of the month and the possibility of opening a new month with a growth signal before the end of the year. With less volatility, there is a chance of opening a new week below 3,100, which could lead to a reversal next week.
As I wrote in a review at the beginning of October, BTC opened the quarter negatively, with a pullback signal down to 90-100 k, which the bears successfully worked out. There is a large medium-term support in the 85-90k zone, from which a pullback is likely. In addition to the growth of the altcoin index and the growth of ETH/BTC, which I expect at the turn of the quarter, the slowdown in the decline of BTC will also cease to put pressure on the market and allow individual coins to show major reversals.
Brent may once again have quite a big impact on the markets. If today and tomorrow the price fixes above $ 64 and, moreover, above $ 65, then the probability of growth of the crypt will prevail until the close of the week. In the event of US manipulation and a sudden new wave of brent sales below $62.5 today or tomorrow, there will be a chance for an ETH reversal before the weekend. Given the released data on stocks in the United States, the probability of a positive scenario prevails. All markets are connected, and no matter how absurd it may seem at first glance, it was the background manipulation of the commodity price that allowed the bears to break through key supports on ETH more than once, both on October 10 at 4,100, and at the subsequent 3,500, 3,250 and 3,100. By superimposing the dynamics of brent in the second half of the week on the dynamics of ETH by the weekend, you can see a chain reaction. That is why by the second half of October, I predicted a drop down to 3,500 by the end of the week, in the event of a drawdown of brent to $ 60.
Against the background of a slowdown in the fall of ETH and attempts to reverse the quarter, it is possible to make regular toppings for individual coins. First of all, it is worth paying attention to TURTLE and MITO, which have strong technical signals for growth up to 0.21-25 in the medium term. So the potential is the ground for dynamics similar to RESOLV. VIC BMT HOOK CHESS also has slightly weaker technical signals for growth, which I am also considering working with in the first place. On an attempt to reverse the quarter, there is a high probability of their growth to 50-70%, at least with the aim of breaking the last monthly candle. In the case of a stable ETH reversal, growth impulses of up to 200%+ can be expected.
Similarly, growth waves of up to 40-50% may show weaker instruments that do not have obvious signals, but are in an extremely oversold zone, such as QUICK COS FIO DATA. In my opinion, these tools are candidates for the assignment of the monitoring tag, given the dynamics, and therefore I recommend using a small position when working with them.
In addition to the positive note towards the end of the year that has appeared at the moment, I would like to focus on the overall negative dynamics of the market, which may continue at the beginning of the year. The current likely pullback on the quarterly and annual candles is still a temporary phenomenon and gives opportunities to coins that have technical growth signals left earlier. Most of the market, after attempts to roll back the tops at the turn of the year, is likely to continue falling until the second quarter. That is, coins without obvious growth signals, especially those with large capitalization, may remain flat until January or February without significant purchases followed by a major break.

Up to 150% on TURTLEToday, against the background of the general market pullback, new options are being formed for medium-term investments and scalping on coins recently added to binance. I would like to draw attention to TURTLE, which has reached probable medium-term support in the range of 0.085-100. With the current issue from this range, the probability of a price reversal prevails for at least a retest of large purchase volumes around 0.21. Today, the first investments have already been made to reverse the trend, more stable purchases can be expected in the second half of this week with the consolidation of ETH above 3,100. Also, as you pass through the middle of the quarter, there is a high probability of an attempt to reverse the quarterly candle both for the tops and for individual coins. A test of the lower support of 0.060-75 for TURTLE is possible only with an additional drawdown of ETH to the test of 2500-2600, which is less likely so far. From this range, a rapid price recovery above 0.1 is likely, which will serve as a good opportunity for additional scalping in addition to the main position. In case of a successful reversal of ETH from 3100-3250 to the 4100 retest on TURTLE, there is a fairly high probability of testing the range of 0.21-25.
The MITO VIC BMT HOOK has also reached levels for a new trend reversal attempt, which I am also considering working on. They can be used to top up in addition to the main position to take a reversal attempt up to 30-60%.
ADX and PIVX, which I recommended earlier, have performed well, but I am not considering them for further work, since the target levels for them have been worked out and it is possible to add the monitoring tag further.

Further market dynamicsTo date, the market has fully fulfilled its targets at the 3500 retest against the background of brent leaving below 64. Further, until the second half of Sunday, the probability of purchases up to the 4500 retest prevails. An important guideline for further dynamics will be the opening level of the new week and the second half of the month. If these periods open at least above 4,100, the probability of a flat and maintaining the market with the possibility of a breakout next month will remain. With weak purchase dynamics, there is a chance of opening the second half of the month below 4,100. In this case, in any case, we will see purchases before the end of the month for a pullback on the monthly candle, but then the market will consolidate around 3500. The available technical signals currently outweigh the bullish scenario. In this case, individual coins will turn the current month into a bullish one with significant interruptions.
The main contenders for this month's move are MITO VIC BMT HOOK, which are highly unlikely to be contenders for the monitoring tag and are more suitable for medium-term investments. It is also possible to consider scalping in the short term CHESS FIO COS QUICK DATA, which have reached supports and can show a deeper drawdown only when the ether falls below 3500. A signal has been left for a move to the ADX, however, there is a possibility of a deeper drawdown to 0.075-85 before the reversal.

Following PIVX, we take the X's on the HOOKAs I have already written, you should not try to jump on the departed train on pivx, which I recommended for purchase for more than a month, it is better to consider the options where the X's are just being prepared. First of all, they include CHESS HOOK BMT MITO VIC.
Consider the position of the HOOK. After listing on binance, the token left several strong technical signals for a retest up to 0-50-75, which is highly likely to lead to a major growth wave. The growth momentum last week was only the first investment in the upcoming trend. An uptrend line has been formed and there is a high probability of an attempt to consolidate above it before the end of this month. The quarter opened in a mixed zone, an opening above 0.09 gives a signal for growth up to 0.15, however, an opening below 0.1 is likely to give pullbacks in the event of a sharp increase. The main long-term support for the current issue is the 0.0750-850 range, from which there was a rebound after a long-term rebidding. A hike below this range is likely only with an additional significant drawdown of ETH. The most likely target is an attempt to close the current monthly candle above 0.21-21 in order to continue the trend in the new month. With negative overall market dynamics, there is a possibility of a pullback from 0.21-25. In this case, in the new month, we can expect a new attempt to return to the trend line from 0.110-125, which will provide an additional opportunity for scalping.

BMT/USDT – Major Rebound Potential from Accumulation Zone?🔍 Overview
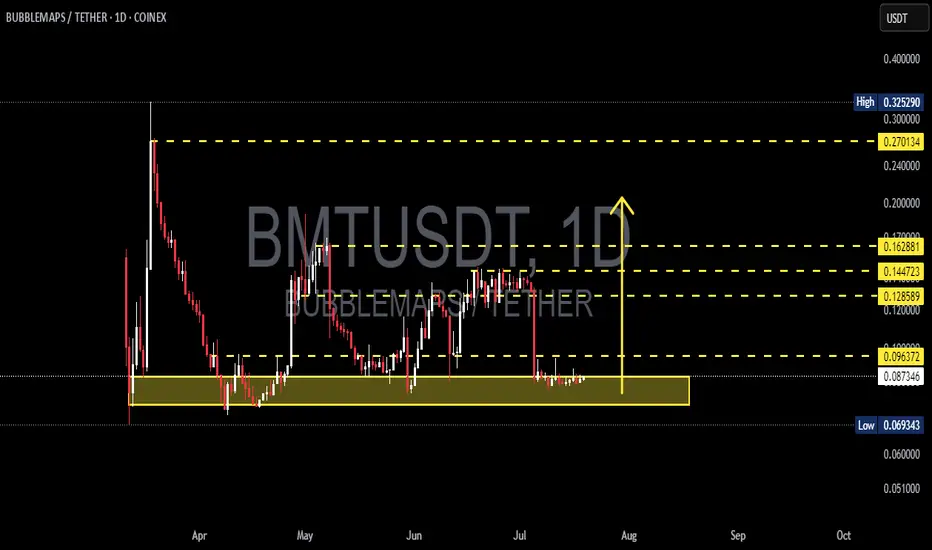
BMT/USDT is currently trading at a critical support zone after a prolonged downtrend from the local peak at 0.32529. The 0.075 – 0.083 range, highlighted in yellow, has acted as a strong price defense area from March to August 2025.
The structure indicates a potential reversal pattern if the price can break above key resistance levels.
---
📈 Pattern & Technical Structure
Main Pattern: Potential Double Bottom or Accumulation Base on the daily chart.
Key Support:
Accumulation zone: 0.07500 – 0.08277
Final support: 0.06934 (lowest price of the year)
Layered Resistance Levels:
R1: 0.09637 → First psychological resistance
R2: 0.12859 → Short-term profit-taking area
R3: 0.14472 → Mid-term resistance
R4: 0.16288 → Major resistance before a strong rally
R5: 0.27013 → Long-term bullish target
---
🚀 Bullish Scenario
If the price breaks and sustains above 0.09637 with significant volume:
Short-term target: 0.12859 (+55% from current price)
Mid-term target: 0.14472 – 0.16288 (+74% to +96%)
Long-term major breakout target: 0.27013 (+226%)
Additional Confirmation:
RSI climbs above 50 and continues to strengthen
MACD forms a golden cross
Gradual increase in buying volume
---
⚠️ Bearish Scenario
If the price fails to hold above 0.075 and breaks 0.06934:
Potential downside targets:
S1: 0.06500 (-21%)
S2: 0.05700 (-31%)
Additional Confirmation:
Surge in selling volume
Daily candlestick closes below 0.06934
RSI breakdown below 40
---
🎯 Strategy & Risk Management
Buy at Support Strategy:
Entry at 0.082 – 0.083, SL below 0.06934, Target 0.12859 → Risk:Reward ± 3.4
Breakout Buy Strategy:
Entry after daily close above 0.09637, SL below 0.082, Target 0.14472 → Risk:Reward ± 2.24
---
📌 Conclusion
BMT/USDT is at a make-or-break zone: a successful breakout could trigger a strong rally, while a breakdown would extend the bearish trend. This is a decision point for swing and position traders to monitor closely.
#BMTUSDT #CryptoAnalysis #Altcoins #TechnicalAnalysis #PriceAction #Crypto #BreakoutTrading #SupportResistance #CryptoSignal #AltcoinSeason

BMT/USDT Rebounding from Strong Demand Zone Is a Major Breakout?🧠 Complete and Insightful Technical Analysis:
The daily chart of BMT/USDT reveals a compelling structure for traders looking to capitalize on early-stage reversals and bottom entries. The price is currently consolidating within a strong historical demand zone, ranging between $0.069 – $0.087 USDT — a level that has previously triggered multiple significant rallies (March, May, July 2025).
This isn’t just any support zone; it's a classic accumulation area, where bearish momentum appears to be fading and buyers are gradually stepping in.
🔍 Identified Chart Patterns:
✅ Accumulation Range – Sideways movement within the highlighted yellow box suggests a potential base formation.
✅ Double Bottom (W Formation) Potential – A break above resistance would confirm this bullish pattern.
✅ Wyckoff Spring Setup – If a fake breakdown below support occurs followed by a swift recovery, it could signal a powerful trend reversal.
🚀 Bullish Scenario (Reversal in Play):
If the price continues to hold above the $0.069 support, it sets the stage for a strong bullish reversal. A confirmed breakout above $0.096 with high volume would validate the bullish thesis.
📈 Upside Targets:
TP1: $0.096 USDT – Local resistance
TP2: $0.128 USDT – Previous key equilibrium zone
TP3: $0.144 - $0.162 USDT – Historical resistance
TP4: $0.270 - $0.290 USDT – Major range top
This structure provides the potential for a +200% upside move if momentum builds and resistance levels are broken sequentially.
⚠️ Bearish Scenario (Breakdown Risk):
If the price fails to hold above the demand zone and closes below $0.069, the bearish outlook takes precedence:
The next support sits at $0.063
A breakdown below this may lead to price discovery lower with strong downside pressure
👉 Caution is advised: use tight risk management if trading within this range.
🔑 Key Takeaways:
The yellow box is a critical battleground between bulls and bears.
Holding this demand zone could ignite a strong breakout.
The risk/reward setup is favorable for swing and trend traders.
A confirmed breakout could signal the start of a new bullish phase.
📊 Additional Chart Stats:
Current Price: ~$0.075 USDT
Support Zone: $0.069 - $0.087
Key Resistance Levels: $0.096 / $0.128 / $0.144 / $0.162 / $0.270
Market Structure: Sideways → Accumulation → Breakout Potential
#BMTUSDT #CryptoTrading #BreakoutSetup #WyckoffMethod #AltcoinAnalysis #SupportAndResistance #SwingTradeOpportunity #CryptoReversal
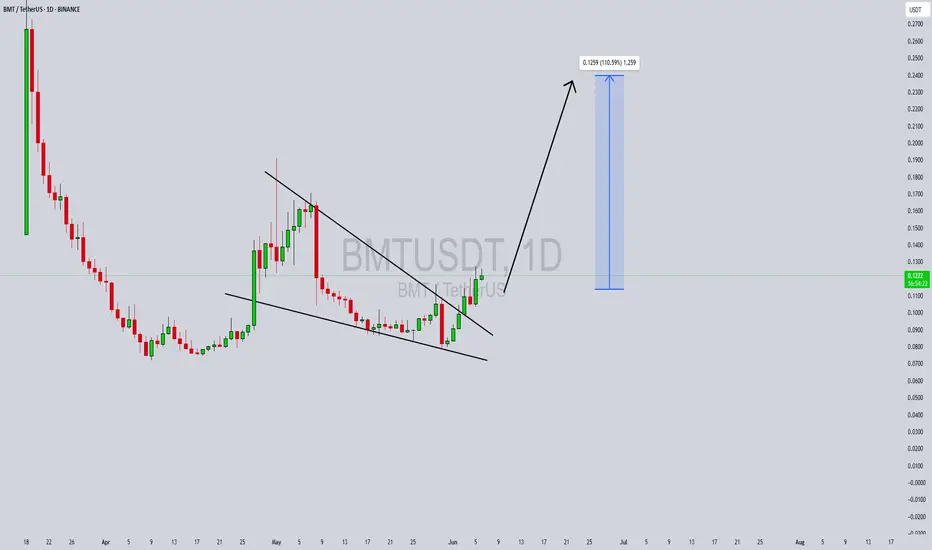
BMTUSDT Forming a Bearish TriangleBMTUSDT is currently forming a bearish triangle pattern on the chart, which typically signals potential downward continuation. However, what makes this setup intriguing is the price's strong resilience around a key support level and signs of accumulation within the pattern. The volume remains steady, which could indicate growing investor interest despite the bearish appearance. This could set the stage for an unexpected breakout in the opposite direction, potentially flipping the market sentiment and leading to a sharp rally.
While the triangle suggests caution, seasoned traders understand that breakouts from such patterns—especially in altcoins—can lead to explosive moves when combined with strong volume and market interest. BMTUSDT is now in a critical zone, and if buyers step in with conviction, we could see a reversal and surge of 90% to 100% or more, targeting higher resistance zones. These setups often surprise the market, especially when retail sentiment is overly bearish.
This crypto project is also gaining attention due to its increasing presence across social platforms and crypto communities. As altcoin season gradually gains momentum, coins like BMTUSDT with technical breakout potential and active trading volumes become prime candidates for short-term gains. Watching for a clean breakout above the triangle resistance could provide the perfect entry for momentum traders.
In conclusion, BMTUSDT is worth monitoring closely. It offers a unique scenario where technical bearishness could be overturned by investor accumulation and a possible trend reversal. A confirmed breakout with volume could trigger a powerful upside move that catches many off guard.
✅ Show your support by hitting the like button and
✅ Leaving a comment below! (What is You opinion about this Coin)
Your feedback and engagement keep me inspired to share more insightful market analysis with you!
BMT Rebuy Setup (4H)After the heavy drop in BMT, the price is now approaching demand zones.
If it reaches the green zone, we can consider entering a buy position there.
Risk and capital management should not be forgotten.
Targets are marked on the chart. A daily candle closing below the invalidation level will invalidate this analysis.
For risk management, please don't forget stop loss and capital management
When we reach the first target, save some profit and then change the stop to entry
Comment if you have any questions
Thank You

BMT is a rockt ! (2H)It seems that a double bottom is forming, the previous bottom has been preserved, and an order block has formed, which has been broken to the upside. Additionally, a key level passes through this area.
On the chart, we also have a bullish CH (Change of Character). If the trigger line is broken, it will provide further confirmation for a bullish move.
As long as the demand zone holds, the price can move toward the targets.
However, the closure of a 4-hour candle below the invalidation level would invalidate this analysis.
Do not enter the position without capital management and stop setting
Comment if you have any questions
thank you

BMT rebuy setup (4H)Given the momentum drop, lack of reaction to hourly support zones, and candlestick formation, it is recommended that if you're looking for a rebuy on BMT, you should wait for a setup in the demand zone at the lower part of the chart.
It seems we have a large triangle, with wave D likely to end in the green zone.
After buying, once you're 20% in profit, start scaling out gradually and break even.
A daily candle closing below the invalidation level will invalidate our buy outlook.
For risk management, please don't forget stop loss and capital management
Comment if you have any questions
Thank You


voxel longBlack Mountain Analytical Team:
Hello
Due to the lack of money, our analysis may not be correct. But I did not want to miss it.
But I have presented two scenarios in the chart.
This currency is also in the range of its static support.
As we can see in the RSI indicator the upward trend line.
just that
