BOOK OF MEME · Leverage vs Spot · Should I Plan or Not?With the log chart we can focus on growth potential, the all-time high, highs and lows, the bigger picture, the chart structure and long-term cycles.
With the linear chart, we can know the truth of a pair. Are we looking at a cycle top or bottom prices?
BOMEUSDT (BOOK OF MEME) is bullish based on current price action and trading volume.
Looking at this linear chart, it is easy to see BOME consolidating sideways after hitting bottom. It is easy to see a major cycle (left), a major crash and then the market going sideways.
If I were to show a log chart, the action after February would be really pronounced and you would see lots of bullish and bearish moves. These are indeed happening but are minimum—small—compared to how the market actually moves. Market noise.
If I were to focus on the short-term, I would have to become Nostradamus in order to be able to predict the next move.
If I focus on the long-term as I usually do, I can easily predict what is going to happen next.
As a group, we cannot beat the market because we are the market; but, there is no need to "beat" the market, we only need to make money and there are many ways to make money; choose what works for you. We choose low risk vs a high potential for reward.
We choose simplicity and a strategy that works. Literally, just buy and hold.
I understand leverage (margin) and I use it of course, but I cannot cry if I incur a major loss. I cannot cry, blame and complain if things go wrong; why? Because before making the first purchase, the first move; before making a decision or any trade, the first thing to consider, adapt and accept, is the fact that all money can be gone in a flash, that's the thing about leverage trades. If things go right, you get to win big but, if things go wrong, you get to lose everything... Not really, if you control your position size your risk is limited.
Ok. Asymmetric risk/reward. Maximum 5% out of the risky trading capital goes on a single trade. It can be 3% or even 2% or 1%.
If you can't make money slow, you won't be able to make it fast. Making money is an art and trading is the same. It is a craft, a profession, a job, a career; call it what you want, but it takes effort, and, since there are so many smart people doing the same, we have to be smart when we decide to participate.
How can I be smart when trading?
Build a plan before taking action.
I love you. I am literally feeling true love right now as I write this, I hope it reaches you.
Thanks a lot for your continued support, it is appreciated.
Namaste.
Bookofmeme

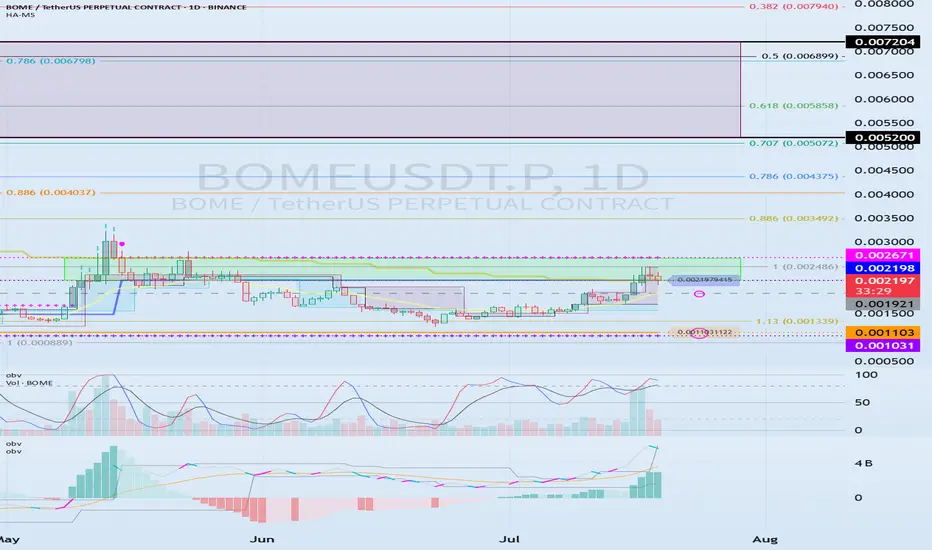
0.002198-0.002671 The key is whether it can break above
Hello, traders.
If you "Follow", you can always get new information quickly.
Have a nice day today.
-------------------------------------
(BOMEUSDT.P 1D chart)
BOME is a BOOK OF MEME, which is a meme coin and belongs to the Solana Ecosystem.
If the price breaks through the 0.002198-0.002671 section upward and maintains, it is expected to rise to around 0.005200-0.007204.
As a condition for this,
- The K of the StochRSI indicator should show an upward trend with K > D below the overbought section.
- The PVT-MACD oscillator indicator should show an upward trend. (If possible, it should be above the 0 point.)
- The OBV indicator of the Low Line ~ High Line channel should show an upward trend. (If possible, it should be above the High Line. It should maintain a state where at least OBV > OBV EMA.)
When the above conditions are met, if the 0.002198-0.002671 section breaks through upward, it is expected to continue the upward trend.
If not and it falls, you should check if it is supported near 0.001921.
This is because I think that the upward trend can continue if it receives support near the 0.001921 point, which is the volume profile section.
Therefore, if it falls below 0.001921, you should stop trading and watch the situation.
You can trade with a SHORT position in futures trading, but since it falls below the volume profile section, you should be aware of the volatility.
Therefore, if you insist on trading, a short and quick response is required.
-
(15m chart)
The trading method is simple.
Buy near DOM(-60) ~ HA-Low, and sell near HA-High ~ DOM(60).
However, if it falls from DOM(-60) ~ HA-Low, it is likely to show a stepwise downtrend, and if it rises from HA-High ~ DOM(60), it is likely to show a stepwise uptrend.
Therefore, you should maximize your profits by taking a split transaction format.
Other indicators can be used as points where you can conduct split transactions depending on the situation.
That is, sell about 25% at the support and resistance points drawn on the 1M, 1W, and 1D charts, and sell about 10% at the support and resistance points on the 15m chart to maximize your profits.
While conducting transactions in this manner, you may wonder if you can actually drag the transaction to around 0.005200-0.007204, but it is possible.
It is good to hold to make a big profit, but since the current price range is in the support and resistance range, I think it is an unstable range to just hold.
-
Thank you for reading to the end. Wishing you a successful trade.
--------------------------------------------------
BOMEUSDT - Targeting a 200% UpsideBOME/USDT has been quietly consolidating on the hourly chart, showing signs of building a strong base for a potential breakout. This calm phase often precedes significant moves, and the current setup looks like an opportunity to capture a major rally.
Why This Trade?
Consolidation Zone: The price has been stabilizing within a narrow range, suggesting that sellers are losing momentum, and a breakout could be imminent.
Volume Dynamics: While volumes remain steady, any uptick in activity could signal the beginning of a new bullish phase.
Risk-Reward Balance: With a target of +200%, this trade offers an excellent potential reward for calculated risk.
This setup is not about rushing into the market but about positioning strategically for the next big move. As always, patience and discipline will be key to letting the trade play out successfully. Let’s see how BOME performs! 🚀
dyor

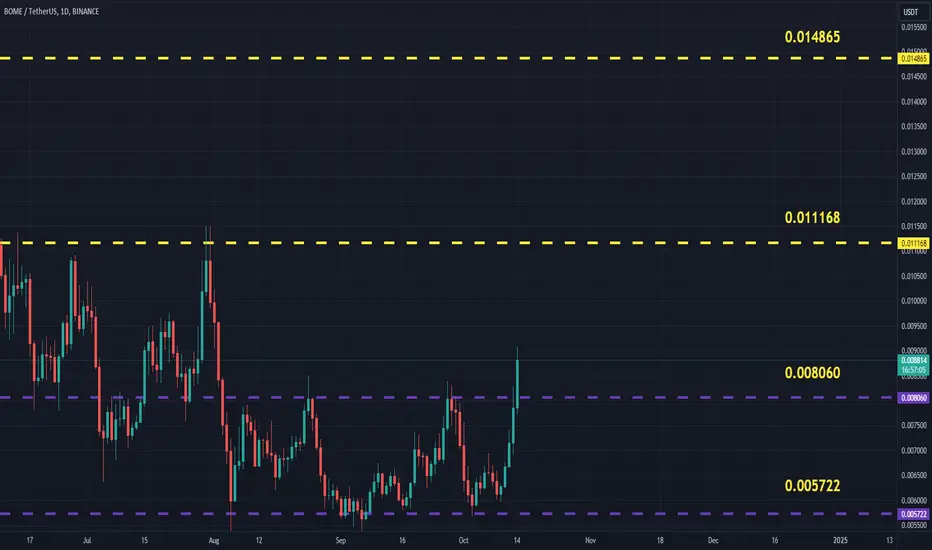
BOMEUSDT (BOOKOFMEME) Updated till 14-10-24BOMEUSDT (BOOKOFMEME) Daily timeframe range. meme coins got good potential in next run if retail interest keeps up. now in here it got out of 0.008060 if PA can defend 0.008060 that can push it to 0.011168.
#BOME Reaches a Critical Support Line | Is This the Moment? Yello, Paradisers! Are you ready for what could be a pivotal moment for #BOME? Let's dive into the details and see what's happening!
💎#BOME is currently trading within a descending channel, with the price consistently respecting the channel's boundaries. Right now, #BOMEUSDT is retesting a significant support zone at $0.0070-$0.0077.
💎Historically, this zone has provided a bullish push, and we might be on the brink of another upward movement.
💎#BOOKOFMEME has reached a new all-time low, touching the channel's lower boundary. This scenario significantly increases the chances of a bullish rally towards the upper channel and a potential breakout.
💎If the major support zone ($0.0070-$0.0077) holds, we could see a strong bullish momentum. In case it fails, the next support at $0.0064 might come into play, potentially providing another bullish push for $BOME.
💎However, if the price continues to fall and breaks below $0.0064, we might witness a bearish continuation for the #BOMEUSDT.
Stay disciplined and focused, Paradisers. The next move could be crucial for this particular asset.
MyCryptoParadise
iFeel the success🌴

BOOK OF MEME (BOME) a setup for upto 27% pumpHi dear friends, hope you are well and welcome to the new trade setup of BOOK OF MEME (BOME) with US Dollar pair.
Recently we caught almost 20% pump of BOME as below:
Now on a 4-hr time frame, BOME is completing the final leg of a bullish Gartley move for the next price reversal.
Note: Above idea is for educational purpose only. It is advised to diversify and strictly follow the stop loss, and don't get stuck with trade.

Exciting news for BOME lovers! BOOK OF MEMEThis chart suggests there might be a potential surge in the value of $COINEX:BOMEUSDT!
While the chart itself is easy to understand, it's important to do your own research before making any trades.
Here's my take: Consider entering a long trade (buying) if the price goes above $0.014900 .
But remember, this is just my personal analysis, and it's crucial to conduct your own in-depth investigation before making any financial decisions.
Wishing you the best of luck!

BOMEUSDT LONGBome, although it was launched on the market with the claim of being a new Pepe Coin, has not yet shown the expected performance. However, being a very new coin, consolidating at similar points for about 5 days and most importantly thanks to the halving period of Bitcoin, it is very likely to rise by making new ATHs.
BUYING OPPORTUNITY AREA
0.0112 ~ 0.0137
NO STOP LOSS (I SEE STRONG INCREASE OPPORTUNITY)

BOME Classic Ascending Breakout 🚀Hey Traders,
So The Idea is told on the charts. Enter from the marked Entry zones & hold till the All time High passes. Then sell little by little. Don't let greed take over.
DYOR!! These are meme coins
Happy Trading.. Hope this performs out of BTC..

#BOME/USDT 1h (ByBit) Falling wedge near breakoutBook Of Meme is regaining 20EMA support and seems ready for short-term recovery.
⚡️⚡️ #BOME/USDT ⚡️⚡️
Exchanges: ByBit USDT
Signal Type: Regular (Long)
Leverage: Isolated (1.4X)
Amount: 5.1%
Current Price:
0.011289
Entry Targets:
1) 0.010976
Take-Profit Targets:
1) 0.017089
Stop Targets:
1) 0.007912
Published By: @Zblaba
ECONOMICS:BOME BYBIT:BOMEUSDT.P #BookOfMemE #Meme #SPL
Risk/Reward= 1:2.0
Expected Profit= +78.0%
Possible Loss= -39.1%
Estimated Gaintime= 2 days

BOMEUSDT - Let's Talk About The Waves...To all newcomers to my channel, I introduced my proprietary wave-reading methodology back in 2015, which I consider superior to others.
I apply it across interest rates, the stock market, currencies, and cryptocurrencies. Its simplicity is key, and today I'll provide a concise overview of its principles and functionality.
This will shed light on how I'm able to analyze the charts of newly-launched coins, even those with less than a month of data.
Despite the short timeframe, significant events unfold, offering valuable clues that I'll outline here.

BOMEUSDT - Book Of Meme - Set For A Move Higher...I've been closely monitoring this memecoin since its inception, and its behavior indicates a resurgence in memecoin enthusiasm.
It's highly probable that we'll witness a surge of interest in this particular coin shortly as word spreads and more people jump on board.
The pattern seems promising, and initiating a long position with critical support at .012069 appears sensible. Target to be announced later.


BOME looking very bullishStill waiting for the BOME to cross 0.015102 ( alert set at 0.016232 )
remember the 1hr candle must close above the 0.015102
and has been in an accumulation zone for 4 days
look for this to be posted in the VIP setups ( not now .. but when it's ready )
I'm sure you have noticed ... I don't post 10-20 charts a day
I only post when the coin is ready to make us money
When we show results of trades .. the likelihood of you being in the trade
is EXTREMELY HIGH due to the fact we only post when they are
absolutely ready
Not Financial Advice
