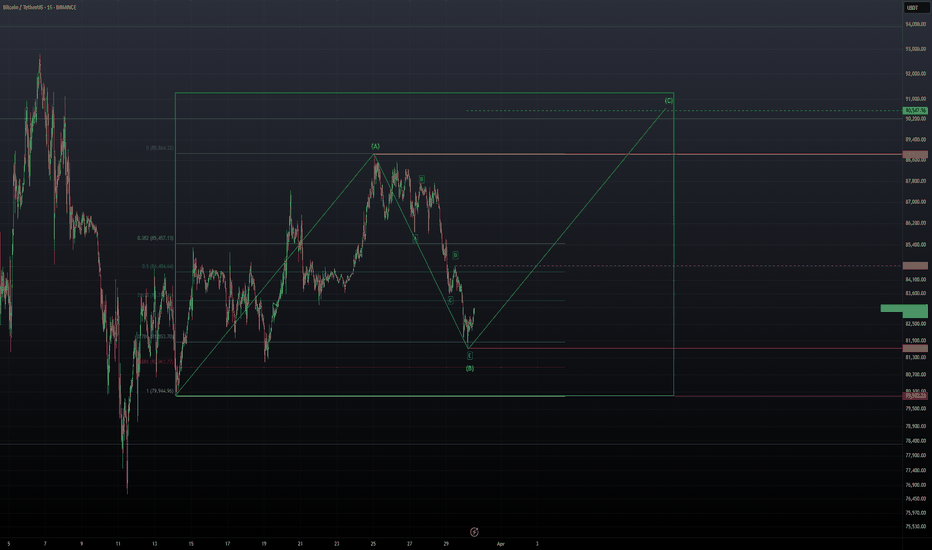
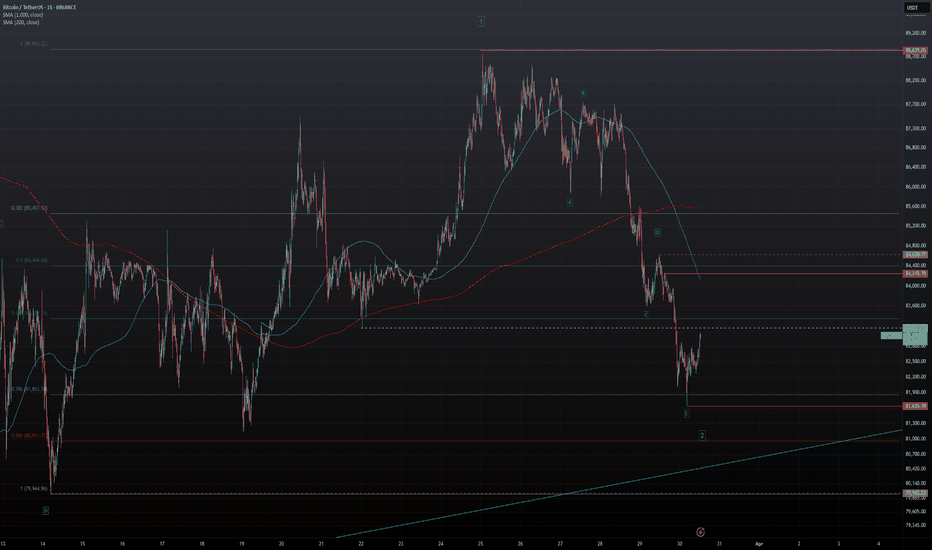
This idea is explained in the video linked below. The price action speaks for itself, and it’s hard to ignore what looks like the end of the recent correction. A break below $81,222 would confirm this view. Short Entry: $81,222 Stop Level: $84,715 Target: $61,000
After multiple rejections at higher price levels, the most recent major rejection—followed by a break of the lows—suggests that the corrective move we've seen since the end of February may have concluded. In this video, I outline the key reasons why a larger upside move no longer appears likely. With the potential end of the corrective wave combinations now in...
In this video, I break down the latest price action while incorporating some AriasWave analysis along the way. There's nothing unusual happening—just psychological reactions testing your patience. Welcome to the world of trading lol, where you can be riding high one moment and facing losses the next, shifting between excitement and frustration. Today, I dive...
In this video, I share an update on the developments I've observed since yesterday as we prepare for a move higher in a third-of-a-third wave. As price movements become smaller and sharper at lower degrees, identifying the correct count becomes more challenging. That’s why I always consider bearish alternatives and play devil’s advocate. However, at the...
In this video, I break down the current trade setup and explain how every wave fits into a larger, predictable structure. If you don’t understand where we are within that structure, you won’t be able to take advantage of the waves ahead. Now is the perfect time to learn AriasWave, and I’m offering it for free when you sign up with Phemex—visit my website for...
We have had confirmation of Wave 3 In Progress. I will be initially looking to target the .786 retracement back to the highs. Check out the related videos down below for the full coverage of this trade. Stay tuned for more updates. Target $102,886 Stop: $81,274
In this video, I discuss why Bitcoin may still make another low before the Wave 2 correction is fully complete. Upon closer examination of Wave iv in the previous Wave 5 correction, it appears the level where Wave iv ended was slightly miscalculated. Technically, Bitcoin should have dipped below the perceived low, but either its strength has prevented this, or...
According to the latest count, Wave 2 of Wave C appears to have completed at the recent lows. I’ll be posting a video soon to explain my analysis. From here, we should see a steady price increase. There's no target yet—we need a confirmed break above 88,788 for more certainty—but this count offers an opportunity to enter near the lows for those willing to take...
In this video, I break down why I posted the earlier chart (linked below). After studying this pattern for hours, I finally decoded the Wave 2 correction for Wave C—just in time to take a long trade at support. A solid protective stop is around $81,274, while a break above $82,759 offers partial confirmation. The key confirmation level, however, is $88,788....
In corrective patterns, Wave 2 can sometimes include large expanded waves. Here’s a simplified example of a potential Zig-Zag trade. The critical support level is at the start of the move at $79,962, while key support lies at the 0.786 retracement level at $81,635 if we break above $84,630. The target for Wave (C) is $90,547, aligning with the length of Wave (A).
Due to the lack of sustained downward momentum overnight and the overall weak move, I have relabeled the decline from $88,839 as a sharp correction, potentially marking the end of Wave 2 in a Wave E corrective bounce. Wave 1 appears to be a Type-2 Weak 5-Wave move that began at $79,962. To confirm this bounce, we need a break above $84,630, with a protective...
It appears as though the Wave 2 or Wave (B) Correction ended at 88,715. Due to a break of support, I have no option but to assume the correction ended at the last high. I will post a video breakdown of this shortly. Short Stop: 84,750 Target: 63,558
In this video, I break down a straightforward long trade based on an internal corrective zig-zag pattern. This setup demonstrates how to capitalize on short-term trades with a solid risk-reward ratio, securing profits before looking for a re-entry opportunity. The trade aligns with the anticipation of Bitcoin approaching its recent highs, potentially forming a...
In this video, I explore the possibility that Bitcoin may have already hit a temporary peak. My perspective comes from initially building a bullish case—only to uncover subtle flaws that I chose to set aside. But as I meticulously documented my observations, those cracks in the bullish argument became impossible to ignore. When I switched to a bearish wave...
In this video, I break down a potential scenario that could initiate a major surge in Wave v of Wave 5. If this is the final move, it should be strong—possibly even sharper than Wave iii. I outline the key buying zone, which represents the lowest point price may reach before reversing into a powerful impulsive move. My plan is to go long within the $74K–$76K...
After identifying an error in the recognition of Wave D, Please be aware that price is likely to continue lower than expected and may find support at the 50% or .618 retracement areas. Trade accordingly and I will post an update later today. Last pivot high is 84,857
In this video, I demonstrate how AriasWave can help identify structures within patterns, even with limited data, to develop trading ideas. I also break down a short trade setup for this newly launched project. Short Entry: At Market. Stop Level: 1.95 Target: 1.47
A slight shift in the overall interpretation of this structure. We're still watching for a break above 93K for confirmation, but for those who trade with leverage, this analysis could provide an edge. If it plays out as expected, we may see a fairly tight stop. A decisive move higher is needed soon to confidently validate this setup.


