Bank of Punjab (Daily chart analysis):Current Situation: 📊
Price: 37.00 PKR, down 5.64% 📉
ANOTHER BREAKDOWN ALERT! Similar pattern to Thatta Cement! ⚠️
Banking sector showing weakness 😰
Key Technical Observations: 🔍
Trend Structure:
Multi-stage rally from October 2024 to October 2025 📈
Stage 1: Consolidation around 10-14 (Oct 2024 - Aug 2025) 🐌
Stage 2: Explosive breakout to 24 (August-September) 🚀
Stage 3: Parabolic acceleration to 42 (September-October) 💥
NOW: Sharp reversal in progress 😱
Critical Support/Resistance Levels: 🎯
Resistance (The ceiling overhead):
Immediate: 38-39 (today's breakdown point) 🔴
Strong: 40-42 (recent all-time highs) 🏔️
Major: 43-45 (psychological extension - not reached)
Support (Where buyers might step in):
Current: 36-37 (attempting to hold here) 💪
Strong: 34-35 (minor consolidation zone + red line resistance) ✅
Critical: 30-32 (gap support + psychological level) 🛡️
Major: 24-25 (pre-parabolic breakout zone) ⚓
Ultimate: 15.50 (long-term consolidation - blue line) 🏰
Volume Analysis: 📊
Massive volume spike during the recent rally (circled in purple/blue) 🌊
Today's volume elevated at 62.44M - Distribution phase beginning 🚨
Recent volume patterns show selling pressure increasing 📉
Declining volume on up-days = Weak hands buying 😬
Pattern Recognition: 📐
Three-stage rocket launch 🚀🚀🚀
Base building (6+ months)
Initial breakout (August-September)
Parabolic finale (October)
Classic blow-off top forming 💨
Potential double top if fails to break 42 again 🎩🎩
No clear trendlines for support = Free fall risk! 😨
Technical Indicators: 📈
What's Working Against Bulls:
Parabolic moves rarely sustain 📉
300%+ gain in 12 months = Overextended! 🎈
No meaningful consolidation at highs = Weak foundation 🏚️
Volume declining on rallies = Exhaustion ⚡
Banking sector sentiment shifting 🏦
What Could Help Bulls:
Still in overall uptrend (higher highs, higher lows) ✅
No major trendline break yet 💚
Strong fundamental momentum (if applicable) 📰
Sector rotation could bring buyers back 🔄
Technical Outlook: 🎲
Bearish Scenario (MEDIUM-HIGH Probability - 65%): 🐻
Fails to reclaim 38-39 in next few sessions 📉
Drops to 34-35 zone (-8% from here) ⬇️
If 34 breaks: Next stop 30-32 (-15% from here) 😰
Worst case: Gap fill at 24-25 (-35% from here) 💀
Reasoning: Parabolic exhaustion + volume distribution 📊
Neutral Scenario (MEDIUM Probability - 25%): 😐
Consolidates between 35-39 for several weeks ↔️
Forms a healthy base for next leg up 🏗️
Needs time to digest the massive rally 🍽️
Watch for decreasing volume (good sign) 📉
Bullish Scenario (LOW-MEDIUM Probability - 10%): 🐂
Quick shakeout followed by V-recovery above 39 ⚡
Resumes rally to 43-45 extension targets 🎯
Would need massive volume and positive catalyst 📰
Less likely given the extended nature of the move 🤔
Trading Strategy: 💡
For Current Holders: 😰
Yellow Flag: Not as severe as Thatta Cement, but concerning! ⚠️
Hold with tight stop: Below 35 ✋
Consider taking partial profits to lock gains 💰
If you bought near lows (10-15), you're still up 150%+! 🎉
Risk management: Don't give back all your gains! 🛡️
For New Buyers: 🤔
WAIT! Don't chase the falling stock! 🏃♂️💨
Watch and wait for clear support formation 👀
First opportunity: 34-35 (if holds with volume) ✅
Better opportunity: 30-32 (safer entry) 💪
Best opportunity: 24-25 (if full retracement - stellar R:R!) 🌟
Set alerts and be patient! ⏰
For Traders: 📈
Swing traders: Short-term bounce to 38-39 possible (1-2 day trade) 📊
Day traders: Volatility is high - use tight stops! ⚡
Short sellers: Wait for lower high formation before shorting 📉
Any bounce = potential exit point until trend confirms ↗️
Key Levels to Watch: 👀
Bullish Confirmation:
Reclaim 38-39 with strong volume = Crisis averted! ✅
Break back above 40-42 = Resume uptrend 🚀
Volume > 70M on green days = Buyers stepping in 💪
Bearish Confirmation:
Break below 35 on volume = Trouble! 🚨
Close below 34 = Next leg down confirmed 📉
Volume > 80M on red days = Panic selling 😱
Multi-Timeframe View: 🔭
Weekly Chart Perspective:
Still in strong uptrend on weekly ✅
One red weekly candle doesn't break trend 💚
But watch for weekly close below 35 🎯
Monthly Chart Perspective:
Spectacular monthly rally from 8 to 42 (425%!) 🤯
October monthly close will be crucial 📅
Needs to hold above 32-33 on monthly 📊
Sector Context: 🏦
Banking stocks in Pakistan have been strong but:
Interest rate cycle considerations 📉
Economic conditions impact 🌍
Watch other banks for sector rotation 👥
Relative strength vs. sector matters 💪
Risk Assessment: ⚖️
🟡 MEDIUM-HIGH RISK ZONE 🟡
Not as dangerous as Thatta Cement yet ⚠️
But showing similar warning signs 🚨
300%+ rally needs consolidation ⏸️
First major pullback in months 📉
Could be healthy correction or trend change 🤷♂️
Sentiment Check: 🌡️
Retail investors likely trapped at highs 😰
Smart money may be distributing 🏦
FOMO buyers now underwater 🌊
Fear starting to replace greed 😱
Patience will be rewarded! 🧘♂️
Bottom Line: 🎯
This is a WARNING SHOT across the bow! 🚢 The stock had an incredible run but is now showing fatigue. Unlike Thatta Cement's catastrophic breakdown, BOP has a chance to stabilize if it holds 34-35. However, don't try to catch a falling knife! Wait for a proper base to form.
Remember: Parabolic moves are exciting on the way up 🎢 but terrifying on the way down! 😱 The best trade right now might be NO trade - let the dust settle! 💨
Patience Level Required: 🧘♂️🧘♂️🧘♂️ (High!)
Bop

BOP (11.65 breakout level)BOP is recovered and its breakout level is 11.65
Note: This is not a buy sell trade call. Trade at your own will. Use stop loss.

BOP is reaady to flyPositive momentum of BOP since last few days and breaking level of 5.75 it is likely to break 7.86 level to fly 9 and above levels.
Note: This is not a buy/sell call. Use SL as per your strategy.

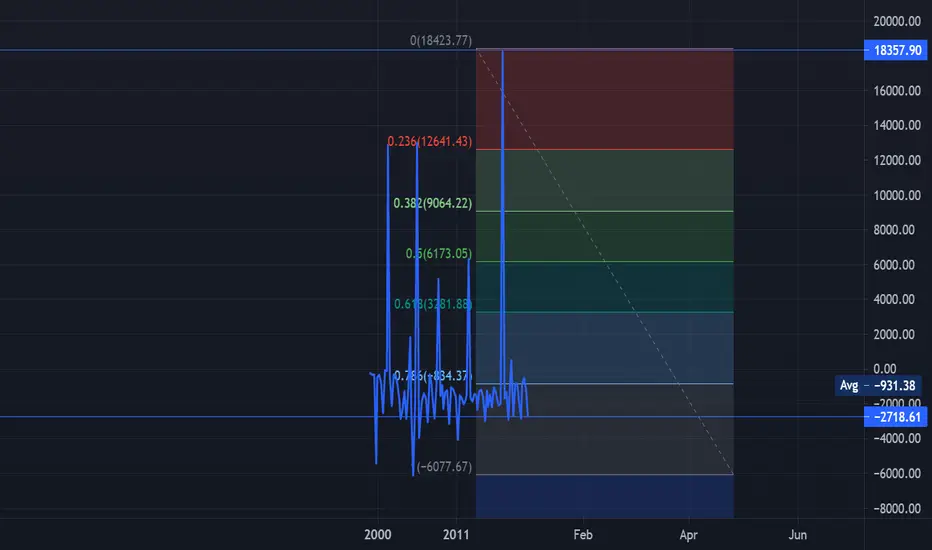
Balance on Capital Account - An Extreme ReversalBOCA is simply the sum of the surpluses or deficits of net non-produced, non-financial assets, and net capital transfers.
These components make up the BOP or Balance of Payments.
The Chart clearly illustrates the dramatic Collapse... An important indicator which has proceeded prior corrections in
the Equity Complex.
The warning signs for a large retracement, it will no be the far larger correction ahead, but an intermediate term
correction. This will provide an entry opportunity off the lows for a final rally to new all time highs.
Patience will provide, Opportunities are quite rich for both the decline and reversal.
The ROC in BOCA/BOP illustrates the writing on the wall. It is best to consider these movements as a precursor to
an "Event"...
The same pattern has repeated at important junctures prior to the corrections.
The Divergences we've discussed over the past 7 weeks continue to compound, ignoring these...
Ends badly.
- HK
Indicators: My Issues with BoP: Part #2In Part #1, we established how technical indicators - even the ones with high potential to be leading indicators that may enable revealing possible upcoming price movements, using the example of the Balance of Power (BoP), can come short of taking into consideration all factors associated with the price - we listed 7 specific issues that may cause BoP to show inaccuracies and a trader who depends on BoP for trading signals, need to either be aware of them, or adjust the indicator to address these issues.
so what's the idea here? why am I posting this?
the concepts i address here impact traders today. i see many fellow traders using MACD or RSI or other methods without the complete understanding of what exactly the signals are telling them - while i'm not a guru by any means, i thought i can share an example here of one of the highly potential concepts and a famous indicator, its shortcomings, and how it may be possible to tweak and adjust it to make it more reliable to the way each of us wants to trade. It becomes "your own system" - it interprets the movement the way *you want to visually interpret it* - and produces signals that you understand exactly what they means and you can rely on, to make a trade (entry / exit) decisions, score more winners, less losers -- it's a step into the "DIY" world of technical indicators if you would.
In this part, we pick one of the issues from part #1, and see how we can possibly fix it. and see what this "upgraded" BoP would look like.
i'll take the issue of "BoP not taking into consideration where the close of the bar is, compared to the full range of the bar"
as we know, if the bar closes near the high, this is a usually very bullish sign, and vice versa. the Shooting Star example (right-most bar in the chart) is an up bar, where close is > open - and as such, the classic BoP gives it a positive score. we all know how bearish a shooting star is - it's a scary pattern to the long trader - if BoP is accurate, it should result in some negative value for such a bar.
our update #1 adds a simple calculation - on top of the classic (Body / Range) BoP calculation. It also adds another score for where the bar closes compared to the High. if it closes exactly on the high, it gets a positive +100% and if it closes at the low, it gets a negative -100% -- then the scores are added together and averaged to produce a more accurate representation of the bar - that representation is closer to the way you, as a trader, would have in mind when you "visually" inspect the bar.
take a look now as you meet BoP II :) -- some of you would say "Aha!" - now the shooting star gets the negative BoP score it deserves :)
i further marked few note-worthy bars on the top chart where the score of the upgraded BoP formula, with this simple technique, is considerably (in my view) different than the classic BoP score - check for yourself if the BoP II score makes more sense to you, and is closer to your "visual" assessment of how bearish / bullish a bar looks to you.
on the lower BoP indicator, you can see the difference in action, between the old and the new calculation - also marked areas where old BoP would have shown strength where is should show weakness, or the other way around.
in conclusion, i suspect some may be wondering -- 'OK, if we fix all issues with BoP - add volume & spread impacts and factor in the "context" of where the bar is within a trend - do we get the "holy grail" indicator of all times?
we'll see -maybe in future parts - please let me know if you find this research interesting of if you have comments.

BTC Running With The Bulls?The past week has seen a steady increase in BTC price. While some are predicting an upcoming reversal, there is decent evidence of a continuation.
Looking at the chart, we can observe an ascending triangle pattern forming(represented by the dotted pink line). This pattern formation in the midst of a positive price trend can typically be viewed as an indication of trend continuation. Further in-depth technical analysis results in a similar conclusion.
The bottom chart (The Trend Sniper) shows an adjusted DMI, with DI + shown in green and DI- shown in red. At 2:00 on June 19th, we see a cross-over occur, with the DI+ rising above the DI-. This ended the brief ranging period highlighted in the light grey box and signaled the start of a positive price movement. Since this crossover, positive directional movement has steadily increased, while negative directional movement has steadily decreased. It is safe to say there will be continued positive momentum until we begin to see the DI- values beginning to climb and head towards another crossover with DI+.
To assess the volume patterns and possible divergences, we analyzed the OBV-based Divergence Detector indicator. The chart echoed the signals generated by the Trend Sniper. For the most part, the OBV's movement has matched the BTC price action. Although the past 24 hours has seen a few bearish divergence signals (highlighted by the pink circles), the OBV value has remained above zero and confirms the recent positive price movement.
The third chart from the bottom shows a Triple Exponential Moving Average accompanied by a Volume-Weighted Moving Average. The VWMA is shown as the darkest red/green line. When the VWMA value is greater than the three EMA's, the area between the VWMA and EMAs has green fill. When VWMA falls below the TEMA, the area representing the difference between the values has red fill. We have seen the VWMA line crossover the TEMA (circled in green) within the past 4 hours, indicating the beginning of another uptrend confirmed by concurrent increases in volume.
The PowerTrader indicator shows a steady climb in Balance of Power (BoP) values from June 18th onward. This gives us yet another hint that this bullish trend hasn't quite run out of gas just yet.
