Algotrading AVAX longPress "Grab this chart", run strategy tester since 2020 and make sure that is good time for a long to yellow line
Bot

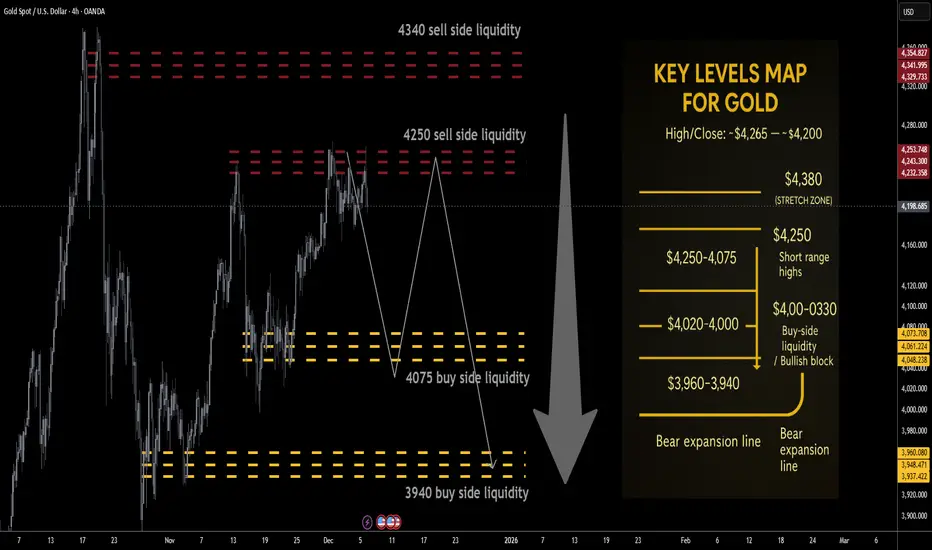
Gold next week Key S/R Levels and Outlook for Traders🔥 GOLD WEEKLY SNAPSHOT — BY PROJECTSYNDICATE
🏆 Swing High / Swing Low
$4,265 → ~$4,164 — clean rejection from the 4,26x breakout zone with a long upper wick, but weekly close still near $4,200, keeping price pinned in the upper part of the broader $4k range.
📈 Trend
Higher-timeframe: Structural bull trend intact while price holds above the $3,940–$4,000 block.
Tactical: Last week’s failed extension above $4,250 and the close back near $4,200 tilt the tape into distributive mode:
Rallies into $4,250 / $4,340 = sell-side liquidity magnets.
Downside liquidity sits lower at $4,075 / $3,940, making upside risk/reward look asymmetric to the downside from current levels.
🛡 Supports – Buy-Side Liquidity / Downside Objectives
$4,130–$4,100:
Short-term intraday pivot where buyers repeatedly stepped in last week; first micro-reaction zone on any flush.
$4,090–$4,075 🟢 Buy-side liquidity #1
First true BSL pocket below the close; ideal TP1 for shorts from above and a spot where responsive dip-buyers are likely to probe.
$4,020–$4,000:
Psychological shelf; loss of 4k would confirm that local distribution is winning and open the deeper BSL run.
$3,960–$3,940 🟢 Buy-side liquidity #2 / structural block
Higher-timeframe demand and key liquidity magnet for a fuller corrective leg. A sustained break/acceptance below $3,940 would signal that the 2025 blow-off is transitioning into broader mean-reversion rather than shallow consolidation.
🚧 Resistances – Sell-Side Liquidity / Short-Side Focus
$4,220–$4,250 🔴 Sell-side liquidity #1
First overhead supply from the prior week’s failed breakout structure and just under recent highs. Clean area for “sell the rip” probes and for late longs to de-risk.
$4,300–$4,340 🔴 Sell-side liquidity #2
Extension / SLI pocket aligned with the upper part of last week’s range and just below the prior $4,38x–$4,40x all-time high band. Ideal for scaling adds if a news-driven squeeze runs stops above 4,250.
Stretch: $4,380–$4,400:
Prior record spike / stop-run area; only expected on a full-on squeeze into the Fed, but a tag here would likely be exhaustion rather than a new sustainable trend leg higher.
🧭 Bias Next Week
Base tactical bias: fade strength / short rallies, not chase upside.
the tape favors a liquidity grab higher → rotation lower scenario:
Look for wicks into $4,220–$4,340 to be sold.
Downside path of least resistance: $4,090–$4,075 → $4,020–$4,000 → $3,960–$3,940.
⚖️ Base Case Scenario
Open/early week:
Price opens near $4,200 and either trades flat or spikes briefly into $4,220–$4,250 on weekend gap/early flow.
Liquidity sweep into resistance:
Rejection from SLI:
Failure to accept above $4,250/4,300 leaves upper wicks on 4H/daily, signaling distribution.
Rotation into BSL:
First objective: $4,090–$4,075 (TP1)
Secondary objective: $4,020–$4,000 (TP2)
Stretch / full flush: $3,960–$3,940 (TP3) into the structural demand block and buy-side liquidity pocket.
🚀 Breakout / Invalidation Trigger
Bearish framework invalidation:
A strong daily/weekly acceptance above $4,380 would imply shorts caught offside and re-open the path toward $4,450+ in line with the higher Street targets for 2026.
In that case, shift from short-the-rip → neutral / buy shallow pullbacks until a new top structure forms.
🔓 Bull / Bear Trigger Lines
Structural bull line:
Above $3,940–$4,000: long-term bull structure remains intact. Even if you’re tactically short, treat deep moves into this area with respect – this is where higher-timeframe players are likely to re-accumulate.
Bear expansion line:
Below $3,940: opens scope for a faster liquidation wave toward $3,880–$3,850 and potentially a broader 2025–26 consolidation phase instead of immediate continuation higher.
🧭 Recommended Strategy – Short at Market Open
⚠️ Illustrative trade plan, not financial advice. Size and risk-manage according to your own rules.
1️⃣ Primary Short – Open + Fade the Rips
Short at/near market open around the $4,195–$4,210 zone if price opens below $4,220 and orderflow confirms rejection of higher bids.
Add / build zones:
Add 1: into $4,220–$4,250 (first SLI band / prior breakout zone).
Add 2 (only if spike): $4,300–$4,340 (second SLI; look for clear blow-off / stop-run behavior before loading the last clip).
Stops / invalidation:
Tactical stop: hard stop above $4,380.
More conservative: soft line at $4,340, hard stop $4,390–$4,400 to allow for intraday wicks.
Targets (aligned with buy-side liquidity):
TP1: $4,090–$4,075 → take partials and reduce risk.
TP2: $4,020–$4,000 → core target for the week if distribution plays out.
TP3: $3,960–$3,940 → full BSL sweep into structural demand; expect responsive buying attempts here.
Algotrading DOTUSDTPress "Grab this chart", run strategy tester and make sure that is good time for a long to yellow line

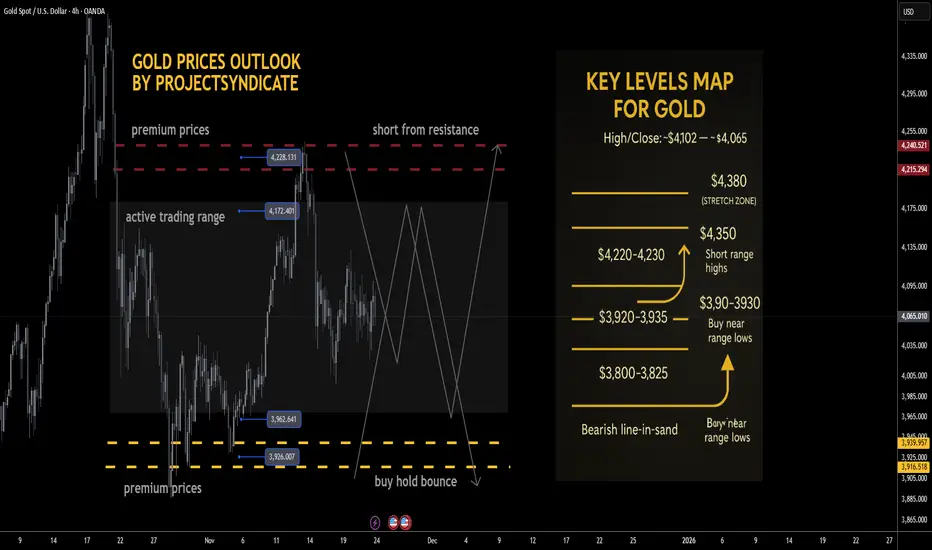
Gold next week: Key S/R Levels and Outlook for Traders🔥 GOLD WEEKLY SNAPSHOT — BY PROJECTSYNDICATE 🏆
High/Close: ~$4,102 → ~$4,065 — tight, inside-feel week with price holding comfortably above the $4,000 handle. Flows look balanced: steady two-way interest, but no strong directional conviction as the market oscillates within a well-defined range.
________________________________________
📈 Trend:
Still bullish on the higher timeframe, but very clearly in range / two-way mode. As long as we’re capped below the $4,350–4,375 ATH supply block and holding above the $3,900s, the playbook remains “range-trade the extremes” rather than chase breakouts.
________________________________________
🛡 Supports Buy Zones
• $3,920–3,930 — key range lows / primary dip zone:
o Your preferred “buy low” area; recent reactions show responsive buyers defending this shelf.
o This is the first major liquidity pocket for range longs and a natural first target for shorts from resistance.
• $3,800–3,825 — deeper demand pocket / fail-safe shelf:
o Secondary, more extreme downside area where higher-timeframe dip-buyers are likely to step in.
o A clean break and daily close below here would suggest the range is failing and a deeper mean reversion is in play, not just a normal pullback.
________________________________________
🚧 Resistances Short Zones
• $4,220–4,230 — immediate range resistance / short-sell zone:
o Your core “short from resistance” idea; this band remains a logical area to fade strength.
o First tests into this region are attractive for tactical shorts, especially if intraday momentum is stalling.
• $4,350–4,375 — ATH heavy resistance block:
o Still the major supply area above.
o Any spike here is a fade candidate unless price starts accepting above it with strong volume and multiple daily closes.
________________________________________
🧭 Bias – Coming Weeks
Base expectation is continued range-bounce price action between roughly $3,920–$4,220, with the broader structure still nested inside the larger $3,800–$4,350 range:
• Preference to fade strength into $4,220–4,230, targeting rotations back toward $3,920–3,930.
• Conversely, buy dips into $3,920–3,930 for moves back toward $4,220–4,230, as long as we hold the $3,800 shelf on a closing basis.
• Invalidation of the “range grind” idea comes on:
o Sustained acceptance above $4,350–4,375 (turns it back into trend-up).
o Or a decisive loss of $3,800–3,825 (opens a deeper corrective leg).
________________________________________
🔝 Key Resistance Zones
• $4,220–4,230 — front-line ceiling; aligns with your tactical short-sell band. Strong candidate to initiate shorts on first, clean tests.
• $4,350–4,375 — prior ATH / macro supply block. Only flips from “sell zone” to “bullish continuation base” if reclaimed and held as support.
🛡 Support Zones
• $3,920–3,930 — primary range low and first major liquidity shelf; ideal first take-profit for shorts and main dip-buy area.
• $3,800–3,825 — deeper support; loss of this level changes the narrative from “sideways digestion” to “larger corrective structure.”
________________________________________
⚖️ Base Case Scenario – Range / Consolidation
Core view: Market continues to oscillate between $3,920–$4,220, within the broader $3,800–$4,350 band.
• Pushes into $4,220–4,230 are sellable for rotations back toward $3,920–3,930.
• Dips into $3,920–3,930 are buyable for rotations back toward $4,220–4,230, as long as structure and flows remain balanced.
• While weekly closes keep rejecting the $4,350–4,375 ATH block, the default remains “sell strength, buy clean range lows.”
________________________________________
🚀 Breakout / Breakdown Triggers
• Bull trigger:
o Sustained acceptance above $4,350–$4,375, with multiple daily closes holding above and that band starting to act as support.
o That would shift tone from “range trading” back to full-on bullish trend, reopening path toward and beyond prior extremes (~$4,400+ in your framework).
• Bear trigger:
o A decisive daily close below $3,800 converts the current “healthy sideways correction” into a deeper, more directional liquidation phase, likely targeting prior lower shelves and expanding volatility.
________________________________________
💡 Market Drivers to Watch
Even in a range, macro and flow catalysts dictate which side of the range gets tested first:
• Real yields & Fed path: Any hawkish repricing or upside surprise in data tends to cap rallies near resistance; dovish shifts / easing fears support the lower end of the range.
• U.S. fiscal / political noise: Episodes of stress typically underpin gold; temporary relief or “risk-on” swings can blunt upside and push price back toward range lows.
• Flows & positioning: After a massive secular run, fast money continues to fade extremes, locking in profits into strength and reloading near range lows.
• Cross-asset behavior: If risk-off hits and gold fails to catch a bid (selling alongside equities), expect deeper probes into the lower end of the range before strategic buyers step back in size.
________________________________________
🔓 Bull / Bear Trigger Lines
• Bullish above: $4,350–$4,375 (sustained acceptance; ATH block reclaimed and used as support).
• Bearish below: $3,800 (shifts from contained range to deeper correction regime).
________________________________________
🧭 Strategy – Focus on Trading the Range
Primary plan – short from resistance (core idea):
• Entry zone:
o Scale into shorts around $4,220–$4,230 (front edge of resistance).
• TP #1:
o $3,920–$3,930 — key range lows; logical place to close majority of the short.
• Runner / extension:
o Leave a runner targeting $3,800–$3,825 if momentum and macro tone turn heavier.
• Risk / invalidation:
o Hard invalidation if price accepts above $4,350–$4,375 (multiple daily closes and successful retests from above).
________________________________________
Alternative plan – buy low from key range lows:
• Entry zone:
o Stagger bids in $3,920–$3,930; add more aggressive size only if we see responsive buying and positive reaction there.
o Optional deeper add zone at $3,800–$3,825 for higher conviction swing longs if structure still looks constructive.
• Exit zone / targets:
o First target back into $4,220–$4,230; heavily de-risk or fully exit as we approach that band.
• Risk management:
o Cut or significantly reduce longs on a daily close below $3,800 or if price accelerates through that shelf on high volume.
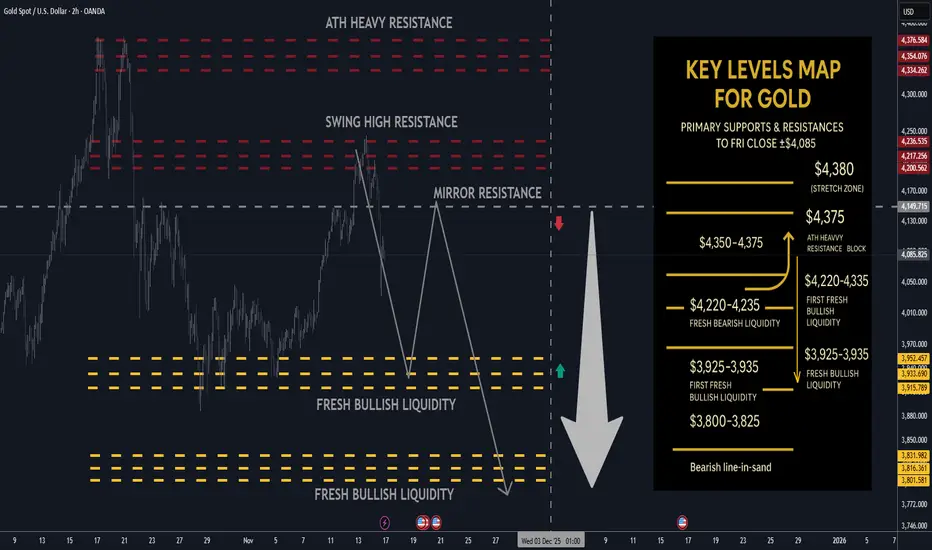
Gold next week: Key S/R Levels and Outlook for Traders🔥 GOLD WEEKLY SNAPSHOT — BY PROJECTSYNDICATE
🏆 High/Close: ~$4,244 → ~$4,085 — buyers punched through $4.20k but sellers defended the $4,220–4,250 band; weekly close is soft but still comfortably above $4k and mid-range.
📈 Trend: Bullish but in corrective / two-way mode ; treating current tape as range-trade while below the $4,350–4,375 ATH supply block.
🛡 Supports: $3,925–3,935 fresh bullish liquidity → $3,800–3,825 deeper demand pocket— key shelves where dip-buying is expected.
🚧 Resistances: $4,220–4,230 short-term fade zone → $4,350–4,375 (ATH heavy resistance block).
🧭 Bias next week: Preference to fade strength into $4,220–4,230, targeting a rotation back into $3,925–3,935. Alternative is to buy dips into $3,925–3,935 and ride the range back toward $4,220–4,230. Invalidation on sustained acceptance above $4,350–4,375; loss of $3,800–3,825 risks deeper mean reversion.
________________________________________
________________________________________
🔝 Key Resistance Zones
• $4,220–4,230 — immediate weekly ceiling; aligns with your noted resistance block, attractive area to initiate shorts on first tests.
• $4,350–4,375 — prior ATH / “heavy resistance block”; any spike here is a fade candidate unless price accepts above it on strong volume.
🛡 Support Zones
• $3,925–3,935 — fresh bullish liquidity; preferred first take-profit for shorts and primary dip-buy zone.
• $3,800–3,825 — deeper fresh liquidity; failure here would signal a more meaningful correction, not just a pullback in an uptrend.
________________________________________
⚖️ Base Case Scenario
Range/consolidation between roughly $3,800–$4,230:
• First pushes into $4,220–4,230 are sellable for rotations toward $3,925–3,935.
• As long as weekly closes keep rejecting the ATH block $4,350–4,375, bias stays “sell strength, buy clean liquidity dips.”
🚀 Breakout / Breakdown Triggers
• Bull trigger: Sustained acceptance above $4,350–4,375 multiple sessions holding above and using that band as support would shift tone back to full-on trend and reopen the path toward and beyond prior extremes (~$4,400+).
• Bear trigger: A decisive daily close below $3,800 turns the current “healthy pullback” into a deeper correction, opening room toward prior lower shelves sub-$3,750 and likely volatility expansion.
________________________________________
💡 Market Drivers to Watch
• Fed & real yields: Odds of a December cut have ramped up again; any hawkish pushback or hotter data could cap rallies near resistance.
• U.S. fiscal/political risk: Shutdown and fiscal brinkmanship are still in the background; resolution headlines could briefly pressure gold, while renewed instability supports the bid.
• Flows & positioning: ETF and central-bank demand remain supportive, but after a 60% YTD run, fast money is quick to take profits into strength.
• Cross-asset behavior: Watch that equity–gold correlation; if risk-off hits and gold still sells with stocks, dips could run further before strategic buyers step in.
________________________________________
🔓 Bull / Bear Trigger Lines
• Bullish above: $4,350–$4,375 (sustained acceptance; ATH block reclaimed as support).
• Bearish below: $3,800 (opens risk of deeper liquidation below the current liquidity shelves).
________________________________________
🧭 Strategy for this week
Primary plan – short from resistance (your core idea):
• Entry zone: Scale into shorts around $4,220–4,230 front edge of the resistance block.
• TP #1: $3,925–3,935 fresh bullish liquidity; consider closing most size here.
• Runner / extension: If momentum extends lower, watch $3,800–3,825 for final profit-taking; below here the profile shifts into deeper correction mode.
• Risk: Hard invalidation if price accepts above $4,350–4,375 daily closes holding above and successful retests.
Alternative plan – buy the dip into liquidity:
• Entry zone: Stagger bids around $3,925–3,935 and, for more aggressive positioning, into $3,800–3,825.
• Exit zone: First target back into $4,220–4,230; consider de-risking heavily as you approach that resistance band.
• Risk: Cut or reduce if price fails to hold above $3,800 on a daily closing basis or if selling accelerates on high volume through that shelf.
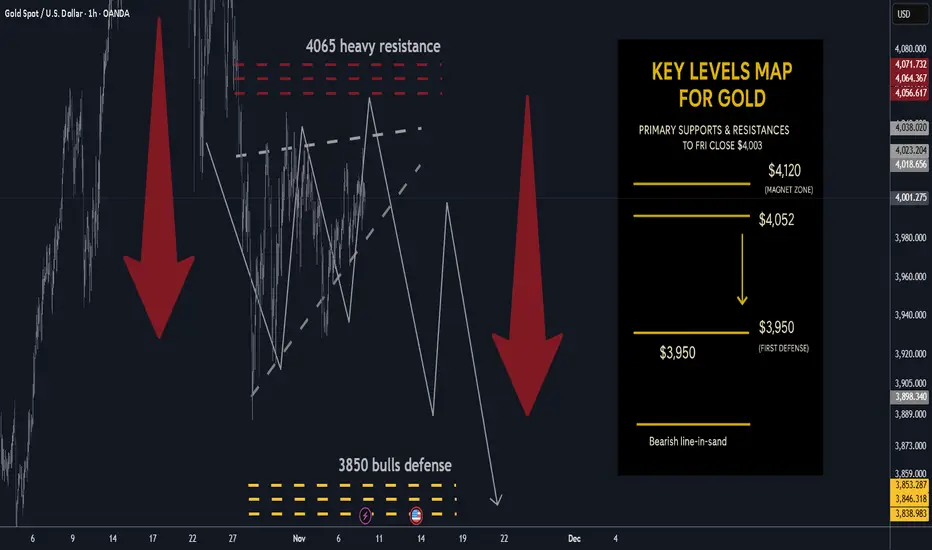
Gold next week: Key S/R Levels and Outlook for Traders🔥 GOLD WEEKLY SNAPSHOT — BY PROJECTSYNDICATE
🏆 High/Close: $4,024.9 → ~$4,003 — sellers faded upticks; weekly close soft but back above the round $4k.
📈 Trend: Neutral / mild correction inside range; not expecting immediate new highs while <$4,080–4,120.
🛡 Supports: $3,950 → $3,900 → $3,850 — pivotal shelves for bears’ take-profit and control.
🚧 Resistances: $4,040 / $4,080 / $4,120 — repeated supply zones; first taps favored for fades.
🧭 Bias next week: Short sells into $4,040–$4,120; TP $3,950 then $3,850 (your plan). Invalidation on sustained reclaim > $4,120–$4,175; loss of $3,850 risks extension lower.
🌍 Macro tailwinds/headwinds (this week’s tape):
• Narrative tone: Kitco flagged “razor’s edge” near $4,000 with mixed views (bubble vs. consolidation), while another Kitco piece framed the stall as a “healthy pause.”
• WSJ flow: Headlines oscillated between “slips below $4,000” and modest up-days; net read is consolidation around $4k with quick two-way trade.
• Levels: Spot finished the week essentially on $4k; intrawEEK high couldn’t clear early-week $4.02–4.03k cap.
🎯 Street view: After last month’s print above $4,000 (first ever), WSJ tone shifted to digestion; rallies still attract supply until a decisive reclaim of upper resistance.
________________________________________
🔝 Key Resistance Zones
• $4,040 — immediate ceiling; weekly high proximity, likely to cap first tests.
• $4,080 — secondary supply ledge from recent failures.
• $4,120 — upper band; acceptance above here starts to neutralize the correction.
🛡 Support Zones
• $3,950 — first defense / first TP.
• $3,900 — round-number shelf; loss invites momentum probes.
• $3,850 — critical structural base and second TP; break risks downside acceleration.
________________________________________
⚖️ Base Case Scenario
Compression within a rising-wedge-like structure, ranging $3,850–$4,120. First pushes into $4,040–$4,120 are sellable for rotations toward $3,950 → $3,850 while the market respects weekly lower highs.
🚀 Breakout / Breakdown Triggers
• Bull trigger: Sustained acceptance > ~$4,120–$4,175 turns the tone constructive again and reopens $4,200+.
• Bear trigger: Daily close < $3,900 increases odds of full $3,850 test; failure of $3,850 risks momentum spill.
💡 Market Drivers to watch
• Fed path / real yields (rate-cut odds vs. sticky inflation narrative in WSJ copy).
• USD swings (no broad USD weakness → upside attempts stall).
• ETF/CB flows (Kitco interviews highlight split sentiment; dip-buyers active, momentum players cautious).
• Event risk (headline sensitivity remains high; quick squeezes into resistance possible).
🔓 Bull / Bear Trigger Lines
• Bullish above: $4,120–$4,175 (sustained).
• Bearish below: $3,900 → $3,850 (risk expands under $3,850).
🧭 Strategy for this week
Short from resistance: Scale in around $4,040 → $4,080 → $4,120;
TP #1: $3,950; TP #2: $3,850;
Risk: Hard stop on a daily close above $4,120 (or intraday breach that holds on retest). Consider trimming if a news-driven squeeze tags $4,175 and fails.
Gold Market Update: Correction Mode 3750/3500 USD possible🟡 Where We Are Right now
After ripping to fresh records, gold snapped hard — WSJ logged the steepest one-day loss in years last week and a follow-through weekly drop as longs unwound.
Analysts across Kitco and others frame this as a technical/positioning correction after a parabolic run, with a fight around the $4k handle and scope to probe $3,750 → $3,500 if selling persists.
Sentiment/flows flipped: GLD and other gold ETFs saw notable outflows into the selloff after heavy YTD inflows. That flow reversal is consistent with a near-term correction phase.
🔻 Why the Market Is Correcting Now
1️⃣ Positioning & Froth Unwinds
The rally attracted outsized speculative length; once momentum cracked, forced de-risking kicked in. WSJ called out “long unwind” dynamics; Kitco says the correction could persist for months as near-term drivers fade.
2️⃣ $4k Failed on First Retest; Technical Break Triggered Stops
Kitco flagged a “fight for $4k” with downside risk if that shelf gives. Once sub-4k prints hit, systematic sellers likely accelerated.
3️⃣ Flow Flip in ETFs
After massive 2025 inflows, GLD posted a sharp daily outflow during the drop — classic late-cycle reversal behavior for a momentum move.
4️⃣ Macro Balance Less Supportive at the Margin
Even with long-term tailwinds (deficits/geopolitics), the recent leg higher ran ahead of fundamentals. Kitco and others note easing physical tightness and cooling central-bank buying pace compared with earlier in the year, removing a key prop for spot.
⚙️ Near-Term Levels That Matter (Tactical)
$4,000 → Battle zone. Regaining and holding above turns near-term tone neutral.
$3,750 → First meaningful downside target; aligns with multiple analysts’ “healthy pullback” zone.
$3,500 → Deeper correction magnet if flows/positioning continue to bleed; widely discussed as a plausible washout level.
🔮 4–8 Week Catalyst Map (What Can Push Price)
🏛️ Macro / Policy
Treasury Quarterly Refunding (Nov 5): Mix/size guidance can sway the long-end, USD, and real yields — key for gold. A heavier bill tilt (and steady coupons) is less threatening than a surprise coupon ramp.
Fed Communication Cadence: With the Oct 28–29 FOMC just occurred, watch minutes (Nov 19) + any guidance shifts. A less-dovish tone or firmer real yields = near-term headwind; growth scares or easing bias = support.
US Data Prints: CPI/PCE, NFP, ISM — anything that re-prices the path of real rates. (Direction of real yields remains the single most important macro input.)
💰 Flows & Positioning
ETF Flows (GLD/IAU): Continued outflows would confirm distribution; a turn back to net inflows often leads price inflections.
COT Positioning: If spec length compresses materially, downside fuel diminishes — setting up a cleaner base. (Track weekly CFTC updates.)
🪙 Physical / Seasonal
India Demand (festive/wedding season) and China retail demand can stabilize spot if discounts narrow and premiums re-emerge, but Kitco notes near-term tightness has eased versus the squeeze earlier in the rally.
📈 Base Case Outlook (Next 4–8 Weeks)
Trend: We’re in a bull-market correction — momentum currently with sellers — inside a bigger, intact secular uptrend. WSJ + Kitco both frame it as a technical consolidation after a near-vertical ascent.
Range Expectation: $3,500–$4,100 with whipsaws around $4k. The market likely tests $3,750 and could overshoot to $3,500 on negative macro surprises or persistent outflows before attempting a higher-low base.
Bull Re-acceleration Triggers:
(a) USD/real-yield rollover post-Refunding/Fed minutes
(b) A visible reversal in ETF flows
(c) Stabilization in Asia physical premiums
(d) Fresh geopolitical shocks
Bear Extension Risks:
(a) Firmer real yields / stronger USD
(b) Deeper ETF outflows and CTA/systematic supply
(c) Evidence of slower central-bank demand than H1
(d) Soft physical uptake into dips
⚔️ Trade / Hedge Tactics
If Underweight/Flat:
Stagger bids $3,760 → $3,520, scale size smaller into weakness; insist on confirmation (stops above prior day’s high) before adding.
If Long From Higher:
Respect $3,750 — below it, tighten or partially hedge (short miners, long USD vs. FX beta, or buy short-dated puts) targeting $3,500 as a potential flush.
If Momentum Trader:
Let $4,000 decide regime. Sustained reclaims with rising on-balance volume/ETF creations = green light for a bounce to $4,080–$4,150; failure = fade rallies into $3,950–$3,980.
🧭 What I’m Watching Day-to-Day
1️⃣ Treasury refunding headlines (Nov 5) and term-premium reaction.
2️⃣ Fed minutes (Nov 19) and any shift in balance-of-risks language.
3️⃣ GLD/IAU flow tape (creations/redemptions).
4️⃣ Kitco/WSJ desk color on physical tightness and dealer inventories.

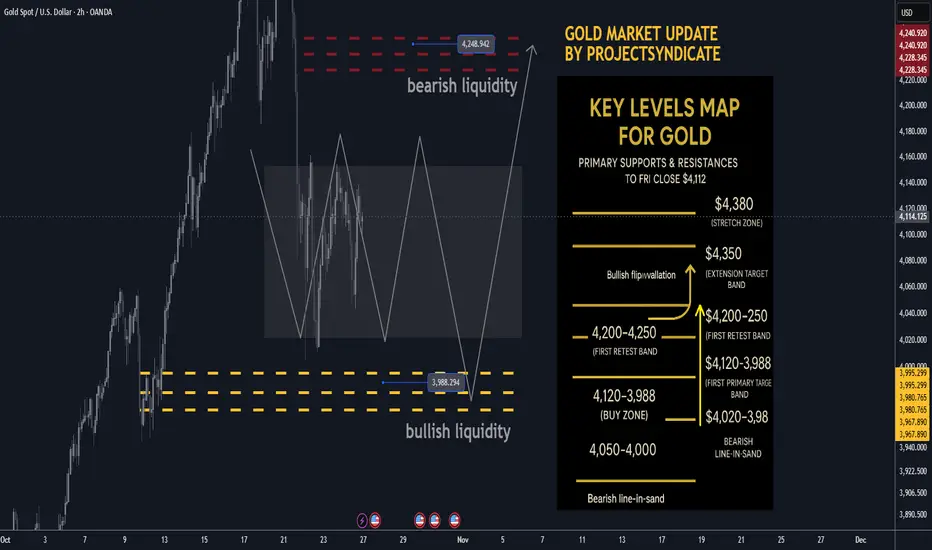
Gold next week Key S/R Levels and Outlook for Traders🔥 GOLD WEEKLY SNAPSHOT — BY PROJECTSYNDICATE
🏆 High/Close: $4,380 → ~$4,112 — lower close within range; momentum cooled but holding the $4,000 handle.
📈 Trend: Uptrend intact > $4,000; oversold into $4.1k—setup favors reflex bounce.
🛡 Supports: $4,120–$4,080 → $4,020–$3,988 (bullish liquidity) → $4,000/3,980 must hold.
🚧 Resistances: $4,200 / $4,250 (bearish liquidity) / $4,300 → stretch $4,350–$4,380.
🧭 Bias next week: Buy-the-dip $4,020–$3,988; momentum regain above $4,200 targets $4,250 → $4,300–$4,350. Invalidation < $3,980 risks a deeper flush to $3,950.
🌍 Macro tailwinds:
• Policy: Easing real yields supportive on dips.
• FX: Softer USD tone = constructive backdrop.
• Flows: Central-bank buying + tactical ETF interest underpin $4k.
• Geopolitics: Trade/tariff & regional tensions keep safety bids alive.
🎯 Street view: Select houses still float $5,000/oz by 2026 on policy easing & reserve-diversification narratives.
________________________________________
🔝 Key Resistance Zones
• $4,200–$4,230 immediate supply from the weekly close
• $4,250 bearish liquidity / primary target
• $4,300–$4,350 extension band
• $4,380 prior spike high / stretch
🛡 Support Zones
• $4,120–$4,080 first retest band below close
• $4,020–$3,988 buy zone (bullish liquidity)
• $4,000 / $3,980 must-hold shelf
________________________________________
⚖️ Base Case Scenario
Expect pullbacks into $4,120–$4,080 and $4,020–$3,988 to attract buyers, rotating price back toward $4,200 then $4,250. Acceptance above $4,250 invites a drive into $4,300–$4,350.
🚀 Breakout Trigger
A sustained push/acceptance > ~$4,250 unlocks $4,300 → $4,350, with room toward $4,380 if momentum persists.
💡 Market Drivers
• Real-yield drift lower (supportive carry backdrop)
• USD softness aiding metals
• Ongoing CB accumulation; ETF flows stabilizing on dips
• Headline risk (trade/geopolitics) sustaining safe-haven demand
🔓 Bull / Bear Trigger Lines
• Bullish above: $4,020–$4,100 (buyers defend pullbacks)
• Bearish below: $3,980 (risk expands; threatens $3,950)
🧭 Strategy
Buy low from bullish liquidity (~$3,988) with a target at $4,250; oversold conditions favor a strong bounce. Add on strength above $4,200 toward $4,300–$4,350. Keep risk tight below $3,980–$4,000 to invalidate.
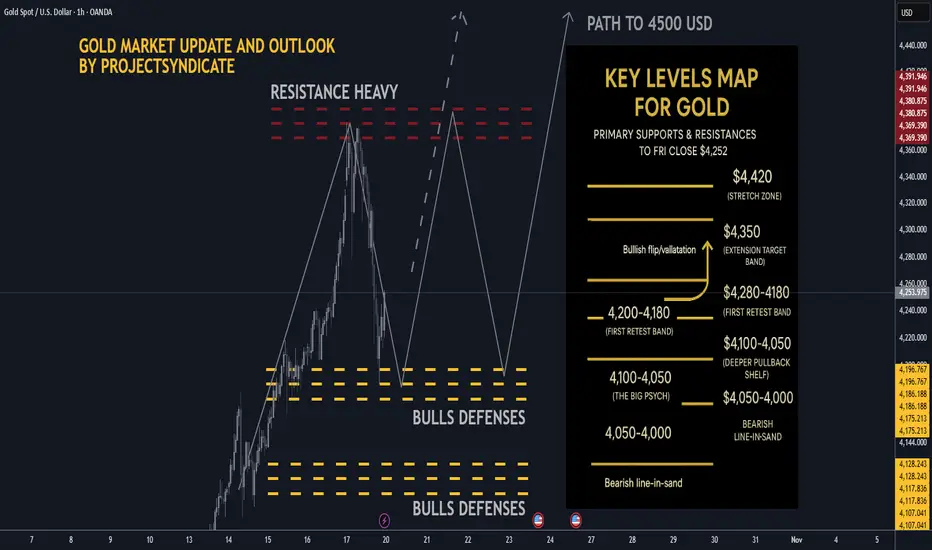
Gold next week: Key S/R Levels and Outlook for Traders🔥 GOLD WEEKLY SNAPSHOT — BY PROJECTSYNDICATE
🏆 High/Close: $4,379 → ~$4,252 — higher close vs. last week’s pullback finish.
📈 Trend: Uptrend intact > $4,000; dip buyers continue to control rhythm.
🛡 Supports: $4,180–$4,140 → $4,100–$4,050 → $4,000 must hold.
🚧 Resistances: $4,260 / $4,300 / $4,350 → stretch $4,380–$4,420.
🧭 Bias next week: Buy-the-dip > $4,140–$4,200; momentum regain targets $4,300–$4,380+. Invalidation < $4,050 → risk $4,000/3,980.
🌍 Macro tailwinds:
• Fed: Markets lean to another cut into Oct 28–29; softer real yields buoy gold.
• FX: DXY under pressure = constructive backdrop.
• Flows: ETF interest & CB buying remain supportive on dips.
• Geopolitics: Tariff/trade and regional risks keep safe-haven bids live.
🎯 Street view: Several houses float $5,000/oz by 2026 scenarios on easing policy & reserve diversification narratives
________________________________________
🔝 Key Resistance Zones
• $4,260–$4,280 near-ATH supply / immediate ceiling from close
• $4,300–$4,350 extension target band
• $4,380–$4,420 stretch zone toward prior spike high and measured extensions
🛡 Support Zones
• $4,220–$4,200 first retest band just below close
• $4,180–$4,140
• $4,100–$4,050 deeper pullback shelf; $4,000 remains the big psych
________________________________________
⚖️ Base Case Scenario
Expect shallow pullbacks into $4,220–$4,140 to be bought, followed by rotation back into the $4,260–$4,300 resistance stack for an ATH retest.
🚀 Breakout Trigger
A sustained push/acceptance > ~$4,280 unlocks $4,300 → $4,350, with room toward $4,380–$4,420 if momentum persists.
💡 Market Drivers
• Fed cut expectations into late Oct(lower real yields = gold tailwind
• USD softness / DXY sub-100 tone supports metals
• Ongoing central-bank bullion demand; ETF inflows stabilizing
• Geopolitics & trade/tariff headlines keeping safety bids active
🔓 Bull / Bear Trigger Lines
• Bullish above: $4,140–$4,200
• Bearish below: $4,100–$4,050 risk expands under $4,000
🧭 Strategy
Accumulate dips above $4,140–$4,200.
On breakout > $4,280, target $4,300–$4,350+. Maintain tight risk under stepped supports; invalidate momentum below $4,050–$4,000.
________________________________________
GAMMA SQUEEZE: Why Gold Prices will hit 5 000 + USDBottom line
If 1% of Treasuries ($278B) rotates into gold, $5,000/oz is not only plausible—it sits inside the low end of what flow math + today’s market microstructure can deliver. The path (and whether we print $8k+ spikes) hinges on how much of that flow shows up as short-dated calls—because that is what turns steady demand into a self-feeding gamma loop.
________________________________________
Executive summary
• A 1% rotation out of U.S. Treasuries is roughly $278B of new gold demand (using SIFMA’s latest estimate that Treasuries outstanding ≈ $27.8T).
• At today’s context (gold ~$3.53k/oz on Sep 2–5, 2025), $278B buys ~79.4M oz ≈ 2,471 tonnes; at $5k/oz it buys ~55.6M oz ≈ 1,729 tonnes. For scale, annual mine supply ≈ 3,661 t and total above-ground stocks ≈ 216,265 t (bars/coins+ETFs ≈ 48,634 t).
• That flow is huge relative to both quarterly demand value (Q2’25 ≈ $132B) and typical daily trading turnover (~$290B/day across OTC, futures & ETFs). Even spread out, it materially tilts the tape; if concentrated and routed via options, it can produce dealer hedging feedback—i.e., a gamma squeeze.
• Price targets (framework, not prophecy):
o Conservative flow-only: +40–60% → $4,900–$5,600/oz
o Base case (flow + some options reflexivity): +70–110% → $6,000–$7,500/oz
o Squeeze/overshoot window (short-dated calls heavy): episodic spikes >$8,000/oz possible, but hard to sustain without continued flow.
These bands come from scaling prior ETF-driven episodes (notably ~877 t ETF inflow in 2020 alongside a ~+36% price run) and sizing against current market depth, while layering a realistic options-hedging multiplier (details below).
________________________________________
1) What a “gamma squeeze” in gold means (and why it can happen)
Definition (in one line): When call buying concentrates near-dated, near-the-money strikes, dealers short gamma must buy futures as price rises (and sell if it falls) to keep neutral—this feedback accelerates upside (“gamma squeeze”).
Why it’s plausible in gold right now:
• The listed derivatives stack is large. As of Fri, Sep 5, 2025, CME’s daily bulletin shows COMEX gold options open interest ~0.80M contracts (calls ~0.49–0.69M; puts ~0.30–0.38M depending on line item), each on 100 oz—i.e., option OI notionally ties to ~2,400–2,800 t of gold. That is the powder keg a call-wave can act on.
• Implied vol is moderate (GVZ ~18 for 30-day GLD options), so vega is “affordable,” gamma is punchy in the front end.
• CME’s CVOL framework and open-interest tools confirm where strikes/expiries cluster; when OI stacks close to spot and near expiry, market-wide gamma becomes most sensitive.
Back-of-envelope hedging math (illustrative):
For a 30-day, at-the-money option with σ≈18%, the Black-Scholes gamma is about
Γ≈ϕ(0)SσT≈0.399S⋅0.18⋅30/365\Gamma \approx \frac{\phi(0)}{S\sigma\sqrt{T}} \approx \frac{0.399}{S\cdot 0.18 \cdot \sqrt{30/365}}.
At S=$3,500/oz, that’s ~0.0022 per $. A +1% move (+$35) bumps delta by ~0.077 per option. If just 150k near-ATM front-tenor calls are held by customers (dealers short gamma), hedge buying ≈ 150,000 × 100 oz × 0.077 ≈ 1.16M oz ≈ 36 t—per 1% price pop. That’s only a slice of total OI; a broader crowding raises this number. Compare with ~2,500 t/day of global turnover and you can see how concentrated dealer hedging can move price intraday.
________________________________________
2) Sizing a 1% Treasury → gold rotation
Treasury base: latest SIFMA comment put U.S. Treasuries outstanding ≈ $27.8T (Q1’25). 1% → $278B.
Gold the rotation would buy:
• At $3,500/oz: $278B → ~79.4M oz → ~2,471 t
• At $5,000/oz: $278B → ~55.6M oz → ~1,729 t
For scale:
• Annual mine supply (2024): ~3,661 t; total supply (incl. recycling): ~4,974 t. A $278B buy ticket equals 47–67% of a year’s mine output (depending on price), or ~35–50% of total annual supply.
• ETF precedent: In 2020, ~877 t net ETF inflow (~$48B) coincided with a ~+36% move from Jan→Aug 2020. Today’s $278B is ~5–6× that dollar size (and ~2–3× the tonnes, depending on price), hinting at large flow-driven upside even before any options reflexivity.
• Turnover lens: WGC puts average daily trading across OTC/futures/ETFs at roughly $290B/day recently. A $278B program is ~one day’s global turnover. Pushed quickly (or skewed to options), that’s impactful; stretched over months, the price impact softens but still accumulates.
Futures-only lens (capacity check):
At $3,500/oz, one COMEX GC contract notionally = $350k (100 oz). $278B equals ~794k GC contracts. Current futures OI is ~0.49M contracts, so this exceeds all COMEX OI—you cannot push that much via futures quickly without major repricing. Even at $5,000/oz (~$500k/contract), it’s ~556k contracts, still comparable to the entire OI.
________________________________________
3) Price-target framework (with the math that gets you there)
Think of the price in layers: (A) base flow impact + (B) options-gamma reflexivity + (C) second-round effects (short-covering, momentum, FX, central banks).
A) Flow-only impact (calibrated to 2020)
• 2020 anchor: 877 t ETF inflow ↔ ~+36% price. Using a simple proportionality, 1,729–2,471 t (your $278B) maps to ~+71% to +101%.
• Apply to spot ≈ $3,532/oz (early Sep 2025):
o +71% → ~$6,050/oz
o +101% → ~$7,100/oz
Caveat: 2020 had unique macro tailwinds, so I treat this as upper-middle of base range.
B) Options reflexivity / gamma squeeze overlay
If 20–30% of the $278B rotation expresses via short-dated calls (common for levered macro expressions), dealer hedging can amplify flow impact:
• From the OI math earlier, a mere 1% up-move can demand ~20–40 t of dealer hedge buying if near-ATM OI is thick. A 3–5% multi-day grind can easily cascade into 100–200 t of incremental buying from hedgers alone. That’s non-trivial vs. mine supply pace, and it pulls forward upside.
• Result: add another +10–20% to the flow-only levels during a squeeze while it lasts.
C) Second-round effects
• Central banks: still persistent net buyers (>1,000 t/yr pace in recent years), tending to fade dips rather than rallies—a structural bid.
• FX & rates: the GVZ ~18 regime means bursts of vol aren’t “expensive”; a weakening USD or policy shocks can tilt the target higher.
Putting it together—scenario bands
Scenario Assumptions Implied move Target
Conservative $278B spread over 6–9 months, mostly physical/ETFs; limited options +40–60% $4,900–$5,600
Base case 50–70% to physical/ETFs, 30–50% to futures/options; moderate dealer short-gamma +70–110% $6,000–$7,500
Squeeze / overshoot Short-dated call concentration, dealers persistently short gamma; flow bunches in weeks +120–>150% (episodic) >$8,000 (brief spikes)
$5,000 target is well within the conservative band if any meaningful fraction of the $278B pushes through quickly, even without a full-blown gamma loop.
________________________________________
4) Why the market could mechanically gap higher
• Market size vs. flow: Q2’25 total demand value = $132B. Dropping $278B into this ecosystem is a 2× quarterly shock.
• Trading capacity: $278B ≈ one full day of global turnover; price impact is convex when the risk-absorption (dealers, miners, recyclers) cannot scale linearly day-by-day.
• Derivatives gearing: With ~0.8M options contracts OI outstanding and futures OI ~0.49M, even a partial shift into calls forces hedge-buys on the way up, the hallmark of a squeeze.
________________________________________
5) Key risks / reality checks
• Time profile of the rotation matters. A slow, programmatic shift spreads impact; a front-loaded move can overshoot then mean-revert as gamma decays.
• Elasticity is asymmetric. Jewelry/fabrication falls at high prices (demand destruction), recycling rises, both cushioning extremes. That moderates how long >$7k can persist without continued flow.
• Volatility regimes change. If GVZ spikes to high-20s/30s, option premia jump, slowing new call demand; conversely, put demand can flip net gamma long for dealers, dampening squeezes.
________________________________________
References (most load-bearing)
• Treasury base: SIFMA—Treasuries outstanding $27.8T (Feb 2025).
• Gold supply & stocks: WGC—Above-ground stock 216,265 t (end-2024); bars/coins+ETFs 48,634 t; mine supply 2024 ≈ 3,661 t.
• Trading turnover: WGC—gold trading ≈ $290B/day.
• ETF precedent: WGC—2020 ETF inflows 877 t (~$47.9B) alongside major price rise.
• Current price context: Reuters—record highs $3,532/oz set in early Sep 2025. (
• Options/hedging plumbing: CME daily bulletin (Sep 5, 2025) showing gold options OI ~0.8M contracts; CME CVOL/tools; Cboe GVZ ~18 as 30-day IV.
________________________________________

September 2025 Market Summary Gold and ForexProjectSyndicate Market Summary September 2025
📊 MTD performance
🟡 GOLD (XAUUSD): 3,759.65 | +286.65 (+8.31%)
💶 EURUSD: 1.1702 | +16 pips (+0.14%)
💷 GBPUSD: 1.3392 | −112 pips (−0.83%)
💴 USDJPY: 149.19 | +211 pips (+1.43%)
📈 SPX: 6,637.97 | +236.46 (+3.69%)
📈 NDX: 24,503.57 | +1,483.10 (+6.44%)
________________________________________
🗞 September overview
• 🇺🇸 The Fed cut 25 bps on September 17 and flagged the possibility of further cuts this year, reinforcing a softer USD bias and boosting gold demand.
• 🇪🇺 The ECB held rates on September 11, though left the door open for easing later.
• 🇬🇧 The Bank of England held rates and slowed quantitative tightening on September 18.
• 🇯🇵 The BoJ maintained a “hawkish hold” on September 19, started unwinding ETF/REIT holdings, and signaled possible rate risks into October — supporting JPY on abrupt USD strength.
• 🟡 Gold made a fresh intramonth high near ~$3,790, before settling slightly lower.
• Stronger U.S. economic data mid-month (jobs, yields) briefly undercut rate cut expectations, leading to a temporary gold dip, but the momentum has largely resumed.
• Tariff announcements and trade-policy uncertainty added safe-haven tailwinds to gold.
________________________________________
🟡 Gold Market Overview – September 2025
✨ Key Highlights & Drivers
• All-time high revisit: Spot gold pushed toward $3,790 mid-month on renewed enthusiasm for Fed easing and weaker USD.
• Volatility around economic surprises: Upside surprises in US data (jobs, GDP) triggered brief USD strength that pressured gold, but the downside was limited.
• Fed narrative remains gold’s ally: The dovish pivot (25 bps cut + future cuts flagged) continues to lend structural support to gold.
• ETF & institutional flows: Inflows into gold ETFs have reaffirmed investor appetite for safe-haven exposure.
• Risk / geopolitical spillovers: Oil price jitters, trade frictions, and general macro uncertainty underpin demand for non-correlated assets.
• Technical posture: After surging, gold has found interim support in the region of ~$3,650–3,700, with resistance clustering near $3,800. A sustained break above the latter could open targets toward $3,900+.
📊 Performance Recap
Gold has posted one of its strongest monthly performances of 2025, currently up ~8.7 % MTD.
Stronger parts of the rally were clustered around rate cut confirmation and safe-haven demand spikes.
🔍 Risks & Watch-Outs
• A surprise resurgence in U.S. economic strength (inflation, jobs) could push rate markets back toward dovish skepticism, pressuring gold.
• A re-strengthening USD (driven by rates or yield spreads) will be headwind for dollar‐priced gold.
• Central bank actions: further buying or selling by official sectors could tilt balance.
• Technical overextension: short-term pullbacks or consolidations are plausible given the sharp run-up.
________________________________________
💱 FX Landscape – September 2025
• EURUSD: The pair remains stuck under ~1.1700, recovering modestly from USD spikes but lacking strong directional conviction.
• GBPUSD: Under pressure through the month, sliding toward 1.3350 as sterling weakens on yield differentials and global risk dynamics.
• USDJPY: Strength in yields and risk dynamics have nudged USDJPY higher, though BoJ vigilance and intervention risk temper runaway moves.
Broader theme: while risk sentiment supports carry / USD strength, central bank policy cycles and macro surprises are injecting volatility and preventing runaway trends.
________________________________________
📝 Summary & Key Takeaways
✅ What Worked in September
• Gold leveraged dovish central bank messaging and USD softness to consistently outperform across risk regimes.
• Positioning toward safe havens paid off in a month marked by macro surprises and geopolitical noise.
• FX markets remained choppy, with no clear trending momentum — caution was rewarded.
⚠️ What to Watch Going Forward
• U.S. data flow — especially inflation, jobs, and PCE — could reshape Fed expectations and thus gold/FX direction.
• USD momentum — a reversal in dollar strength could compress gold gains; sustained USD weakness could accelerate the bull run.
• Intervention / central banks — any surprises from BoJ, PBoC, or central banks stepping into gold or FX markets could upend positioning.
• Technical zones — if gold can break and hold above $3,800, it may open new leg toward $3,900+; failure may invite a pullback toward $3,650–3,700.

Xmoon Indicator Tutorial – Part 2 – Pivots🔻🔻🔻+ Persian translation below 🔻🔻🔻
🔹 What Is a Pivot?
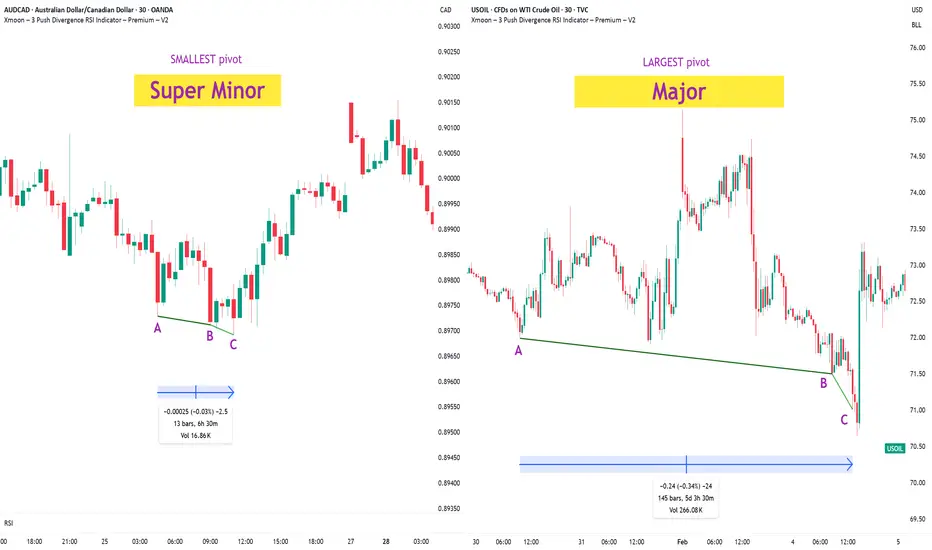
In the Xmoon strategy, every high or low that forms on the chart is considered a pivot.
The number of candles between two highs or two lows defines the size of the pivot.
The more candles there are between them, the larger and more reliable the pivot becomes.
🔸 Types of Pivots in the Xmoon Indicator Settings
In the settings panel, you can choose which types of pivots the patterns should be based on.
There are 4 pivot types :
• Super Minor → the smallest pivot
• Minor
• Mid Major
• Major → the largest pivot
⏫ As you move from Super Minor to Major, the strength of the pivot increases — but the number of signals decreases.
⚖️ Choosing the Right Pivot = Your Trading Style
• Want more signals? → Use smaller pivots like Minor or Super Minor
• Prefer higher accuracy and lower risk? → Use larger pivots like Major or Mid Major
💡 Pro Tip: On higher timeframes, pivots perform better and help reduce risk.
✍️ Summary
If you're looking for frequent signals, trade on lower timeframes, and can handle higher volatility and pressure, then smaller pivots like Super Minor and Minor are a better choice.
But if you prefer quality over quantity, work on higher timeframes, and value clarity, peace of mind, and higher success rates, then larger pivots like Mid Major and Major are the way to go.
📣 If you have any questions or need guidance, feel free to ask us. We’d be happy to help.
🔻🔻🔻 Persian Section – بخش فارسی 🔻🔻🔻
🔹 پیوت چیست؟
در استراتژی ایکسمون، هر قله یا درهای که روی چارت شکل میگیرد، یک پیوت محسوب می شود
فاصله زمانی بین دو قله یا دو دره (یعنی تعداد کندلهایی که بینشان قرار دارد) اندازهی پیوت را مشخص میکند
هرچه تعداد کندل بین دو سقف یا کف بیشتر باشد، آن پیوت بزرگتر و معتبرتر است
🔸 انواع پیوت در تنظیمات اندیکاتور ایکسمون
در بخش تنظیمات، میتوانید مشخص کنید که الگوها بر اساس چه نوع پیوتهایی شناسایی شوند
ما ۴ نوع پیوت داریم
• سوپر مینور ← کوچکترین پیوت
• مینور
• میدماژور
• ماژور ← بزرگترین پیوت
⏫ هرچه از سوپرمینور به سمت ماژور برویم، قدرت پیوت بیشتر میشود، ولی تعداد سیگنالها کمتر می شود
⚖️ انتخاب پیوت مناسب = سبک معاملاتی شما
• به دنبال سیگنال زیاد هستید ← پیوت کوچک تر = مینور و سوپرمینور
• به دنبال دقت بیشتر و ریسک کمتر هستید← پیوت بزرگتر = ماژور و میدماژور
💡 نکته حرفهای: در تایمفریمهای بالا، پیوتها عملکرد بهتری دارند و به کنترل ریسک کمک میکنند
✍️ جمعبندی
اگر دنبال سیگنالهای زیاد هستید، در تایمفریمهای کوچکتر کار میکنید و میتونید نوسانات و فشار روانی بالاتر رو تحمل کنید، پیوتهای کوچکتر مثل سوپرمینور و مینور انتخاب مناسبتری هستند
اما اگر در تایم فریم های بزرگتر کار می کنید و کیفیت سیگنال، آرامش ذهنی و احتمال موفقیت برایتان مهمتر است، پیوتهای بزرگتر مثل میدماژور و ماژور انتخاب بهتری هستند
📣 اگر سوالی دارید یا نیاز به راهنمایی دارید، خوشحال میشویم از ما بپرسید
با کمال میل در خدمتتان هستیم
Xmoon Indicator Tutorial – Part 1 – Strategy🔻🔻🔻+ Persian version below🔻🔻🔻
📘 Xmoon Indicator Tutorial – Part 1
🎯 3Push Divergence RSI Strategy
🔥 The core of the Xmoon indicator
is built upon one of the most powerful strategies in technical analysis:
The advanced 3Push Divergence RSI pattern
🔁 A pattern that typically appears at key market turning points.
📉 When the price moves in the same direction three consecutive times on pivot points (e.g., making lower lows or higher highs), but the RSI shows the opposite behavior, it indicates a clear divergence !
💡 This divergence can act as a strong signal for a potential trend reversal.
🎯 The Xmoon Indicator is designed to detect this critical moment.
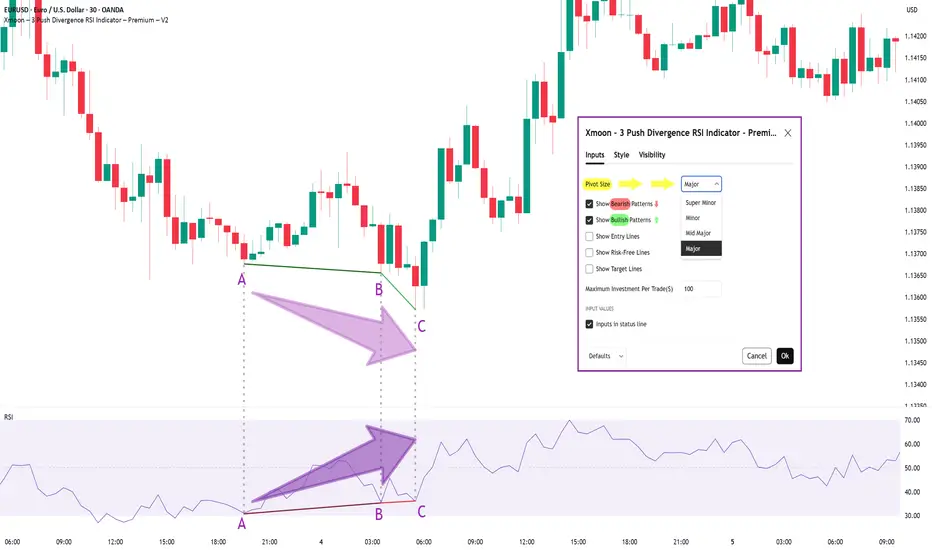
⚙️ Xmoon Indicator Settings Panel
The Xmoon settings panel offers the following options:
🔸 Pattern Type Selection: In the first and second lines, you can specify which type of pattern should be displayed: only bullish patterns or only bearish ones. You can also check both options.
🔸 Pivot Type Selection: From the dropdown menu, you can choose one of four pivot types:
“Super Minor”, “Minor”, “Mid-Major”, and “Major”, ordered from smallest to largest.
📌 Educational Note: The greater the distance (in candle count) between two lows or two highs, the larger the pivot is considered.
A Major Pivot is the largest among them.
✅ Larger Pivot = Higher Accuracy
❗ But naturally = Fewer Signals
📣 If you have any questions or need guidance, feel free to ask us. We’d be happy to help.
🔻🔻🔻بخش فارسی – Persian Section 🔻🔻🔻
📘 آموزش اندیکاتور ایکسمون - قسمت اول
🎯 استراتژی سهپوش واگرایی (3Push Divergence RSI)
🔥 هسته اصلی ایکسمون
بر پایه یکی از قویترین استراتژیهای تحلیل تکنیکال طراحی شده است
الگوی پیشرفته سهپوش واگرایی
🔁 الگویی که معمولاً در نقاط چرخش مهم بازار ظاهر میشود
📉 وقتی قیمت سه بار پشت سر هم روی نقاط پیوت ، در یک جهت حرکت میکند (مثلاً کفهای پایینتر یا سقفهای بالاتر میسازد) ، اما آر-اِس-آی خلاف آن را نشان میدهد، یعنی یک واگرایی آشکار رخ داده است
💡این واگرایی میتواند سیگنالی قوی برای برگشت روند باشد
🎯 اندیکاتور ایکسمون این لحظه را شناسایی میکند
⚙️ پنجره تنظیمات اندیکاتور ایکسمون
در بخش تنظیمات اندیکاتور ایکسمون، امکاناتی در اختیار شما قرار دارند
🔸 انتخاب نوع الگو: در خط اول و دوم میتوانید مشخص کنید چه نوع الگویی نمایش داده شود
فقط الگوهای صعودی یا فقط نزولی. همچنین می توانید تیک هر دو گزینه را بزنید
🔸 انتخاب نوع پیوتها: از پنجره کشویی بالا، می توانید یکی از ۴ نوع پیوت را انتخاب کنید
پیوت ها به ترتیب از کوچک به بزرگ عبارتند از: سوپر مینور ، مینور ، میدماژور و ماژور
📌 نکته آموزشی: هرچه فاصله بین دو کف یا دو سقف بیشتر باشد (یعنی تعداد کندلهای بین آنها زیادتر باشد)، آن پیوت، بزرگتر محسوب میشود
پیوت ماژور از بقیه بزرگ تر است
✅ پیوت بزرگتر = دقت بالاتر
❗ اما طبیعتاً = تعداد سیگنال کمتر
📣 اگر سوالی دارید یا نیاز به راهنمایی دارید، خوشحال میشویم از ما بپرسید
با کمال میل در خدمتتان هستیم
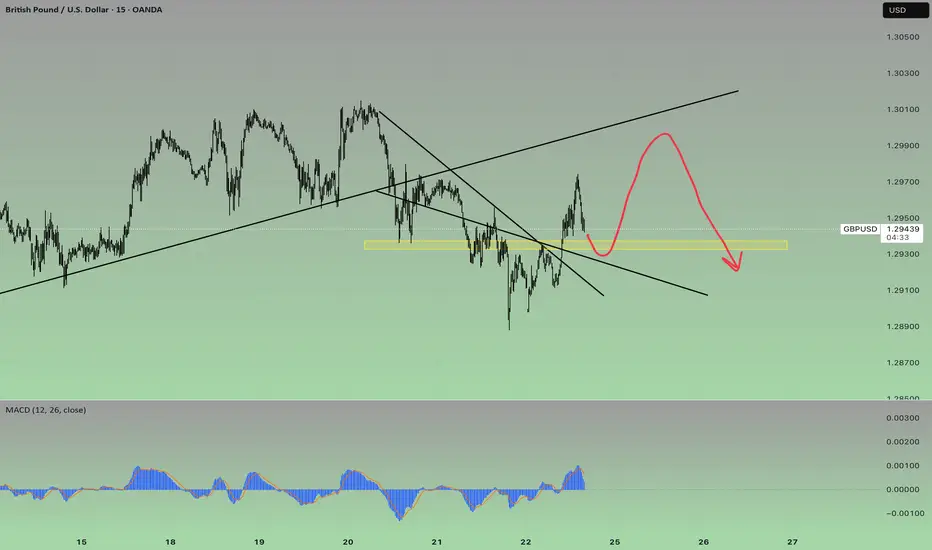
Pedramfxtrader | GBPUSD BUY We have a specific type of divergence on the 1-hour timeframe ⏳, indicating a potential drop 📉 in the higher timeframe. On the other hand, the lower 15-minute timeframe 🕒 gives us a buying perspective 📈. So, the analysis will be as shown in the image.
#GBPUSD #ForexTrading #PriceAction #ForexSignals #TradingAnalysis 💹
TradingView Telegram Webhook Alert [TradingFinder] No Extra Code🔷 Introduction
In this tutorial, you will learn how to send TradingView alerts automatically and instantly to Telegram without the need for coding. This system is based on the TradingView webhook, which enables receiving trading signals in Telegram channels.
Using this method, you can receive buy and sell signals for Forex, Crypto, and Stocks without any delay. The Telegram alert bot supports real-time TradingView alerts and is compatible with all technical indicators, price-based signals, and Pine Script alerts.
This method allows you to establish a direct and fast connection between TradingView and Telegram without requiring any programming knowledge. Additionally, this tool is free and does not require registration.
In this tutorial, you will first create a Telegram bot to receive trading alerts, then connect the TradingView webhook to Telegram, and finally, learn how to manage trading signals automatically and without delay.
🔷 HOW TO SET UP TRADINGVIEW ALERT WEBHOOK FOR TELEGRAM WITHOUT CODING?
Now, let’s go through the step-by-step process of setting up TradingView alerts to be sent instantly to Telegram using a webhook, without any coding required.
🔶 Step 1: Find BotFather on Telegram
To create a new bot for receiving TradingView alerts, you first need to access BotFather on Telegram.
Open the Telegram app or go to Telegram Web.
In the search bar, type @ BotFather and select the verified BotFather account (as shown in the image).
Click on BotFather to start creating your bot.
This bot will help you generate an API token that is essential for setting up the webhook connection between TradingView and Telegram.
🔶 Step 2: Create a New Telegram Bot Using BotFather
Once you have opened BotFather on Telegram, follow these steps to create your bot :
Click the START button to activate BotFather.
Type /newbot and press Enter to create a new bot.
BotFather will ask you to choose a name for your bot. Enter a unique name (e.g.,Alert TV to Telegram).
Next, you need to choose a username for your bot. It must end with bot (e.g., Alert_TV_bot).
Once the bot is successfully created, BotFather will provide you with a unique API token. This token is essential for connecting your bot to TradingView Webhook. Keep it secure and do not share it with anyone.
🔶 Step 3: Add the Bot as an Admin to Your Telegram Channel
Now that you have created your bot, you need to add it as an admin to your Telegram channel where you want to receive TradingView alerts.
Follow these steps :
Search for your bot in Telegram by typing its username (e.g., @Alert_TV_bot) in the search bar.
Open your bot's profile and click "Start" to activate it.
Create a Telegram channel (or use an existing one) where you want the alerts to be sent.
Open the channel settings and go to Administrators > Add Admin.
Search for your bot using its username and select it.
Grant the necessary permissions :
Enable "Manage Messages" so the bot can send alerts.
(Optional) Enable "Change Channel Info" if you want the bot to update channel details automatically.
Click Save to confirm the changes.
🔶 Step 4: Generate the Webhook URL for TradingView (Public & Private Channels)
To send TradingView alerts to Telegram, you need to generate a Webhook URL. The format of this URL depends on whether you are sending alerts to a public channel or a private channel. Additionally, the message text must be URL Encoded to ensure it is processed correctly.
🔹 Webhook URL for Public Telegram Channels
If your Telegram channel is public, use the following format for your webhook URL :
api.telegram.org
Replace the placeholders with :
→ The API token from BotFather.
→ The username of your public Telegram channel (without the "@" symbol).
→ The URL Encoded alert message.
📌 Example :
If your bot token is 123456789:ABCDefGHIjklmnopQRSTuvwxYZ and your public channel username is TradingAlertsChannel, the webhook URL will be :
api.telegram.org
🔹 Webhook URL for Private Telegram Channels
If your Telegram channel is private, you cannot use a username (@channel_name). Instead, you must use the chat ID.
Follow these steps :
🔸 Step 1: Get the Chat ID of the Private Channel
There are two ways to get your private channel's chat_id :
Method 1: Using @ userinfobot
Forward any message from the private channel to @ userinfobot in Telegram.
The bot will reply with details, including the chat_id (which is a negative number, e.g., -1001234567890).
Method 2: Using Telegram API (getUpdates)
Open a browser and enter the following URL :
api.telegram.org
Replace with your bot’s API token from BotFather.
Press Enter, and you will see a response containing messages, including the chat_id of your private channel.
The chat_id will look something like -1009876543210.
🔸 Step 2: Use the Webhook URL Format for Private Channels
Once you have the chat_id, use the following webhook format :
api.telegram.org
Replace the placeholders with :
→ The API token from BotFather.
→ The numeric chat ID of your private channel (e.g., -1009876543210).
→ The URL Encoded alert message.
📌 Example :
If your bot token is 123456789:ABCDefGHIjklmnopQRSTuvwxYZ and your private channel ID is -1009876543210, the webhook URL will be :
api.telegram.org
🔶 Step 5: Configure Webhook in TradingView Alerts
Now that we have generated the Webhook URL, the next step is to configure TradingView alerts to send real-time notifications to Telegram.
Follow these steps to set up the webhook :
Open the TradingView Alert Settings
•Go to TradingView and open the chart for the asset you want to track (e.g., BTCUSD).
•Click on the Alert (⏰) button at the top of the screen.
•In the alert settings window, go to the "Notifications" tab.
Enable Webhook URL
•Check the box for "Webhook URL" to enable webhook notifications.
•Paste your Telegram Webhook URL into the box.
Example for a public channel :
api.telegram.org
Example for a private channel (with chat ID -1009876543210) :
api.telegram.org
Customize Your Alert Message
Make sure your alert message is URL Encoded (e.g., spaces should be %20).
Example message :
Hello, This is a test alert!
URL Encoded Format :
Hello%2C%20This%20is%20a%20test%20alert%21
Save the Alert
•Click "Save" to activate the TradingView alert.
•Now, whenever the alert condition is met, TradingView will send a message to Telegram via the webhook.

The LeapJust an idea I am working on…..
Here is an initial set of indicators that I have put together for a strategy. Try it out if you want.

$BTC consolidation continues as we approach HUGE UP/DOWN EventI know we cant predict it but we can speculate. I use many many strategies and analytic built into trdingview and many other trading sites tools for trading cryptocurrency and FX stocks etc.. To the point. Using this ML by LuxAlgo sows a bad pic for BTC on 1D and 1W BUT the 1H is showing up trend to 130k~ the opposite for the 1D down to possibly 55k then the 1W is more SHARP down to $35k :L REMEMBER this is a Machine learning bot not the best thing to guess with. BUT it does work for what its made to do and I have made many positive gains with this tool alone or with MACD or RSI or sometimes other ML scrips or analytics.
So please put this over your BTC chart and see what LUX ALGOs ML chart as shown in idea on Left middle side. Check ho various it is not just on BTC but also try ETH and other smaller markets or memes like PEPE or even BONK etc or oter chain types POL(was MATIC) or DOT or ATOM etc. See and check the change between short 1Min - 1Hour vs 1Day - 1Month.
Note THIS indication isn't Correct! No IDEA is not 100%. Remember that. Remember "What WILL BE WILL BE" or "WHAT HAPPENS WILL HAPPEN" as my nan always said if we anxious of future events! It set me free literally as you realize its always going to Be what it Will BE! It cannot be changed! You think it can. and you CAN if you realize this. Then you can act with knowledge that you much make change in the NOW present to make that change you wanted in the Future.
If you manifest it it can happen. and that makes it What will be will be ore true. if you didn't do it it would still BE what it will be at that time. It cant change via thought. It can chnge by action before the "future".
ANyway share BTC knowlede share ideas sty strong! This isnt going to happen anyway...

TAOBOT bouncing from my boxTAOBOT bouncing from my box. This coin can fly once TAO reaches new all time high

TAOBOT - Flip this and higher!TAOBOT flip this and it will go higher. Im already in. This coin has lots of potential once TAO starts pumping. 5x from here is fud.

BTCUSD AUTOBOT 15minThis is a description of the 15min BTC AutoBot strategy written in Pine Script, which is designed for automatic trading on the Bitcoin (BTC) market. It uses Exponential Moving Averages (EMAs) and allows the bot to make trades based on specific conditions without requiring manual intervention. The bot can only be used with a webhook, ensuring automated execution. Below is an explanation of each part of the script:
Overview:
Timeframe: The strategy works on the 15-minute chart for Bitcoin.
Trade Type: It uses two EMAs (25 and 200) to decide when to buy (Long) or sell (Short).
Risk Management: Take Profit and Stop Loss are configurable as percentages, helping automate risk management.
User Inputs:
shortEmaLength: The length of the shorter EMA (default = 25).
longEmaLength: The length of the longer EMA (default = 200).
takeProfitPct: Percentage for take profit (default = 1%).
stopLossPct: Percentage for stop loss (default = 0.5%).
These inputs allow users to configure the strategy according to their preferences.
EMA Calculations:
shortEma: The 25-period EMA is calculated on the close price of the asset.
longEma: The 200-period EMA is also calculated based on the close price.
Conditions for Trade Signals:
Long (Buy) Condition: When the 25 EMA crosses above the 200 EMA, a "buy" signal is generated (crossover).
Short (Sell) Condition: When the 25 EMA crosses below the 200 EMA, a "sell" signal is generated (crossunder).
Entry and Exit Conditions:
Long Entry: When the buy signal occurs (crossover), the bot enters a long position at the current market price.
Take Profit: The take profit price is calculated as the entry price plus the configured percentage.
Stop Loss: The stop loss price is calculated as the entry price minus the configured percentage.
The bot automatically exits the position when the take profit or stop loss levels are reached.
Short Entry: When the sell signal occurs (crossunder), the bot enters a short position at the current market price.
Take Profit: The take profit price is calculated as the entry price minus the configured percentage.
Stop Loss: The stop loss price is calculated as the entry price plus the configured percentage.
The bot automatically exits the position when the take profit or stop loss levels are reached.
Key Features:
Automated Execution: The bot can only be used with a webhook, meaning all trades are executed automatically based on the defined conditions.
No Manual Trading: This strategy is designed for automation, with no need for manual intervention.
Risk Management: Configurable take profit and stop loss settings help manage risk effectively.
How It Works:
Once configured, the bot will continuously monitor the price and the two EMAs on the 15-minute chart.
Whenever the crossover or crossunder conditions are met, the bot will automatically place a buy or sell order, respectively.
The bot will then monitor the price and exit the position when the take profit or stop loss levels are reached.
This setup ensures that trades are executed in a fully automated manner, making it ideal for users who prefer to have a bot manage their trades according to set conditions.

Trading opportunity for BANANAUSDTBased on technical factors there is a Buy position in :
📊 BANANAUSDT
🔵 Buy Now
🪫Stop loss 49.40
🔋Target 1 72.00
🔋Target 2 85.00
🔋Target 3 99.00
💸RISK : 1%
We hope it is profitable for you ❤️
Please support our activity with your likes👍 and comments📝

How to Send Alerts from Tradingview to Telegram I found a new way for sending alerts from tradingview to telegram channel or telegram group by using webhook. I’ve been looking for a while and most of the ways had problems. Some of them had delays in sending the alerts and were not secure because they were using public bots. Some of them required money and were not free. Some of the ways needed coding knowledge. The way I recommend does not have these problems.
It has three simple steps:
1. Creating a telegram channel or group;
2. Creating a telegram bot by using botfather;
3. Signing in/up in pipedream.com.
I made a video for presenting my way. I hope it was helpful and if you have any questions make sure to comment so I can help you.
Thank you!

My rec who loses too much on trading. Relax and gain knowledge I recommend to stop trading who loses too much. Instead you can run AI trading bot in OKX platform. My referral okx.com
1) Choose Future DCA Martingale
2) Go to AI strategy tab
3) Choose ETHFI/USDT perpetual (with other pairs you should put big amount, but with like ETHFI, TON you can only put around 30 coins)
4) Choose Mid-term moderate bullish (Short-term aggressive bullish, doesn’t work well for me and haven’t tried long-term last one from list. Only use mid-term, that’s should be enough)
5) Don’t touch leverage, leave as is
6) Put amount of sum (I actually put all what I have)
7) But you should check after BTC movement, if BTC in downtrend stop the bot, if it reversal to uptrend then run again AI bot. With other all bots, didn’t get the same result.
8) That is it.
Just wait and you can see how AI earns for you.
This is better than lost money every day. With this method you can relax. When you will ready and gained trading knowledge, you can return to analysis and to earn more. You can also select SPOT DCA Martingale and same settings.
I think this method fits to new in trading system.
This is my referral okx.com
