OPEN: base building for upsideOpendoor Technologies remains a highly volatile stock, but current price action suggests a potential medium-term reversal. The company continues adjusting its business model to a high-rate environment, focusing on cost control and cash flow stabilization. The US housing market is showing early signs of normalization, while expectations of future monetary easing increase investor interest in deeply oversold growth stocks. OPEN trades far below its historical highs, making it highly reactive to improving macro conditions or positive earnings developments.
Technically, the price has broken out of a long-term descending channel with a strong impulsive move. After the breakout, the stock entered a consolidation phase, forming a price accumulation zone above the broken trendline. Price holds above key EMAs, supporting a bullish structure. The primary scenario favors trend continuation after accumulation, with gradual movement toward higher target zones. The scenario is invalidated if price falls back below the breakout area and holds there.
Braekout

USDCHF: when the safe haven loses its edgeUSDCHF remains attractive as global expectations around monetary policy shift. Markets are increasingly pricing a softer tone from the Fed later in the year, while demand for safe-haven assets like the Swiss franc continues to fade. Switzerland’s low inflation and limited growth outlook reduce CHF appeal, opening room for USD recovery, especially against low-yield currencies.
From a technical perspective, price has formed a base after a sharp decline. Higher lows indicate a developing bullish structure. Price is holding above short-term EMAs, and the former resistance zone has turned into support. The current area represents a retest aligned with structure and Fibonacci levels. Rising volume on advances versus pullbacks supports the bullish continuation scenario.
Trading plan: as long as price holds above the retest zone and confirmation appears, long positions are favored. The first target is a move toward recent highs, followed by Fibonacci extensions. A breakdown below support would invalidate the bullish setup and return price to consolidation.
When fear-driven currencies lose momentum, moves tend to accelerate.

Ethereum confirmation of breakout, downside targetEthereum confirmed a breakout below the 4050–4100 zone, completing the double top pattern. The price stays under the 50 and 100 EMA, showing continued bearish pressure. Priority remains on short positions during pullbacks.
Nearest downside targets: 3463 (Target 1) and 3007 (Target 2). A move above 4100 would cancel the bearish scenario.
Amid expectations of the Fed’s rate decision and rising bond yields, risk assets remain under pressure. Inflows to crypto funds are declining, increasing the downside risks for ETH. In the short term, correction may continue until new bullish catalysts appear.
ETHUSD remains in a bearish setup. Downside targets — 3460 and 3000. Long positions should be considered only after a confirmed move above 4100.

AUDCAD: Wait for the Close – 0.9130 vs 0.9057AUDCAD is sitting at a make-or-break spot. It’s been climbing in a 4H channel but just topped out and pulled back to support. I won’t guess mid-range—I'll trade the break:
Bull: H4 candle closes above 0.9130 → room toward 0.9165/0.9180, then 0.9230–0.9250.
Bear: H4 candle closes below 0.9057 → opens 0.9000, then 0.8950–0.8920.
I prefer a close and quick retest/hold for confirmation. Watch AUD/CAD news and oil (for CAD).

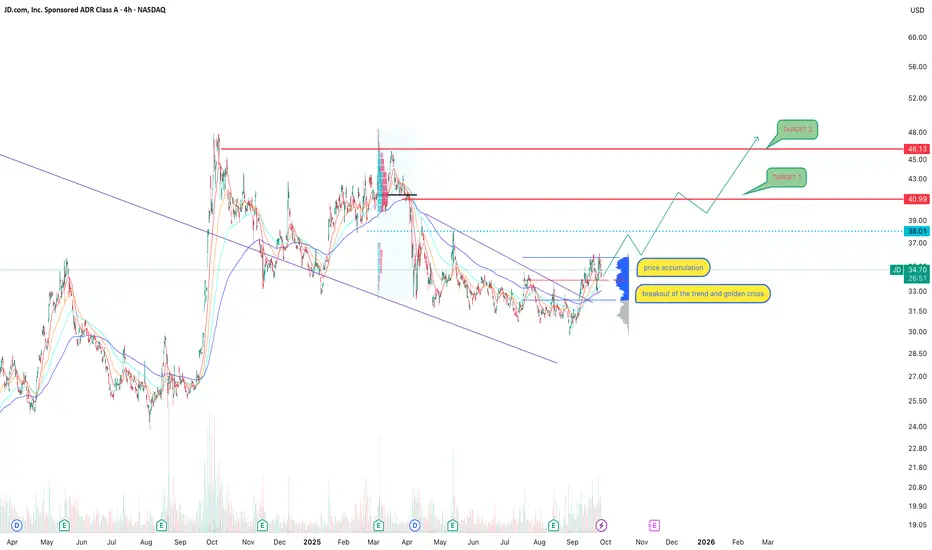
JD.com: accumulation, golden cross, and a chance to restart JD.com remains one of China’s largest e-commerce players, and despite macroeconomic headwinds, the company continues to hold its ground. Fundamentally, JD is focused on optimizing logistics, cutting costs, and expanding its cloud segment. Government policies aimed at boosting domestic demand also provide support. Risks remain tied to China’s economic slowdown and fierce competition from Alibaba and PDD, but at current levels the stock looks attractive for long-term investors.
Technically, the 4H chart shows a breakout of the descending trendline and the formation of a golden cross (50 EMA crossing above 200 EMA), confirming a medium-term trend shift. Price has consolidated above the accumulation zone and is now testing $34.50–35.00. If momentum holds, the next upside targets are $41.00 and $46.00, key resistance levels. A more conservative scenario involves a pullback toward $33.00–32.50, followed by another upward leg.
This is exactly the kind of market situation where investor expectations diverge from reality, and the longer it lasts the more it seems like a trend reversal is near. But as always, emotions must be set aside and clear signals awaited before committing.
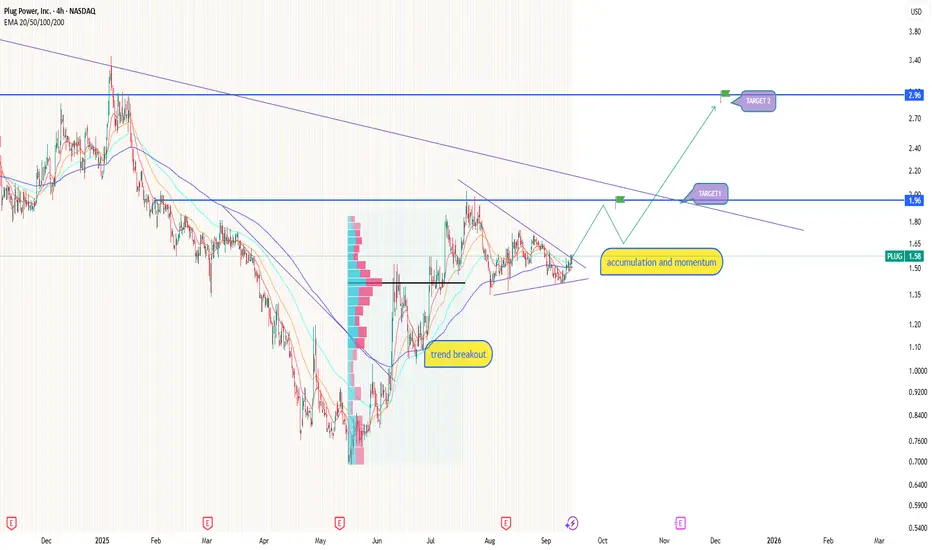
PLUG: accumulation turning into breakout fuelPlug Power is slowly emerging from a long downtrend, building an accumulation structure after a trendline breakout. On the 4H chart, price is consolidating around 1.55–1.60 and gaining momentum. The first upside target is 1.90, where buyers will be tested. A strong breakout could open the way toward 2.90, where major resistance and higher volumes are located.
EMAs are starting to turn upward, confirming a potential trend change. The volume profile highlights strong interest around the current range, supporting the bullish case. The outlook remains positive as long as price holds above the 1.50 zone.
Fundamentally, Plug Power remains in focus with ongoing hydrogen energy projects. While the renewable sector faces macro pressures, improved demand and positive company news could act as catalysts for further growth.
bearish trend on usoilwe are see a break of a strong range after 78 day and also the price break a strong support so we can see usoil on a new level at 94 dollar
stay safe...

what is next for SANDBOX ?As I mentioned in my previous analyse 💣
the price has started its correction when it was broke the trend line💣
and
now the price is reacting to 0.62 Fibonacci and we can expect correction from here and after brief correction the price start its gaining ❌🧨
second possibility
the price start to break the resistance here close to 0.62 Fibonacci and if satay above this line we can expect pump and even (ATH )🚀
This is not financial advice, always do your own research.
please, fell free to ask your question, write it in comments below and I will answer.
🐋
