24-10-2025 Intraday Plan (CPI + NY Open Scenario) – US30 5M/1M💬 Intraday Plan (CPI + NY Open Scenario) – US30 5M/1M
📍 Bias remains bullish above 46,700 (structure still forming higher lows).
📍 Expecting CPI at 13:30 to create a liquidity grab — ideally sweeping lows into the ascending trendline/support.
📍 After CPI spike settles, looking for a NY Open breakout above 46,850 (key resistance).
📍 If we get a break + retest of 46,850, I’ll look for long entries targeting:
✅ TP1: 47,000
✅ TP2: 47,100
✅ TP3: 47,200 (liquidity extension)
❌ If CPI breaks below 46,700 and fails to recover, I’ll reassess for a bearish scenario.
🕒 No trades during initial CPI spike – waiting for structure confirmation post-news & into NY session.
📌 Plan: CPI grab → NY breakout → retest entry → continuation.
Breakout!

GBPUSD Breakout and Potential RetraceHey Traders, in today’s trading session, we’re monitoring GBPUSD for a potential buying opportunity around the 1.32500 zone. The pair has recently broken out of its previous downtrend and is now in a correction phase, approaching a key retracement area at 1.32500, which also aligns with strong support on the 4H structure.
Fundamentals:
All eyes are on the upcoming U.S. CPI release, with markets expecting a slightly softer print. A weaker inflation figure could reinforce dovish expectations for the Fed, potentially putting further pressure on the Dollar and supporting GBPUSD upside into the end of the week.
Next Move:
Watching price action at 1.32500 for a possible bullish reaction and continuation toward recent highs.
Trade safe,
Joe

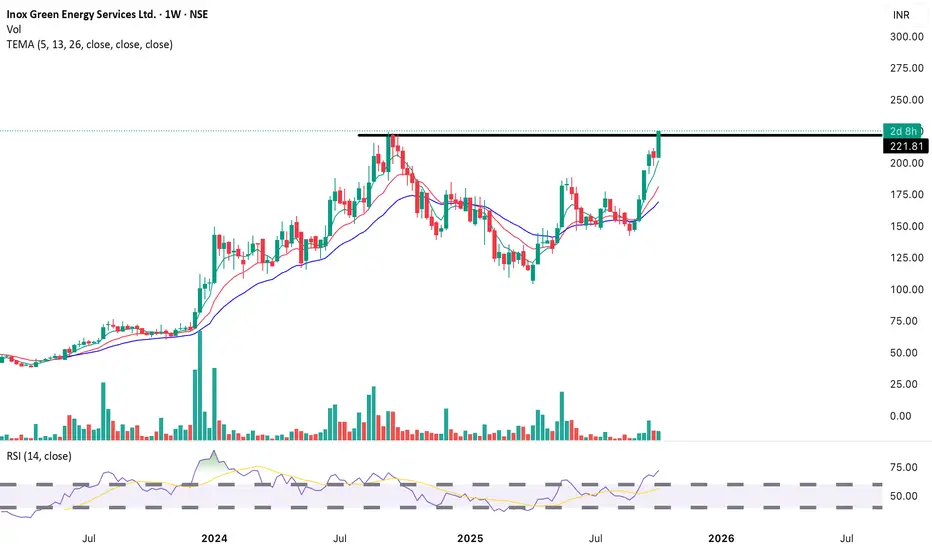
Long (Bullish) – Continuation expected if price sustains Resistance Turned Support: ₹221
Next Target Zone: ₹250–₹275
Stop-loss: Below ₹201 (recent swing low and major moving average)
EURUSD: H1 Momentum PlayDaily Timeframe:
Price is now below the EMAs, which is a technical downtrend according to my definition. Although this is weak, the past two days have been inside bars. This tells me there's barely any movement or strength to the upside.
The bar for this latest session will likely engulf the previous bars. If the current session's bar closes below and engulfs the prior session's bar, there's a stronger indication of momentum to the downside.
H1 Timeframe:
The confluence with the daily timeframe is that the current session's bar is likely to engulf the inside bar that occurred over the past two days.
Right now, price is crossing below the EMA band, which we I anticipate momentum to the downside will pick up.
Price has not crossed the daily level, but I'm not too concerned there. On the H1 timeframe, price failed to make a higher high, which further makes me lean towards having a bearish sentiment.

Gold Likely to Rise FurtherPEPPERSTONE:XAUUSD is demonstrating a well-structured movement within an ascending channel, where each price bounce is well-controlled, and every retracement follows a consistent pattern. The strength of the buyers is becoming increasingly evident, with technical dynamics becoming more organized and fluid.
After breaking through a key resistance level, the price is now retesting this level. If this level holds as solid support, the market is likely to continue its bullish momentum towards 4,500, which serves as the natural target aligned with the upper boundary of the ascending channel.
As long as the price remains above this support level, the upward trend will continue. However, if the price fails to hold and drops below this level, the trend structure will be at risk, and the likelihood of a technical correction towards the lower boundary of the channel will increase.
In this well-organized market condition, consistency and discipline in analysis are crucial. Carefully identify key points, wait for strong confirmation, and allow the trend to move in the predetermined direction.

$RZLV - Rezolve AI - $6.00 Breakthrough for $7.36 RetestNASDAQ:RZLV is showing a potential load zone. If it breaks out above that $4.75 Level of Previous Support, we could see this retest those $6 Levels and push back to the next level of resistance at our $7.36 #PT

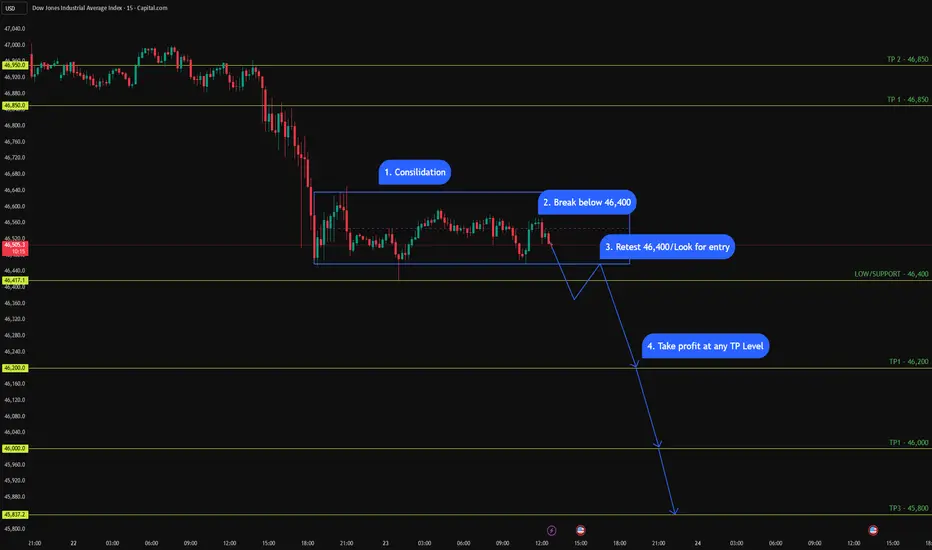
US30 (15M - 1M Daily Setup) - Bearish Bias US30 (15M - 1M Daily Setup) - Bearish Bias 📉
Price is consolidating under key resistance, forming lower highs. I’m watching 46,400 as the make-or-break level.
✅ Plan:
1️⃣ Consolidation phase complete
2️⃣ Looking for a clean break below 46,400
3️⃣ Retest → possible short entry
4️⃣ Target zones:
• TP1 → 46,200
• TP2 → 46,000
• TP3 → 45,800
📍 Bias stays bearish as long as price remains below 46,850 – 47,000.
Let’s see if the breakdown plays out. 👀
SKYGOLDLooks good on Chart.
Breakout Visible.
Above all key EMA.
Good for Short Term.
Target 410,500.
Do Like ,Comment , Follow for regular Updates...
Keep Learning ,Keep Earning...
Disclaimer : This is not a Buy or Sell recommendation. I am not SEBI Registered. Please consult your financial advisor before making any investments . This is for Educational purpose only.

AUDUSD: Monitoring Downside MomentumDaily Timeframe:
Yesterday's session closed with a doji (inside bar). There's a lot of indecision going on. Price is maintaining below the HTL, however, the ranging bars may indicate that there's a lack of selling pressure.
If momentum does not pickup, we might see a fakeout. For the time being, I still maintain a bearish stance on the daily timeframe.
H1 Timeframe:
Price is breaking below the ATL, which is the first indication that momentum may be picking up throughout the Asian session.
Price remains choppy around the EMAs, which is a less reliable momentum signal.
However, I do think this pair has potential if price does not close back above the ATL.

GBPJPY: Trend ContinuationOver on the daily timeframe, price is respecting the EMAs. This is indicating a clear uptrend. In addition, the HTL is a resistance turned support level so overall bullish sentiment unless price crosses back below this level.
The H1 timeframe is also supporting the notion that there's momentum to the upside. Structurally, there's momentum to the upside. This is first indicated by price breaking above the DTL.
In this case, price's acceleration away from the EMA is not clear signal. This was quite choppy since October 12th.
There's potential to the upside, but I'd approach this pair a bit more cautiously.

AUDCHF: Breaks Below ATLPrice is breaking below the ascending trendline (ATL), which is a signal that the counter-trend move is coming to an end.
The H1 timeframe also demonstrates confluence across price's crossover below the ATL and price's acceleration away from the EMAs.
This is further supported by the fact that price is holding below the horizontal trendline (HTL) on the daily timeframe. We can overall maintain a bearish bias for the time being.
Given that this trade signal is close to the 5 PM rollover, it may result in a closure and then re-entry to avoid a spread spike.

Breakout or Fake-Out? Corn Just Kissed Its Support!1. The Setup
Corn’s doing exactly what disciplined traders hoped for — pulling back to the same UFO support zone that powered the earlier wedge breakout. On the 8-hour chart, price just kissed that 418–411 area… a textbook retest where new buyers could reload the bushels.
2. The Context
We saw this coming. The initial breakout looked flashy, but the volume delta wasn’t convinced — it stayed soft. Now that price has tapped into the unfilled-order pocket, watch to see if the delta turns positive again. That’s the “ignition spark” that often separates real breakouts from fakes.
3. The Game Plan
The playbook hasn’t changed — only the timing has improved.
🎯 Entry idea: around 418 support
🛑 Stop: 411 (below the UFO zone)
📈 Targets: 430 and 442
⚖️ Reward-to-Risk ≈ 3:1
This is patience in action — waiting for the market to come to you instead of chasing it.
4. The Specs
ZC – Corn Futures: 5 000 bushels · Tick = ¼ ¢ ($12.50) · ≈ $1 000 margin
MZC – Micro Corn Futures: 500 bushels · Tick = ½ ¢ ($2.50) · ≈ $100 margin
Same analysis, smaller bite size — perfect for managing exposure while keeping precision.
5. The Takeaway
Volume shows what’s already been eaten; UnFilled Orders at support show what’s still on the table.
Corn just revisited the buffet — now we wait to see if buyers come back for seconds. 🌽🔥
Want More Depth?
If you’d like to go deeper into the building blocks of trading, check out our From Mystery to Mastery trilogy, three cornerstone articles that complement this one:
🔗 From Mystery to Mastery: Trading Essentials
🔗 From Mystery to Mastery: Futures Explained
🔗 From Mystery to Mastery: Options Explained
When charting futures, the data provided could be delayed. Traders working with the ticker symbols discussed in this idea may prefer to use CME Group real-time data plan on TradingView: www.tradingview.com - This consideration is particularly important for shorter-term traders, whereas it may be less critical for those focused on longer-term trading strategies.
General Disclaimer:
The trade ideas presented herein are solely for illustrative purposes forming a part of a case study intended to demonstrate key principles in risk management within the context of the specific market scenarios discussed. These ideas are not to be interpreted as investment recommendations or financial advice. They do not endorse or promote any specific trading strategies, financial products, or services. The information provided is based on data believed to be reliable; however, its accuracy or completeness cannot be guaranteed. Trading in financial markets involves risks, including the potential loss of principal. Each individual should conduct their own research and consult with professional financial advisors before making any investment decisions. The author or publisher of this content bears no responsibility for any actions taken based on the information provided or for any resultant financial or other losses.

XAUUSD: Price can Drop to Support Zone and Break Trend LineHello everyone, here is my breakdown of the current Gold setup.
Market Analysis
Gold has been in a very strong uptrend, which accelerated after breaking out of a prior Upward Channel. This led to a new, steeper rally along a major Trend Line, culminating in a new All-Time High around the 4380 mark.
Currently, after reaching that peak, the price has completed a healthy correction back down to the main Trend Line, which also aligns with the Support zone at the 4250 level. The price has bounced from this area and is now attempting to rally again.
My Scenario & Strategy
My scenario is a bearish one, built on the idea that this second attempt to rally will fail to make a new high. I'm looking for this current rally to lose momentum as it approaches the prior ATH of 4380. The key signal for me would be a strong and clear rejection from that area, showing that buyers no longer have the strength to continue pushing the price higher.
Therefore, the strategy is to watch for this failure at the highs. A confirmed reversal would validate the short scenario and should lead to a decline that breaks the major ascending Trend Line. The primary target for this corrective move is 4205, which is inside the major Support zone.
That's the setup I'm tracking. Thank you for your attention, and always manage your risk.

EURJPY: Trend ContinuationI've made several key annotations on this chart. There are several things that I like.
The first is the clean daily structure as price is respecting the EMAs and is making clear breaks above the HTLs.
Over on the H1 timeframe, price crossed above the DTL Although it stalled a bit, it did not successfully make any new lows. Overall, selling pressure does not seem to be present.
My entry signal is based on the bullish bar exiting the EMA band, which is a sign that momentum to the upside will likely pick up.

BTCUSD Completes Correction – Heading Towards $125,000BINANCE:BTCUSD is currently trading in a well-defined ascending channel, indicating that the bullish trend continues. The price is following the channel's structure, creating higher highs and higher lows, which is a clear sign that the uptrend remains intact. The recent price correction shows a healthy pullback, which could serve as the foundation for the next upward move.
The price is now approaching an important support zone, marked by the lower boundary of the channel and a previous demand zone. If this support holds, it could present an opportunity for buyers to re-enter with strength. The expected target is $125,000 , aligning with the middle of the channel and the previous resistance level.
As long as the price remains above the support zone and the ascending trendline, the bullish scenario remains valid. However, if the price breaks below this level, it could invalidate the current setup and increase the likelihood of a deeper correction.
Always ensure you confirm your setups and trade with proper risk management.
Good luck!

EUR-USD Bearish Breakout! Sell!
Hello,Traders!
EURUSD Price has broken below the horizontal supply area and is now forming a bearish continuation setup. A possible retracement toward the previous zone may attract more sellers, targeting deeper liquidity levels below 1.1580. Time Frame 5H.
Sell!
Comment and subscribe to help us grow!
Check out other forecasts below too!
Disclosure: I am part of Trade Nation's Influencer program and receive a monthly fee for using their TradingView charts in my analysis.

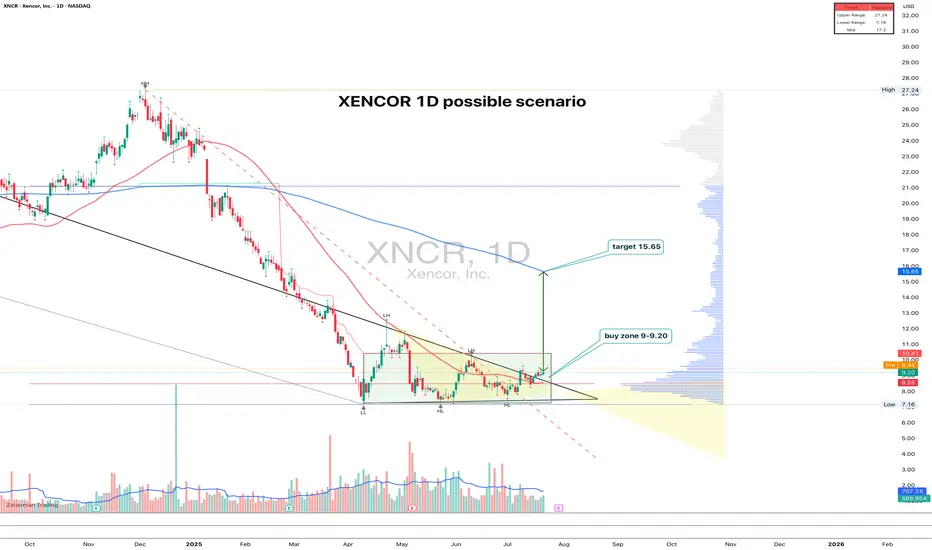
XNCR 1D time to growth?XNCR: the uptrend hasn't started yet - but someone's quietly accumulating
XNCR spent nearly 4 months building a base and finally broke out of consolidation with a clear upward move. The pattern looks like a range with a narrowing triangle at the bottom — the breakout came with rising volume. Entry makes sense in the 9.00–9.20 zone on a retest. Volume profile and Fib levels confirm the importance of this area, plus there’s a clean support shelf at 9.00. The target is 15.65, which aligns with the height of the structure. The 200-day MA is still above price, but a push beyond 11.00 could open the door to acceleration.
Fundamentally, Xencor is a biotech company focused on monoclonal antibodies. After a tough 2023–2024 and cost reductions, the market is beginning to price in signs of recovery. Key partnerships remain intact, the pipeline is alive, and recent data for XmAb7195 was well received at industry events. Valuation remains low, and biotech ETF flows are slowly picking up.
Still a relatively low-volume name, but the structure is clean, the setup is readable, and fundamentals are turning. With a tight stop below 8.50, the risk-reward looks solid.
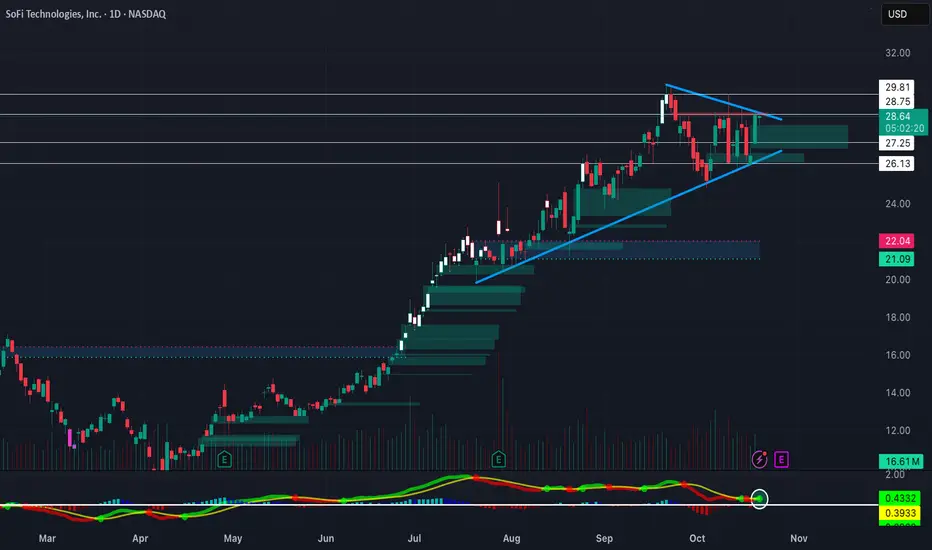
Triangle Break Heading into EarningsNASDAQ:SOFI Forming a big symmetrical triangle on the daily timeframe heading into earnings. EMA's are starting to curl upwards after NASDAQ:SOFI found some support on its 50-day SMA. Bullish long-term on NASDAQ:SOFI , so definitely will be watching this one closely
Euro can Continue its Rally After a Minor CorrectionHello traders, I want share with you my opinion about Euro. The market for the Euro has been through a highly complex series of structural shifts, transitioning from a prior upward channel into a well-defined downward channel. After multiple failed rallies and a final drop into the 1.1600 buyer zone, the price action for EURUSD has shown a significant reversal, breaking out of the downward channel and establishing a new short-term bullish momentum. Currently, after this strong breakout, the asset is undergoing a minor corrective phase. In my mind, this price action represents a healthy pullback before the next leg higher. I expect that the price will make a small dip to find support, likely retesting the broken channel structure from above. I think a confirmed bounce from this area will validate the bullish breakout and trigger a continuation of the rally. Therefore, I have placed my TP at the major 1.1780 Resistance Level, which aligns with the seller zone and represents a logical objective for this recovery. Please share this idea with your friends and click Boost 🚀
Disclaimer: As part of ThinkMarkets’ Influencer Program, I am sponsored to share and publish their charts in my analysis.

Gold Setup You Can’t IgnoreHey everyone, Erik here !
Gold is quietly preparing for its next move. After a strong rally, price didn’t collapse as many expected. Instead, it’s been building a smooth accumulation structure — the classic Cup and Handle that often signals continuation in a healthy uptrend.
This setup tells a deeper story about market psychology. Sellers are running out of strength, while buyers keep absorbing every pullback with patience and confidence. Momentum is quietly shifting, and pressure beneath the surface is growing.
If a clean breakout confirms this formation, gold could enter its next bullish leg. A move toward 4500 looks not just possible, but reasonable based on the current market structure.
Until that confirmation comes, patience remains the key. Waiting for a clear breakout with strong volume helps filter out false signals and keeps you aligned with the dominant trend.

Gold setup: The retracement that could spark the next rallyOANDA:XAUUSD continues to trade confidently within a well-defined ascending channel, maintaining a clear and healthy bullish structure. After testing the upper boundary, the price pulled back to the mid-zone, where a strong rejection candle appeared, confirming that buyers are still defending key levels with conviction and keeping the upward momentum alive.
This kind of market behavior often signals renewed strength before the next move higher. If the bullish momentum holds, the price could break above the upper boundary of the channel and push toward new highs. Given the current technical setup and positive sentiment across the market, a move toward 4,500 seems both realistic and consistent with the ongoing trend.
Even so, caution remains important. A daily close below the lower boundary of the channel would weaken the bullish structure and could trigger a short-term correction before the trend resumes.
From a broader perspective, the bullish outlook for gold continues to be supported by geopolitical tensions, global uncertainty over interest rate policies, and the weakening US dollar. With central banks maintaining strong demand for gold as a hedge against economic instability, the precious metal remains one of the most attractive safe-haven assets in today’s volatile market.

AUDUSD Descending triangle breakout bullish move 📉 AUD/USD Technical Setup (1H Timeframe)
The pair has broken out of a descending triangle pattern 🔺 showing strong bullish momentum from the 0.6490 level 💪
🎯 Upside Targets:
1️⃣ 0.6520
2️⃣ 0.6570
3️⃣ 0.6600
Momentum remains bulls-in-control as long as price holds above 0.6490 support zone ⚡
💡 Watching for continuation moves toward upper resistance levels if buying pressure sustains.
#AUDUSD #Forex #PriceAction #TechnicalAnalysis #TradingSetup 💹

USDJPY: Holds Above HTLOn the daily timeframe, price broke through a previous HTL, which is now acting as support. There's also uptrend confluence signaled by price remaining above the EMAs and EMA20 being above EMA60.
Over on the H1 timeframe, price is also beginning to deviating away from the EMAs, which signals to me that there's momentum picking up.
In addition, price is also breaking above the DTL right now, which indicates that the counter-trend move is likely over.
