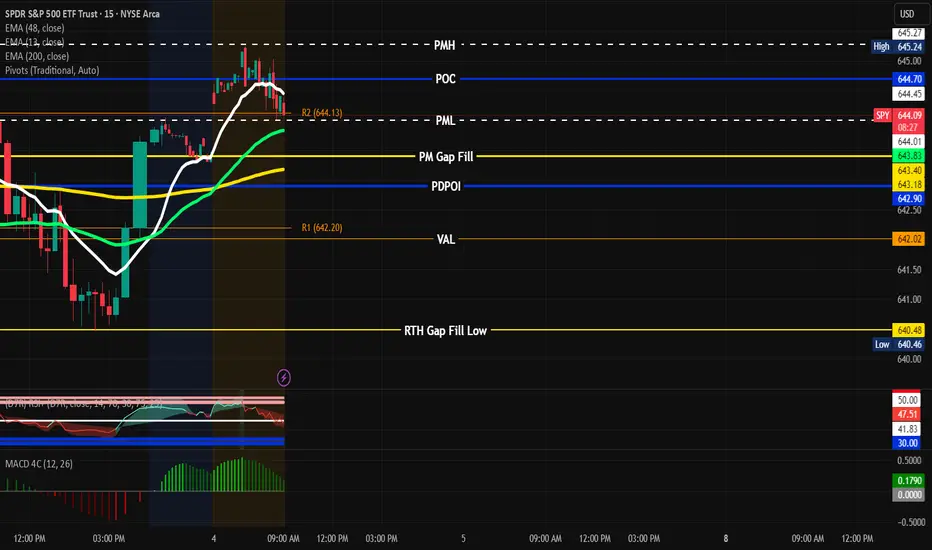
SPY setup 9/4/25PMH 645.27
PML 644.01
POI 645.24
PM Gap Fill 643.40
Range is between 6.43.17-645.27 Look for SPY to go back and retest PMH before coming back down to 644.70. If it breaks through look for it to go to PML 644.01 or Fill the Gap at 643.40. Wait for clear signs before hopping in. If it breaks, retest and hold PML look for PUTs to 642.90-642.20 T/P 1. If it breaks PMH and pullback and hold look to enter for CALL 646.10 T/P 1. You can also use the 9/13 EMA as entry. Use S/L and manage risk properly. Let’s Goooo! “Discipline is the tithe you pay, The reward is financial freedom.” - #You Got Options
Breakout!
EURJPY: FakeoutEURJPY is currently undergoing an interesting transition. While the EMAs indicate that this pair is in an uptrend (where EMA20 is above EMA60), there's early indication that we might be seeing a downtrend soon.
Daily Timeframe:
Price attempted to cross above the daily level, but it failed to close above it. It's also a lower high after a strong run-up, which indicates to me that the upside momentum might be exhausting.
H1 Timeframe:
We see an intraday double top formation, which indicates that price is having a hard time pushing higher. Price also crossed below the intraday neckline.
While it tried to pull back above the intraday neckline, it quickly reverted below, indicating quite a bit of selling pressure.

EURUSD: Price Exit from Pennant and DropHello everyone, here is my breakdown of the current Euro setup.
Market Analysis
From a broader perspective, the price has been consolidating in a wide range between the 1.1600 support level and the 1.1720 resistance level. This extended period of balance has now tightened, leading to the current, more compressed pattern where a significant move is becoming more likely.
Currently, the price action is coiling within a pennant pattern. This compression of volatility suggests that energy is building for a breakout. The price is now trading very close to the apex of this pennant, testing the upper boundary near the major horizontal Resistance Zone.
My Scenario & Strategy
While a breakout from a pennant might seem likely, the overhead resistance at the 1.1720 level is historically significant. I'm watching for a situation where the market fakes a move to the upside to trap optimistic buyers before revealing its true intention.
Specifically, I'm watching for a brief dip, followed by a rally that pushes the price just above the pennant's resistance line and into the 1.1720 - 1.1730 resistance area. The key signal would be a swift and forceful rejection from this area, pushing the price back below the breakout point. And the primary target for the resulting decline is the 1.1600 level, which aligns with the major horizontal support zone.
That's the setup I'm tracking. Thank you for your attention, and always manage your risk.

Conslidation Box
Closed at 9.14 (23-05-2025)
Trying to break the long consolidation box.
Important Support Zone is around 8 - 8.70
Channel bottom is around 5.30 which seems
unlikely as of now because of Bullish Divergence
on weekly tf.
Upside targets can be around 11 & then around 14

Gold 15M Analysis | Key Triggers Ahead💀 Hey , how's it going ? Come over here — Satoshi got something for you !
⏰ We’re analyzing AAVE on the 4-Hour timeframe timeframe .
👀 On the 15-minute timeframe, gold can be traded using these alarm zones.

Bitcoin will continue to decline inside downward channelHello traders, I want share with you my opinion about Bitcoin. The dominant market structure for Bitcoin remains bearish, with the price action being clearly contained within a well-defined downward channel since the major rejection from the 116800 Resistance Level. This structure has been guiding the asset lower through a series of impulsive declines and corrective rebounds, confirming that sellers are in control of the trend. The most significant recent development was the breakdown below the key horizontal support around the 109000 level. Currently, after this breakdown, the price of BTC is in a corrective phase, rallying back to retest this broken structure from below, which now acts as the current resistance level. This 109000 - 109800 resistance zone is a critical inflection point. The primary working hypothesis is a short scenario, predicated on the failure of this retest. A confirmed rejection from this former support area would validate the continuation of the bearish momentum and signal that the next impulsive downward fall is imminent. Therefore, the TP for this trend continuation play is logically placed at 104000 points. This target represents a new lower low within the channel and is the next major area of structural interest for the price. Please share this idea with your friends and click Boost 🚀

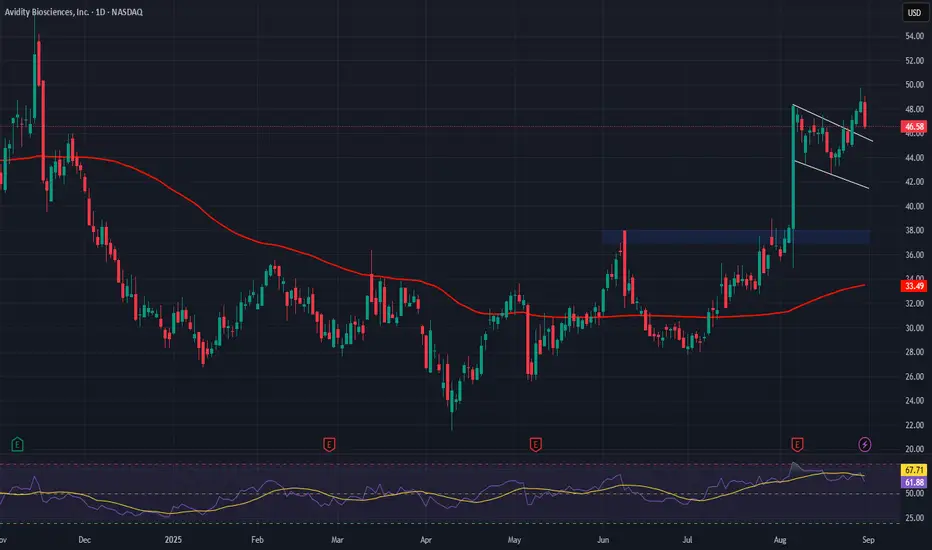
Avidity Biosciences (RNA) AnalysisCompany Overview:
Avidity Biosciences NASDAQ:RNA is pioneering RNA therapeutics with its Antibody Oligonucleotide Conjugates (AOC) platform, aiming at rare genetic diseases where no treatments exist—unlocking high unmet demand.
Financial Snapshot (Q2):
Revenue: $3.85M
Net loss: $157.31M (reflecting heavy early-stage R&D investment)
Valuation: P/S 529.67, P/B 9.27, signaling premium growth pricing by investors.
Technical View:
Stock has formed multiple bull flag patterns.
Breakout potential is strong after recent consolidation phase.
Investment Outlook:
Bullish above: $37.00–$38.00
Upside target: $70.00–$72.00, supported by pipeline innovation + bullish technical setup.
📢 RNA — premium biotech bet with rare-disease focus and breakout momentum.
#RNA #Biotech #Genomics #GrowthStocks #BullFlag #Breakout
EURUSD: Price break resistance and continue to growHello everyone, here is my breakdown of the current Euro setup.
Market Analysis
From a broader perspective, after exiting a prior Upward channel, the price action has entered a large consolidation phase. This has created a well-defined trading range between the major Support zone around the 1.1470 level and the key Resistance Zone up to the 1.1745 area, indicating a period of market balance.
Currently, the price is coiling within a large pennant formation, a classic sign of contracting volatility before a significant move. The price is now at a critical point, testing the descending resistance line of this pennant, which also aligns with the major horizontal Resistance at the 1.1710 level.
My Scenario & Strategy
My scenario is built on the idea that this pennant is a bullish continuation pattern, where buyers are absorbing supply before attempting the next leg higher. I'm anticipating a brief corrective dip from the current position before the main move begins. Following this, I expect buyers to take the initiative and push the price upwards, forcing a breakout above both the pennant's resistance line and the horizontal 1.1710 Resistance level.
A successful break and hold above the Resistance Zone would validate the long scenario. The primary target for this breakout move is 1.1820 points, representing a logical next objective for an upward expansion.
That's the setup I'm tracking. Thank you for your attention, and always manage your risk.

BITCOIN Bearish Breakout! Sell!
Hello,Traders!
BITCOIN is going down
Now and the coin made
A bearish breakout of the
Key horizontal level
Of 110k$ so we are locally
Bearish biased and we
Will be expecting a
Further bearish move down
Sell!
Comment and subscribe to help us grow!
Check out other forecasts below too!
Disclosure: I am part of Trade Nation's Influencer program and receive a monthly fee for using their TradingView charts in my analysis.

SILVER Will Keep Growing! Buy!
Hello,Traders!
SILVER is trading in an
Uptrend and the price
Made a bullish breakout
Of the key horizontal
Level of 39.53$ and the
Breakout is confirmed so
We are bullish biased
And we will be expecting
A further bullish continuation
Buy!
Comment and subscribe to help us grow!
Check out other forecasts below too!
Disclosure: I am part of Trade Nation's Influencer program and receive a monthly fee for using their TradingView charts in my analysis.

AUD-USD Bullish Bias! Buy!
Hello,Traders!
AUD-USD made a bullish
Breakout of the key
Horizontal level of 0.6624
Which is now a support
Then made a retest and
A rebound so we are
Bullish biased and we
Will be expecting a
Further bullish move up
Buy!
Comment and subscribe to help us grow!
Check out other forecasts below too!
Disclosure: I am part of Trade Nation's Influencer program and receive a monthly fee for using their TradingView charts in my analysis.

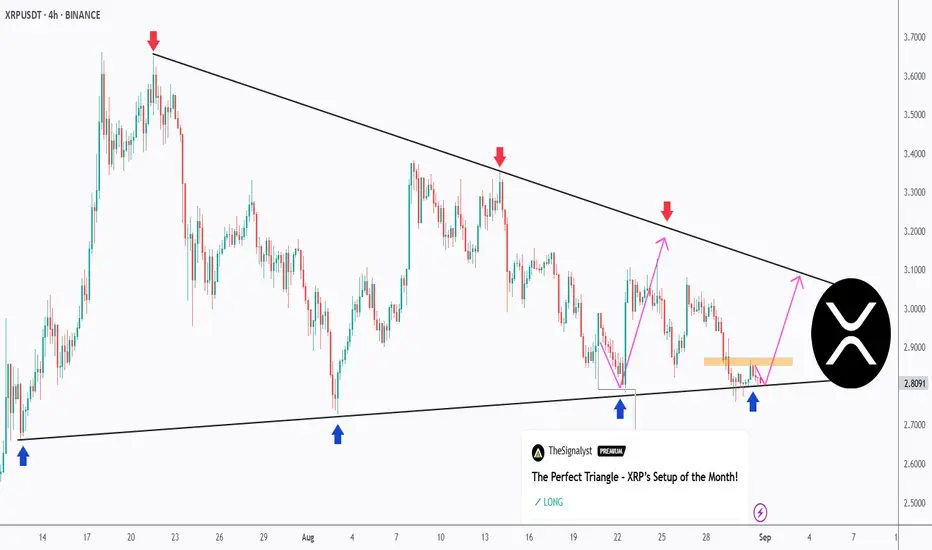
Let’s Do It Again – XRP Retests the Triangle Support!XRP continues to coil inside a textbook symmetrical triangle on the 4H timeframe.
🔻 Sellers remain active at the descending trendline (red arrows).
🔹 Buyers are once again stepping in at the rising support (blue arrows).
📉 Price is now retesting the lower bound of the structure. As long as this zone holds, we can anticipate another potential bounce toward the upper boundary.
🚀 For the bulls to take full control, a break above the last high marked in orange is needed. A confirmed breakout from this triangle will likely define XRP’s next major move — either continuation higher or a bearish breakdown.
This clean and well-defined triangle keeps XRP among the most exciting setups to watch right now!
⚠️ Disclaimer: This is not financial advice. Always do your own research and manage risk properly.
📚 Stick to your trading plan regarding entries, risk management, and trade execution.
Good luck!
All Strategies Are Good; If Managed Properly!
~Richard Nasr
Breakout.POWER Analysis
Closed at 14.50 (24-07-2025)
Breakout.
a Very Strong Support seems to
be around 13.80 - 14.
Sustaining this level may lead it
towards 15 - 16.

ETH 4H Analysis – Key Triggers Ahead | Day 7💀 Hey , how's it going ? Come over here — Satoshi got something for you !
⏰ We’re analyzing ETH on the 4-hour timeframe timeframe .
🔭 In the 4-hour timeframe of Ethereum, we can see that after registering its all-time high, Ethereum was rejected downwards and then took support from the $4,273 area and moved upwards. We need to see how valid this support can remain in the new week. There is also an important resistance at the $4,515 area, and breaking this level could end Ethereum’s corrective trend.
⛏ The key RSI areas are 35 and 58. If the fluctuation passes these levels, Ethereum could enter a new phase of volatility and eventually start its movement.
💰 The size and number of red candles have almost decreased, and with increasing volume and larger candle sizes, Ethereum can start a good trend. Keep in mind that today is a holiday, so not much volume enters the market. On the other hand, there are rumors on Twitter about the death of Donald Trump, which could also prevent an increase in volume.
🪙 In the 4-hour timeframe of the ETHBTC index , we can see that this index broke its box at the 0.03946 area and registered an all-time high for Ethereum against Tether pair. Then it was rejected from this area and showed two rebound reactions at the 0.03946 support, which is the broken box top. With a breakout of the highlighted areas in this index analysis, both Bitcoin and Ethereum could see more liquidity, and this directly affects the ETH/USDT pair.
🔔 The alarm zones that can be considered for Ethereum in this timeframe are the $4,273 and $4,514 areas. The price action in these areas can be of high value, and with increasing volume, they could give us either a short or long trade opportunity.
❤️ Disclaimer : This analysis is purely based on my personal opinion and I only trade if the stated triggers are activated .

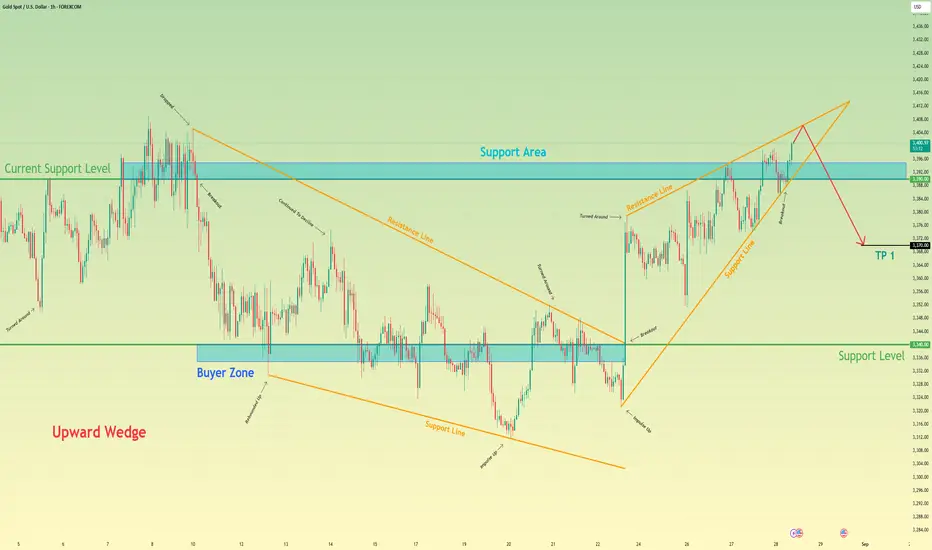
Gold will start to decline and then exit from wedgeHello traders, I want share with you my opinion about Gold. The market dynamic for XAUUSD has seen a significant evolution, transitioning from a corrective falling wedge into a new bullish phase after a powerful breakout from the lows. This upward trend has since matured and taken the shape of a large upward wedge, a pattern that has been guiding the price higher through a series of rebounds and corrections. This formation, while bullish in the short term, often signals potential trend exhaustion as it approaches its apex. Currently, the price action for XAU is at a critical juncture, pushing up against the upper resistance line of this wedge. The primary working hypothesis is a short scenario, which is predicated on the common bearish resolution of a rising wedge pattern. It is anticipated that the asset will be rejected from this resistance line, signalling that buying momentum is waning. A confirmed failure at this peak would likely trigger a sharp reversal, with enough selling pressure to cause a breakdown below the wedge's ascending support line and the current support level of 3390. This structural failure would validate the bearish thesis and initiate a new downward leg. Therefore, the TP is logically set at 3370 points, representing a prudent first objective for the price to achieve following the anticipated breakdown of the wedge structure. Please share this idea with your friends and click Boost 🚀
SILVER BULLISH BREAKOUT|LONG|
✅SILVER is going up currently
And the price broke the key structure level of 39.52$
Which is now a support, and after the pullback
And the retest, I think the price will go up
LONG🚀
✅Like and subscribe to never miss a new idea!✅

AUD_USD WILL GO UP|LONG|
✅AUD_USD is going up
Now and the pair made a bullish
Breakout of the key horizontal
Level of 0.6525 and the breakout
Is confirmed so we are bullish
Biased and we will be expecting
A further bullish move up
LONG🚀
✅Like and subscribe to never miss a new idea!✅

NZD-USD Will Keep Growing! Buy!
Hello,Traders!
NZD-USD is going up
And the pair made a bullish
Breakout of the key horizontal
Level around 0.5880 and the
Breakout is confirmed so
We are bullish biased
And we will be expecting
A further bullish move up
On Monday!
Buy!
Comment and subscribe to help us grow!
Check out other forecasts below too!
Disclosure: I am part of Trade Nation's Influencer program and receive a monthly fee for using their TradingView charts in my analysis.

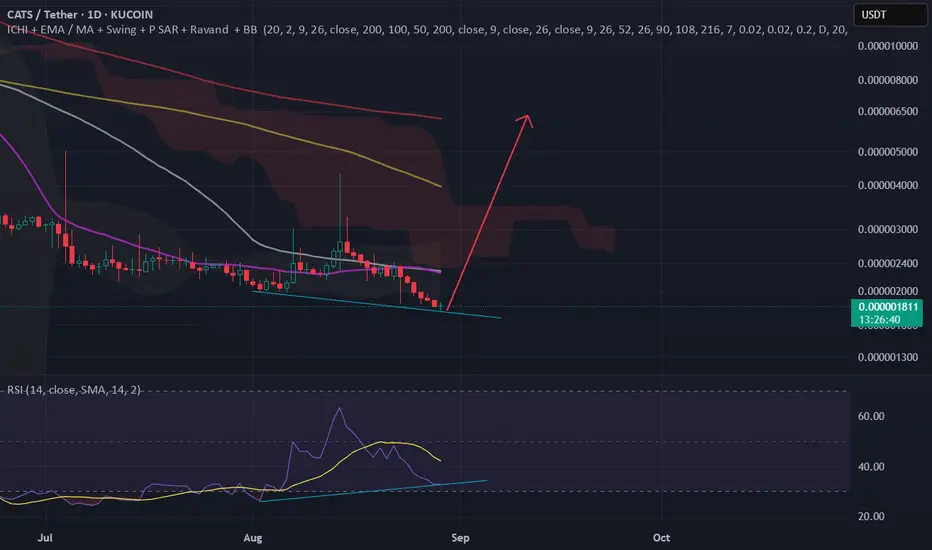
CATSUSDTat technically RSI in daily Chart has Positive Divergence , Break out Excepted , Buy before Explode About to 4x For First
XAUUSD: Price Rebound from Support line to $3440Hello everyone, here is my breakdown of the current Gold setup.
Market Analysis
From a broader perspective, we've seen a clear shift in control on the chart. The market successfully reversed a prior downtrend by breaking out of a Downward Channel. This breakout was significant and has established the current bullish market structure, which has been guiding the price higher.
This new bullish phase has formed a well-defined Upward Wedge. The price has been respecting its boundaries, making higher highs and higher lows. Currently, the price is undergoing a corrective pullback and is testing the ascending support line of this wedge, which aligns with the Support zone around the 3390 level.
My Scenario & Strategy
My scenario is built on the expectation that this upward wedge structure will remain intact. The current pullback to the support line presents a classic opportunity within an established uptrend.
I'm anticipating a clear bounce from the current support zone. This should initiate a rally back towards the wedge's resistance line. The key part of this scenario is that I expect the buying pressure to be strong enough to force a breakout above that resistance, signaling an acceleration of the trend. The primary target for this breakout scenario is 3440 points.
That's the setup I'm tracking. Thank you for your attention, and always manage your risk.

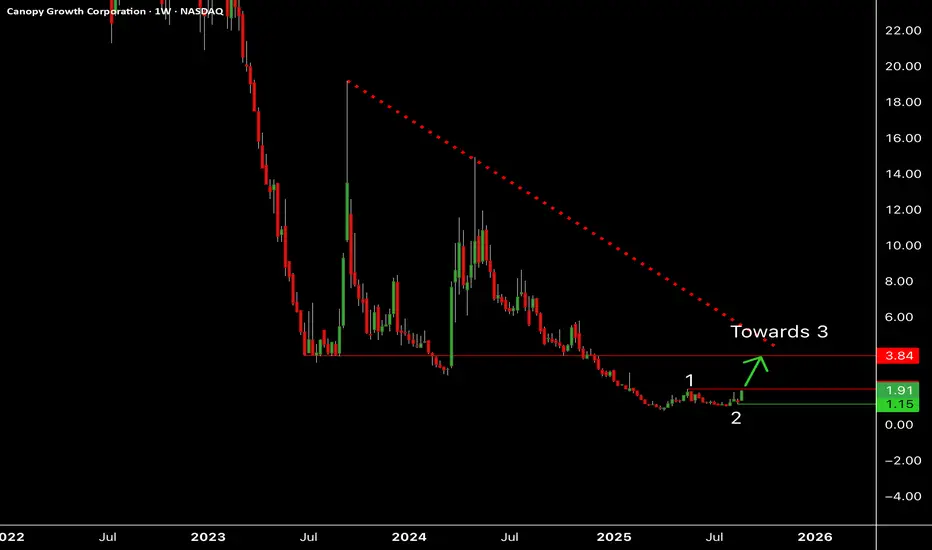
Canaopy Growth looking to break outCannabis stocks are finally starting to wake up after rumours that Trump will finally legalize weed in the country.
A break above $1.99 should open $3.84 where the line linking the tops and the former lows should act as important resistances.
A break below $1.15 should invalidate this view.
GBP-CAD Bearish Breakout! Sell!
Hello,Traders!
GBP-CAD made a bearish
Breakout of the key horizontal
Level of 1.8640 and the
Breakout is confirmed so
We are bearish biased and
We will be expecting a
Further bearish move down
Sell!
Comment and subscribe to help us grow!
Check out other forecasts below too!
Disclosure: I am part of Trade Nation's Influencer program and receive a monthly fee for using their TradingView charts in my analysis.

EUR_CAD BEARISH BREAKOUT|SHORT|
✅EUR_CAD broke the
Key structure level of 1.6070
While trading in an local downtrend
Which makes me bearish
And as the retest of the level is complete
Bearish continuation will follow
SHORT🔥
✅Like and subscribe to never miss a new idea!✅
