XAUUSD Demand Holding - Resistance Retest in PlayHello traders! Here’s my technical outlook on Gold (XAUUSD, 4H) based on the current chart structure. After a strong bullish impulse from the 3,650–3,700 area, price formed a clear ascending channel, respecting both rising support and resistance. Higher highs and higher lows continue to confirm bullish market control. Previously, Gold reached the Seller Zone around 4,360–4,380, where price entered consolidation and later turned lower. Selling pressure weakened near the 4,270 level, allowing buyers to step back in. Price then broke above 4,270, flipping it from resistance into support and signaling a bullish market structure shift. A corrective pullback followed into the Buyer Zone at 4,260–4,280, aligning with previous resistance turned support and the lower boundary of the ascending channel. Buyers successfully defended this area, keeping the bullish structure intact. Currently, price is consolidating below the Seller Zone (4,360–4,380), showing accumulation rather than strong rejection. My scenario: as long as price holds above the Buyer Zone (4,260–4,280), Gold may continue higher toward the Seller Zone / TP1. A clean breakout above resistance would open the door for further upside, while a failure to hold support could lead to a deeper corrective move. For now, the bias remains bullish. Please share this idea with your friends and click Boost 🚀
Breakout!

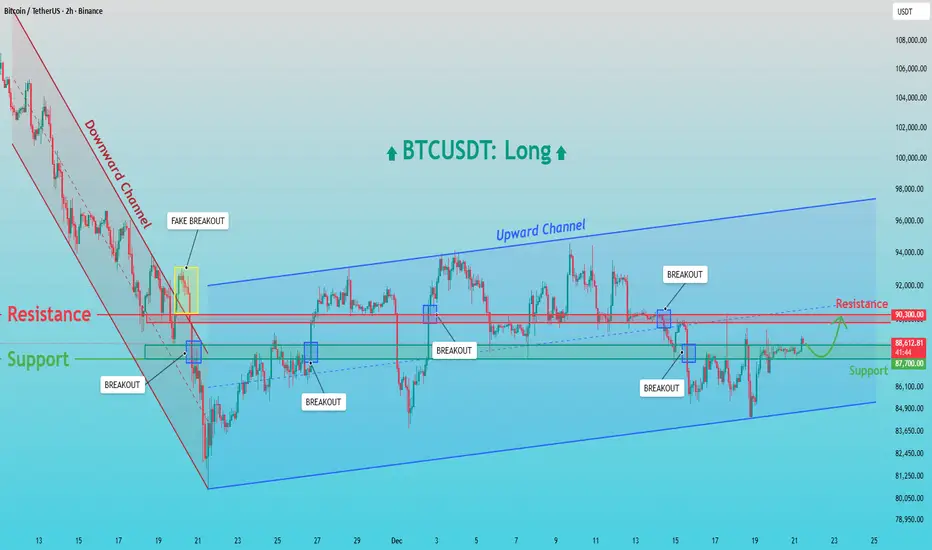
BTCUSDT: Holds Demand - Retest of 90,300 Resistance LikelyHello everyone, here is my breakdown of the current BTCUSDT setup.
Market Analysis
BTCUSDT recently transitioned from a strong downward channel into a broader bullish recovery phase. After a prolonged bearish move, price formed a base near the channel low, where selling pressure weakened. This led to a breakout from the downward channel; however, the first move above resistance resulted in a fake breakout, indicating that sellers were still active at that level. Following this, Bitcoin found strong demand around the 87,000 Support Zone, where buyers stepped in aggressively. From this area, price began to form higher lows and successfully established an ascending (upward) channel, signaling a shift in short-term market structure toward bullish control. Within this upward channel, BTC experienced several clean breakouts above intermediate resistance levels, confirming improving momentum. The key horizontal level around 90,300 acted as a major resistance, where price was rejected multiple times. Despite these rejections, the market did not break down sharply, suggesting absorption of selling pressure rather than distribution.
Currently, BTCUSDT is pulling back toward the 87,000 Support Zone, which aligns with previous resistance turned support and the lower boundary of the upward channel. Price action here remains constructive, with consolidation rather than impulsive selling, indicating that the move lower is corrective.
My Scenario & Strategy
My primary scenario remains bullish as long as BTC holds above the 87,000 support. This zone is a key demand area, and a strong reaction from here could lead to another attempt toward the 90,300 Resistance and a continuation within the upward channel. A confirmed breakout and acceptance above the 90,300 level would open the door for further upside toward higher channel targets.
However, a failure to hold the 87,000 Support Zone would signal weakness and could trigger a deeper correction toward the lower channel boundary. For now, the market structure favors long positions, with support holding and resistance as the next upside objective.
That's the setup I'm tracking. Thank you for your attention, and always manage your risk.
EURUSD Short: Head & Shoulders at Resistance - Target 1.1670Hello, traders! EURUSD previously traded within a well-defined Descending Channel, confirming sustained bearish pressure and controlled sell-side momentum. Price consistently respected the channel boundaries, forming a sequence of lower highs and lower lows. Multiple breakout attempts occurred within the channel, but each upside move was capped by the descending resistance, reinforcing the bearish structure. The market eventually reached a clear Pivot Point near the lower channel boundary, where selling pressure weakened and buyers briefly stepped in, producing a corrective rebound rather than a full trend reversal. Following this rebound, EURUSD pushed higher and managed to break above local resistance levels, leading to a short-term bullish expansion. However, this move lacked strong follow-through and transitioned into a distribution phase near the Supply Zone around 1.1760. At this area, price formed a clear Head and Shoulders pattern, signaling exhaustion of bullish momentum and a return of sellers. The left shoulder, head, and right shoulder developed directly under resistance, confirming strong supply presence and rejection from higher prices.
Currently, price has broken below short-term structure and is pulling back from the supply zone, signaling the start of a corrective-to-bearish continuation move. The market is now rotating lower toward the Demand Zone around 1.1670, which aligns with a previous breakout level and acts as the nearest downside objective. This zone represents a key area where buyers may attempt a reaction, but overall structure still favors sellers.
My primary scenario is bearish as long as EURUSD remains below the 1.1760 Supply Zone and continues to show rejection from this area. The current pullback appears impulsive rather than corrective, favoring continuation toward the 1.1670 Demand Zone. A clean breakdown and acceptance below demand would confirm further downside continuation. Until then, this level remains the key decision point. Manage your risk!

EURUSD Fake Breakout Signals Pullback to 1.1700 SupportHello traders! Here’s my technical outlook on EURUSD (4H) based on the current chart structure. EURUSD is trading within a broader bullish recovery after completing a prolonged corrective phase. Earlier, price broke above a descending resistance line, which marked a clear shift in market structure and signaled that sellers were losing control. This breakout initiated a steady bullish move, supported by a rising support line, confirming higher lows and improving momentum. After the breakout, EURUSD continued to push higher and reached the resistance level around 1.1750, where selling pressure emerged. Price briefly spiked above this level, forming a fake breakout, which indicates weak acceptance at higher prices and potential buyer exhaustion. Following this rejection, the market pulled back toward the previous buyer zone, which now acts as a key support level around 1.1700. This zone aligns with the former breakout area and represents an important demand level. Currently, price is consolidating above support, showing hesitation near the buyer zone, and the reaction here will determine the next short-term direction. A corrective pullback into the support zone remains healthy within the broader bullish structure as long as buyers continue to defend this level. My primary scenario is a short-term correction toward the 1.1700 support level (TP1), followed by a potential bullish reaction from this zone. As long as EURUSD holds above this support, the overall structure remains constructive, and buyers may attempt another move toward the 1.1750 resistance and potentially higher. However, a clear breakdown and acceptance below the buyer zone would weaken the bullish setup and open the door for a deeper retracement toward lower support levels. For now, the focus remains on the 1.1700 area, as this level will define whether the market resumes its upward move or extends the correction. Please share this idea with your friends and click Boost 🚀

XAUUSD: Rejection from 4,420 Resistance - Pullback Toward 4,350Hello everyone, here is my breakdown of the current XAUUSD setup.
Market Analysis
XAUUSD continues to trade within a broader bullish structure, but the current price action signals a short-term corrective phase. After forming a strong upward impulse, gold established a well-defined upward channel, confirming buyer control. Price then broke above the previous consolidation range, which marked a continuation of bullish momentum.
Currently, XAUUSD pushed higher and reached the Resistance Zone around 4,410–4,420, a level that has historically acted as a strong supply area. At this zone, price showed clear rejection, with sellers stepping in aggressively and limiting further upside. This reaction suggests that supply is currently outweighing demand at these highs. As a result, price is now pulling back from resistance and moving toward the Support Zone around 4,350, which aligns with the previous breakout area and the lower boundary of the upward channel. This zone represents a key demand area where buyers have previously defended the trend. The recent breakout above this level followed by a retest further strengthens its importance.
My Scenario & Strategy
My scenario remains short-term bearish as long as XAUUSD stays below the 4,410–4,420 Resistance Zone and continues to show rejection from this area. I expect price to retrace toward the 4,350 Support Zone, where the next reaction will be crucial for determining continuation or deeper correction.
Therefore, A clean breakdown below the 4,350 Support Zone would confirm a deeper corrective move within the structure and could open the path toward lower demand levels along the channel support. However, if price reaches support and shows a strong bullish reaction, the broader bullish structure remains intact, and buyers may attempt another push toward the resistance highs. For now, the focus is on the corrective pullback, with 4,350 acting as the key level to watch.
That's the setup I'm tracking. Thank you for your attention, and always manage your risk.

BTCUSDT Long: Demand at 88K Could Fuel a Move to $92,700Hello traders! Here’s a clear technical breakdown of BTCUSDT based on the current chart structure. Bitcoin recently completed a prolonged move lower within a well-defined descending channel, confirming strong bearish pressure during that phase. This bearish structure remained intact until price reached a key pivot low, where selling momentum clearly weakened. After the initial impulsive move higher, BTC tested the 92,700 Supply Zone, where temporary rejection occurred. This reaction resulted in several pullbacks toward the 88,000 Demand Zone, which aligns with previous resistance turned support and the lower boundary of the ascending channel. Each pullback into this demand area was met with buying interest, indicating absorption rather than distribution.
Currently, price is stabilizing above the 88,000 Demand Zone, and the pullbacks remain corrective in nature. Multiple minor breakouts along the channel support further confirm that buyers continue to defend structure. The market is consolidating while maintaining bullish alignment.
My scenario: as long as BTCUSDT holds above the 88,000 Demand Zone, the bullish structure remains intact. A strong reaction from this area could lead to another attempt toward the 92,700 Supply / Resistance Zone. A confirmed breakout and acceptance above 92,700 would open the door for further upside continuation within the ascending channel. Only a decisive breakdown below demand would invalidate the bullish scenario. For now, the bias remains bullish, with buyers in control while price respects the ascending channel. Manage your risk!

DXY BULLISH BREAKOUT|LONG|
✅DXY delivers a clean bullish displacement from demand, printing a clear market structure shift and holding above the dealing range lows. Continuation is favored as premium liquidity remains resting above, with ICT breakout acceptance signaling further expansion toward higher imbalance levels. Time Frame 3H.
LONG🚀
✅Like and subscribe to never miss a new idea!✅

XAUUSD Short: Supply Zone Holds - Gold Slips Into CorrectionHello traders! Here’s a clear technical breakdown of XAUUSD (Gold) based on the current chart structure. Gold is still trading within a broader ascending trend, supported by a well-defined rising trend line from the pivot point. The market previously made an impulsive bullish move, but price has now reached a major Supply Zone around 4,350, where strong selling pressure emerged. This area has already produced a fake breakout, clearly signaling buyer exhaustion and the presence of aggressive sellers at higher levels. At the highs, price action shows hesitation and rejection inside the supply zone, indicating that bullish momentum is weakening rather than continuing. After the fake breakout, gold started to roll over, suggesting that the recent move was a liquidity grab rather than true continuation.
Currently, price is pulling back toward the 4,260 Demand Zone, which also aligns with the rising trend line and a previous breakout area. This zone represents the first key downside target and a critical decision area for the market. The move lower appears impulsive, supporting the idea of a corrective phase turning into a deeper pullback.
My scenario: as long as XAUUSD remains below the 4,350 Supply Zone, the short-term bias favors sellers. I expect continuation to the downside toward the 4,260 Demand Zone. A clean breakdown below this level would signal a loss of bullish structure and open the door for a deeper correction. However, a strong bullish reaction from demand could lead to consolidation or a temporary bounce. For now, the structure favors a short-term bearish correction, with 4,350 as key resistance and 4,260 as the main downside target. Manage your risk!

EURUSD: Rejection From Key Resistance - Support 1.1660 in FocusHello everyone, here is my breakdown of the current EURUSD setup.
Market Analysis
EURUSD is trading within a broader corrective structure, and the current price action suggests increasing bearish pressure near key resistance. Earlier, the pair formed a triangle structure, where price respected both the Triangle Resistance Line and the Triangle Support Line. Multiple breakouts occurred during this phase, but they failed to generate sustained bullish continuation, indicating weakening buyer momentum. After breaking out of the triangle, EURUSD moved higher and entered a consolidation range, where price paused and built liquidity. This range was later resolved to the upside, pushing price into the Resistance Zone around 1.1750. However, this move was followed by a fake breakout, signaling that buyers failed to maintain control above resistance. At the highs, a clear Head and Shoulders pattern has formed, with the left shoulder, head, and right shoulder developing directly under the descending trend line and within the resistance zone. This structure highlights strong seller presence and confirms rejection from higher levels. Price is now rolling over from resistance and starting to move lower.
Currently, EURUSD is pulling back toward the Support Zone around 1.1660, which aligns with previous breakout levels and horizontal demand. This area is acting as the nearest downside target, and price reaction here will be critical.
My Scenario & Strategy
My scenario is bearish as long as EURUSD remains capped below the 1.1750 Resistance Zone and the descending trend line. I expect continuation to the downside toward the 1.1660 Support Zone, which represents the next key level for buyers to attempt a defense. A clean breakdown below the support zone would confirm further bearish continuation and open the path for deeper downside movement.
However, if price reaches support and shows a strong bullish reaction, a short-term bounce or consolidation may occur. For now, the structure favors sellers, with 1.1750 as key resistance and 1.1660 as the main downside target.
That's the setup I'm tracking. Thank you for your attention, and always manage your risk.

GOLD Technical Analysis - Correction Incoming?OANDA:XAUUSD Price is currently trading within a clearly defined ascending channel , with price action now testing the upper boundary. This area may act as dynamic resistance , and if price is rejected here, a corrective move back toward the 4,375 support zone is likely.
If buyers manage to defend this support level, the bullish structure remains intact, opening the door for price to resume its upward move toward higher highs . However, a decisive break below this zone could trigger a deeper pullback toward the lower boundary of the channel .
Closely monitoring candlestick patterns in this area , price reaction on the retest, and confirmation signals is essential to avoid FOMO and time entries effectively. Always apply strict risk management, enter trades only when the setup is confirmed, and stay disciplined with your trading plan.
If you have any thoughts on this setup or additional insights, feel free to share them in the comments.

EURUSD Holds Demand - Retest of 1.1760 Resistance LikelyHello traders! Here’s my technical outlook on EURUSD based on the current chart structure. After a prolonged bearish phase inside a descending channel, EURUSD found a solid base near the lower boundary, where selling pressure weakened and price turned around. This reversal led to a clean breakout above the descending resistance, signaling a shift in market structure from bearish to bullish. Following the breakout, price moved higher but entered a corrective phase, forming a series of pullbacks while maintaining higher lows. As momentum rebuilt, EURUSD broke above the key horizontal level and accelerated into an ascending channel, confirming bullish continuation. Price then pushed into the Seller Zone near 1.1760, where a fake breakout occurred — indicating strong supply but not a full trend reversal. After this rejection, the pair pulled back into the Buyer Zone around 1.1700–1.1720, which aligns with previous resistance turned support and the lower boundary of the ascending structure. Currently, EURUSD is holding above the support level, suggesting that the pullback remains corrective. Buyers continue to defend this zone, keeping the bullish structure intact. My scenario: as long as price holds above the 1.1700 Buyer Zone, EURUSD may bounce and make another attempt toward the 1.1760 Resistance / TP1. A confirmed breakout and acceptance above this level would open the door for further upside continuation. A failure to hold support, however, could lead to a deeper correction within the structure. For now, the bias remains bullish, with support holding and resistance as the main upside target. Please share this idea with your friends and click Boost 🚀

XAUUSD: Resistance Holds Strong - Support $4,270 Retest LikelyHello everyone, here is my breakdown of the current XAUUSD setup.
Market Analysis
XAUUSD is trading within a broader bullish structure, but the current price action shows signs of a short-term corrective phase after a strong impulsive move higher. Earlier, gold successfully broke above the Triangle Resistance Line, which marked the end of the previous bearish pressure and confirmed a shift in market control toward buyers. Following this breakout, price entered a Range phase, where the market consolidated and built liquidity before the next move. This consolidation was later resolved with a strong breakout above the Range, pushing XAUUSD into a higher price zone and confirming continued bullish momentum.
Currently, after the breakout, gold rallied sharply and reached the Resistance Zone around 4,350–4,360, where sellers began to react. This area has historically acted as a strong supply zone, and the current rejection indicates that selling pressure is increasing at these highs. At the moment, price is pulling back from the resistance and moving toward the Support Zone around 4,270, which aligns with the previous breakout structure and the rising Trend Line. This zone represents a key demand area where buyers previously stepped in.
My Scenario & Strategy
My scenario is short-term corrective as long as XAUUSD remains below the 4,350 Resistance Zone and continues to show rejection from this level. I expect price to retrace toward the 4,270 Support Zone, where the next reaction will be critical for short-term direction. A clean breakdown below the 4,270 Support Zone would signal a deeper correction and could open the path toward lower demand levels along the trend line.
However, if price reaches support and shows a strong bullish reaction, the broader bullish structure remains intact, and buyers may attempt another push toward the resistance highs. For now, the market is in a pullback phase, with 4,270 as the key level to watch for confirmation of either continuation or deeper correction.
That’s the setup I’m monitoring. Thank you for your attention, and always manage your risk.

US100 Bullish Breakout! Buy!
Hello,Traders!
US100 delivers a clean bullish break and close above the key horizontal supply, confirming breakout acceptance and displacement. Market structure flips bullish as prior supply turns into support, with liquidity resting above equal highs. Continuation toward premium targets is favored after shallow pullback. Time Frame 6H.
Buy!
Comment and subscribe to help us grow!
Check out other forecasts below too!
Disclosure: I am part of Trade Nation's Influencer program and receive a monthly fee for using their TradingView charts in my analysis.

SILVER Bullish Bias! Buy!
Hello,Traders!
SILVER delivers a clean displacement through a key horizontal range, confirming bullish BOS and smart money continuation. The breakout holds above prior supply-turned-support, suggesting acceptance and strength, with upside liquidity resting at higher premium levels. Time Frame 2H.
Buy!
Comment and subscribe to help us grow!
Check out other forecasts below too!
Disclosure: I am part of Trade Nation's Influencer program and receive a monthly fee for using their TradingView charts in my analysis.

Bitcoin Tests Resistance - Downside Risk Toward $85,700Hello traders! Here’s my technical outlook on BTC/USD based on the current chart structure. After a prolonged bearish move inside a clearly defined descending channel, Bitcoin attempted a recovery and managed to break out of the channel. However, this upside move lacked strong follow-through. Price entered a consolidation range, where multiple reactions and fake breakouts signaled distribution rather than accumulation. This behavior suggested that sellers were still active at higher levels. Following the range, BTC formed a triangle structure, capped by a descending Triangle Resistance Line and supported by a rising Triangle Support Line. Price has been compressing within this structure, but recent attempts to push higher were rejected near the 88,500 Resistance Level (TP1), confirming strong selling pressure at this zone. Currently, BTC is trading near the upper boundary of the triangle, where sellers continue to defend resistance. As long as price remains below the Triangle Resistance Line and fails to reclaim 88,500, the bearish scenario remains in play. My scenario: I expect a rejection from the triangle resistance, followed by a move back toward the 85,700 Support Level, which aligns with both horizontal support and the lower triangle boundary. A clean breakdown below 85,700 would confirm bearish continuation and open the door for a deeper decline. Only a strong breakout and hold above 88,500 would invalidate this short setup. For now, the market favors sellers below resistance, with 88,500 as key resistance and 85,700 as the main downside target. Please share this idea with your friends and click Boost 🚀

EURUSD Bullish Continuation Toward 1.17802Quick Summary
After the recent strong rally, EURUSD is expected to continue higher following a brief corrective move. The pair has not yet reached 1.17802, which remains a valid upside target. A pullback toward the H1 orderblock at 1.17080, aligned with the 61 Fibonacci level, may provide a solid buy opportunity if a clear reversal signal appears.
Full Analysis
EURUSD has delivered a strong bullish move recently, confirming sustained buying pressure in the market. Despite this strength, EURUSD has not yet reached the key level at 1.17802, which remains an active target within the current bullish structure.
Before continuing toward this level, a short term correction is likely. This pullback is expected to bring price into the H1 orderblock around 1.17080. The importance of this zone is reinforced by its alignment with the 61 Fibonacci retracement, making it a technically strong area for potential demand.
The preferred approach is not to buy the level blindly. A clear reversal signal or rejection from the orderblock is required to confirm that buyers are stepping back in. If such a reaction appears, the correction would likely be complete, opening the path for EURUSD to resume its upward move and continue toward 1.17802.

Gold Holds Firm at Elevated LevelsGold is trading today around 4,340 USD, almost unchanged from the previous session, indicating that the market remains stable at high levels after the recent strong rally.
Notably, during the prior U.S. session, gold surged to 4,367 USD, marking a new all-time high, before undergoing a mild pullback toward the end of the session. This highlights that buying interest remains highly active whenever the market is supported by favorable catalysts.
The main driver behind this move came from weaker-than-expected U.S. manufacturing data. The December Philadelphia Fed Manufacturing Index plunged to -10.2, far below forecasts, reigniting concerns about economic health and immediately triggering safe-haven flows into gold.
The release of these disappointing manufacturing figures alongside the November CPI and weekly jobless claims created a convergence effect, pushing gold into positive territory and driving prices to new record highs.
Although some forward-looking indicators continue to suggest growth expectations over the next six months, persistent price pressures and signs of economic slowdown are reinforcing expectations of a more accommodative monetary policy. This continues to provide a solid foundation for gold’s medium-term bullish trend.

XAUUSD 51st Record High of 2025 | Symmetrical Triangle BreakoutHistoric Context - A Record-Breaking Year
According to the Wall Street Journal and Dow Jones Market Data released December 19, 2025:
Gold futures have closed at record highs 51 times in 2025
Price has surged 66 percent year-to-date to 4387.30 USD per troy ounce
This is gold's best annual performance since 1979
Silver has soared 131 percent in 2025, hitting 14 record highs
Both metals are on pace for their biggest gains since 1979, the last year they hit this many records
This historic context is critical for understanding current price action. We are not in a normal market environment. Gold is experiencing a generational bull run driven by central bank accumulation, geopolitical uncertainty, and monetary policy expectations.
Current Market Context - December 20, 2025
Gold experienced volatility following the Federal Reserve December 18, 2025 policy decision. The central bank maintained its hawkish stance, projecting fewer rate cuts for 2026 than markets anticipated. Despite this headwind, gold recovered and hit another record high on December 19.
The resilience above 4300 USD despite hawkish Fed rhetoric demonstrates the strength of underlying demand from central banks and institutional investors.
Key Events This Week:
December 18: Federal Reserve held rates steady, projected only two rate cuts for 2026 versus market expectations of three to four
December 18: US Dollar Index surged following hawkish Fed commentary, initially pressuring gold
December 19: Gold recovered to close at 51st record high of 2025 at 4387.30 USD according to WSJ
December 19: CFTC COT report released showing strong speculative long positioning
December 20: Price consolidating near 4338 USD within symmetrical triangle pattern
Ongoing: PBOC and Chinese ETF buying continues despite record high prices
Ongoing: Physical demand weakness in India and China as discounts widen to multi-year highs
Technical Structure Analysis
Pattern Identification - Symmetrical Triangle
The 45-minute chart displays a textbook symmetrical triangle formation characterized by:
Converging trendlines with lower highs and higher lows
Decreasing volatility as price compresses toward the apex
Volume declining during the consolidation phase
Pattern duration of approximately 10-12 days
Apex convergence point approaching within the next 24-48 hours
Symmetrical triangles are continuation patterns approximately 55-60 percent of the time, but given the preceding choppy price action, this formation could break in either direction.
Triangle Boundaries
Upper Trendline (Descending Resistance):
Connects the highs from December 12-13 around 4380-4390 USD
Currently intersecting near 4355-4360 USD
A decisive close above this trendline signals bullish breakout
Lower Trendline (Ascending Support):
Connects the lows from December 9-10 and December 18-19
Currently providing support near 4300-4310 USD
A decisive close below this trendline signals bearish breakdown
Key Price Levels
Resistance Levels:
4355-4360 USD - Descending trendline resistance immediate
4380-4390 USD - Recent swing high and horizontal resistance
4400-4410 USD - Psychological resistance and previous rejection zone
4450-4475 USD - Major resistance from November 2025 highs
4500 USD - Psychological round number and measured move target
Support Levels:
4310-4320 USD - Ascending trendline support immediate
4280-4290 USD - Horizontal support from December lows
4250-4260 USD - Previous consolidation zone
4200-4220 USD - Major support and psychological level
4150-4175 USD - Secondary support if breakdown accelerates
Moving Average Analysis
Price is oscillating around the 20-period moving average indicating indecision
The 50-period moving average is relatively flat confirming the consolidation phase
The 200-period moving average on higher timeframes remains in uptrend supporting long-term bullish bias
A sustained move above the 20 and 50 MAs would confirm bullish momentum
A breakdown below both MAs would signal bearish continuation
RSI Analysis
RSI on the 45-minute timeframe is currently neutral oscillating between 45-55
No overbought or oversold conditions present
RSI is forming a similar compression pattern to price suggesting energy building for directional move
Watch for RSI to break above 60 for bullish confirmation or below 40 for bearish confirmation
Volume Analysis
Volume has been declining during the triangle formation typical behavior before breakout
Expect volume surge on the breakout candle to confirm validity
Low volume breakouts often result in false moves and should be treated with caution
Watch for volume at least 150 percent of average on breakout candle
Fibonacci Analysis
Measuring from the December low near 4200 USD to the December high near 4390 USD:
0.236 retracement: 4345 USD - Currently testing this level
0.382 retracement: 4317 USD - Aligns with triangle support
0.5 retracement: 4295 USD - Key level if support breaks
0.618 retracement: 4273 USD - Strong support zone
Current price action around 4338 USD is testing the 0.236 Fibonacci level, a relatively shallow retracement suggesting buyers remain interested.
CFTC Commitments of Traders Analysis - December 19, 2025
The latest COT report released December 19, 2025 provides critical insight into market positioning:
Gold Futures Only Positions as of December 9, 2025:
Open Interest: 432,569 contracts
Non-Commercial Long: 268,485 contracts ( 62.1 percent of open interest)
Non-Commercial Short: 44,599 contracts (10.3 percent of open interest)
Commercial Long: 63,707 contracts (14.7 percent)
Commercial Short: 326,286 contracts ( 75.4 percent )
Changes from December 2, 2025:
Open Interest increased by 14,079 contracts
Non-Commercial Longs added 7,154 contracts
Non-Commercial Shorts added only 828 contracts
Commercial Shorts added 10,791 contracts
COT Interpretation:
The positioning data reveals several important dynamics:
Speculators (Non-Commercial) are heavily net long with 62.1 percent long versus only 10.3 percent short
This represents a 6:1 long to short ratio among speculators - extreme bullish positioning
Commercial hedgers (producers and merchants) are heavily short at 75.4 percent, which is normal hedging behavior in a bull market
Open interest is increasing alongside price, confirming the uptrend has participation
The continued addition of speculative longs suggests momentum traders remain committed to the bull case
Warning Signal: Extreme speculative long positioning can precede corrections when longs begin to take profits. However, in strong trending markets, positioning can remain extreme for extended periods. The key is watching for a shift in the weekly changes - if longs start liquidating while price stalls, that would be a bearish signal.
Physical Demand Analysis - Asia Market Weakness
Reuters reported on December 19, 2025 that physical gold demand in Asia has weakened significantly due to record high prices:
India Market:
Dealers offering discounts of up to 37 USD per ounce to official domestic prices, up from 34 USD last week
Domestic gold prices hit fresh record of 135,590 rupees per 10 grams
Demand is roughly one quarter of normal levels according to PN Gadgil and Sons CEO
Wedding season jewelry purchases dampened despite being peak demand period
Demand expected to remain subdued as prices continue rising
China Market:
Bullion trading at discounts of up to 64 USD to global benchmark - highest in over five years
This is the widest discount since August 2020 during COVID-19 pandemic
Wholesale and retail demand described as incredibly weak by analyst Ross Norman
However, ETF buying and PBOC purchases continue despite weak physical demand
Other Asian Markets:
Singapore: Trading from 0.5 USD discount to 2.2 USD premium
Hong Kong: Trading from par to 1.8 USD premium
Japan: Discounts up to 6.0 USD, though retail shops out of gold bar stocks
Physical Demand Interpretation:
The divergence between weak physical demand and strong prices is significant:
Traditional price-sensitive buyers in India and China are stepping back at these levels
However, institutional demand (ETFs, central banks) is offsetting physical weakness
PBOC continues accumulating gold as part of reserve diversification strategy
This suggests the rally is being driven by institutional and speculative flows rather than traditional jewelry demand
A correction could occur if institutional buying slows, as physical demand is unlikely to provide support at current prices
Fundamental Analysis
Federal Reserve Policy Impact
The December 18, 2025 FOMC meeting delivered several key takeaways affecting gold:
Interest rates held steady as expected but forward guidance was more hawkish than anticipated
Dot plot projections showed median expectation of only two rate cuts in 2026
Fed Chair emphasized data dependency and willingness to maintain restrictive policy longer if needed
Inflation concerns remain despite progress with services inflation proving sticky
Labor market remains resilient reducing urgency for rate cuts
Implications for Gold:
Higher-for-longer interest rates are traditionally bearish for gold as they increase the opportunity cost of holding non-yielding assets. However, gold has shown remarkable resilience to rate expectations in 2024-2025, suggesting other factors are driving demand.
US Dollar Dynamics
The US Dollar Index strengthened following the hawkish Fed reaching multi-week highs
Dollar strength typically pressures gold prices due to inverse correlation
However the correlation has weakened in recent months as both assets attract safe-haven flows
Watch DXY price action for confirmation of gold direction
A reversal in dollar strength would provide tailwind for gold
Central Bank Demand
Central bank gold purchases remain a crucial support factor despite weak retail demand:
Global central banks have been net buyers of gold for consecutive years
PBOC (People's Bank of China) continues accumulating gold alongside Chinese ETF buying according to analyst Ross Norman
India central bank has increased gold reserves significantly
Emerging market central banks continue accumulating gold as reserve diversification from USD
This institutional and central bank demand is offsetting weak physical retail demand in Asia
Central bank buying provides structural floor under prices even when retail demand weakens
Geopolitical Factors
Safe-haven demand remains elevated due to:
Russia-Ukraine conflict continues with no resolution in sight
Middle East tensions remain elevated with ongoing regional instability
US-China relations remain strained with trade and technology disputes
Global election cycle creating policy uncertainty
Debt ceiling and fiscal concerns in major economies
These factors support gold safe-haven bid and help explain its resilience despite hawkish Fed policy.
Directional Bias Assessment
Arguments for Bullish Breakout:
Gold has hit 51 record highs in 2025 - momentum clearly favors bulls
Best annual performance since 1979 with 66 percent YTD gains
Long-term uptrend remains intact on daily and weekly timeframes
COT data shows speculators adding to long positions with 62.1 percent long exposure
Central bank and ETF demand continues despite weak physical demand
PBOC accumulation ongoing according to analyst reports
Geopolitical tensions maintaining safe-haven bid
Technical measured move target of 4480-4500 USD if triangle breaks higher
Arguments for Bearish Breakdown:
Extreme speculative long positioning (6:1 ratio) creates correction risk
Physical demand in India at one quarter of normal levels
China discounts at 64 USD - widest since August 2020
Hawkish Fed policy supporting stronger dollar and higher yields
Price has risen 66 percent in one year - mean reversion risk elevated
Holiday liquidity reduction could exacerbate any profit-taking
Technical measured move target of 4200-4220 USD if triangle breaks lower
My Assessment - Cautiously Bullish with Correction Risk:
The weight of evidence supports the bull case given the historic momentum and institutional demand. However, several warning signs warrant caution:
Extreme speculative positioning creates vulnerability to profit-taking
Physical demand weakness in Asia suggests price-sensitive buyers are exhausted
The rally is increasingly dependent on institutional flows rather than broad-based demand
Short-term (next 1-2 weeks): Neutral to slightly bearish. The combination of extreme positioning, weak physical demand, and holiday liquidity conditions creates correction risk. A pullback to 4280-4320 USD would be healthy and provide better entry for longs.
Long-term (1-3 months): Bullish. The structural drivers (central bank buying, geopolitical uncertainty, monetary policy expectations) remain intact. Any correction should be viewed as buying opportunity. Targets of 4500-4600 USD remain valid for Q1 2026.
Trade Framework
Scenario 1: Bullish Breakout Trade
Entry Conditions:
45-minute candle closes decisively above 4360 USD upper trendline
Volume on breakout candle exceeds 150 percent of 20-period average
RSI breaks above 60 confirming momentum
Ideally accompanied by dollar weakness DXY declining
Trade Parameters:
Entry: 4365-4370 USD on confirmed breakout
Stop Loss: 4330 USD below triangle midpoint
Target 1: 4400-4410 USD previous resistance
Target 2: 4450-4460 USD November highs
Target 3: 4500-4520 USD measured move target
Risk-Reward: Approximately 1:2.5 to first target
Scenario 2: Bearish Breakdown Trade
Entry Conditions:
45-minute candle closes decisively below 4300 USD lower trendline
Volume on breakdown candle exceeds 150 percent of 20-period average
RSI breaks below 40 confirming bearish momentum
Ideally accompanied by dollar strength DXY rising
Trade Parameters:
Entry: 4295-4300 USD on confirmed breakdown
Stop Loss: 4340 USD above triangle midpoint
Target 1: 4250-4260 USD horizontal support
Target 2: 4200-4220 USD major support
Target 3: 4150-4175 USD measured move target
Risk-Reward: Approximately 1:2 to first target
Risk Management Guidelines
Position sizing should not exceed 1-2 percent risk per trade given current volatility
Reduce position size during holiday period due to lower liquidity
Use hard stop losses do not move stops further from entry
Scale out of positions at each target level 33 percent at each target
Move stop to breakeven after first target achieved
Avoid holding large positions over weekend given geopolitical risks
Monitor DXY and Treasury yields for confirmation of gold direction
Be prepared for false breakouts wait for candle close confirmation
Invalidation Levels
Bullish thesis invalidated if:
Price closes below 4250 USD on daily timeframe
Triangle breaks down with volume confirmation
DXY breaks to new highs above 110
Bearish thesis invalidated if:
Price closes above 4410 USD on daily timeframe
Triangle breaks up with volume confirmation
DXY reverses sharply below 106
Conclusion
OANDA:XAUUSD has delivered a historic performance in 2025 with 51 record highs and 66 percent gains - the best year since 1979. The precious metal is currently consolidating within a symmetrical triangle near 4338 USD, setting up for the next directional move.
Key Data Points:
51 record highs in 2025 according to Dow Jones Market Data
66 percent YTD gains - best since 1979
COT shows 62.1 percent speculative long positioning (6:1 long/short ratio)
India physical demand at 25 percent of normal levels
China discounts at 64 USD - widest since August 2020
PBOC and ETF buying continues despite weak retail demand
Key Takeaways:
The symmetrical triangle is approaching its apex suggesting a breakout is imminent within the next 24-72 hours
Historic momentum (51 records) supports bullish bias but extreme positioning creates correction risk
Physical demand weakness in Asia is a warning sign that price-sensitive buyers are exhausted
Institutional demand (central banks, ETFs) is currently offsetting retail weakness
Short-term bias is neutral with correction risk; long-term bias remains bullish
Bullish breakout targets 4450-4500 USD; bearish breakdown targets 4250-4280 USD
Risk management is critical given extreme positioning and holiday liquidity conditions
The optimal approach is to wait for confirmed breakout with volume rather than anticipating direction. Given the extreme speculative positioning, any breakdown could trigger rapid profit-taking. Conversely, a breakout to new highs could accelerate as shorts cover.
Trade the breakout, not the anticipation. Let price confirm direction before committing capital.
This is not financial advice. Always conduct independent research and manage risk appropriately.

USD-CHF Free Signal! Sell!
Hello,Traders!
USDCHF breaks decisively below a well-respected horizontal supply zone, confirming smart money distribution after a failed bullish attempt. Buy-side liquidity has been cleared, and price acceptance below the level signals bearish continuation toward resting sell-side liquidity at lower imbalance zones.
--------------------
Stop Loss: 0.7938
Take Profit: 0.7907
Entry: 0.7927
Time Frame: 3H
--------------------
Sell!
Comment and subscribe to help us grow!
Check out other forecasts below too!
Disclosure: I am part of Trade Nation's Influencer program and receive a monthly fee for using their TradingView charts in my analysis.

Gold Maintains Its UptrendHello everyone, what’s your view on today’s global gold price?
Gold is rebounding above 4,350 USD early in the session, supported by escalating geopolitical tensions. The Israel–Iran conflict, along with developments involving the U.S. and Venezuela, is driving investors toward gold as a safe-haven asset.
At this stage, the bullish trend remains intact. The 4,400 USD level has been reached for the first time and successfully closed in the short term. As no new peak has yet been firmly established, the upside bias continues to dominate.
Do you agree with this outlook?

Gold vs Real Estate: Which Is Safer?Gold vs Real Estate: Which One Truly Keeps Your Money Safe in Uncertain Times?
When markets turn unstable, the first question that always comes up is: “ How do I keep my money safe ?”
Almost immediately, two familiar names are put on the scale: gold and real estate .
One is a globally recognized defensive asset.
The other is a tangible asset tied to land and long-term growth cycles.
But safety does not lie in the name of the asset — it lies in how you use it .
Safety does not mean “never going down”
Many people mistakenly believe that a safe asset is one that never declines in price. In reality, every asset goes through corrections .
True safety means:
When you need cash, can you actually convert it?
When markets deteriorate, can you withstand the psychological and cash-flow pressure?
When the cycle shifts, does that asset help you survive?
And this is exactly where gold and real estate begin to diverge.
Gold — safety through liquidity and defense
Gold is considered safe because it does not depend on a single economy . When inflation rises, crises emerge, or confidence in fiat currencies weakens, gold is often chosen as a safe haven.
Gold’s greatest strength is liquidity . It can be converted into cash almost instantly, nearly anywhere in the world. This makes gold an effective defensive tool during periods of strong market volatility.
However, gold does not generate cash flow . Its price can also move sideways for long periods, requiring patience and a capital-preservation mindset rather than a get-rich-quick mentality.
Real estate — safety through tangibility and long-term value
Real estate feels safe because it is tangible and familiar . The land remains. The property remains. Over the long term, real estate tends to appreciate alongside economic growth and urbanization.
In addition, real estate can generate rental income , something gold cannot offer. For investors with stable capital and no pressure to rotate funds quickly, this is a major advantage.
The trade-off, however, is low liquidity . When markets weaken or credit conditions tighten, selling property can take a long time. If leverage is involved, this so-called “safe asset” can quickly become a financial burden.
The core difference: time horizon and flexibility
Gold suits investors who value flexibility and fast response .
Real estate suits those with long-term vision, substantial capital, and the ability to endure cycles .
Gold helps you defend in the short to medium term .
Real estate helps you build wealth over the long term .
No asset replaces the other.
They differ only in their role within your financial strategy .

Moderna breaking out cannot possibly be good newsAfter forming a big base throughout 2025, the stock has broken out. "The bigger the base, the higher in space" totally applies to this situation.

NZDUSD FREE SIGNALS|SHORT|
✅NZDUSD has broken below a key ICT supply zone with strong bearish displacement, confirming a market structure shift. The move suggests sell-side liquidity is being targeted, with price likely to continue lower after this minor reaction into former supply.
—————————
Entry: 0.5768
Stop Loss: 0.5771
Take Profit: 0.5748
Time Frame: 5H
—————————
SHORT🔥
✅Like and subscribe to never miss a new idea!✅
