$OPEN - OpenDoor Tech - $9.69 Retest - $10.87 PT🧠 Technical Overview
Ticker: NASDAQ:OPEN (Opendoor Technologies Inc.)
Timeframes: 15-min & 4-hour combo
Current Price: ~$9.30
Trend Summary:
Strong bounce from $8.10 base with two clean BOS (break of structure) signals.
Retested and held $9.19 intraday; momentum candle formed near close.
Channel projection (yellow) shows potential path toward $10.87 → $10.97 short-term.
Volume uptick confirms accumulation — buyers stepping back in.
Key supports: $8.43 / $8.10
Analysis Overview:
NASDAQ:OPEN (Opendoor) is back in motion!
After reclaiming $9.00 support and breaking its short-term structure, the chart shows a clean path toward $10.87–$11.00.
Volume confirms renewed buyer strength after weeks of consolidation near $8.
Watch $9.69 for breakout confirmation — trend remains bullish above $8.43.
#Opendoor #OPEN #NASDAQ #MomentumTrading #RealEstateTech #AIStocks #MyMIWallet
Breakout!

CROX BULLISH OCT 7 2025Crox is looking good here as price has a support from higher time frames. Price is also trying to narrow its range. I am long here . Do not blindly trade any thing
Always manage your risk & then trade

AUDUSD: Trend ContinuationKey Observations
Daily Timeframe:
EMA20 remains above EMA60 > uptrend indication
Price holds above HTL > no strong downside momentum
H1 Timeframe:
Price crossed above DTL and holds
Price pulled back to DTL and held above it
Price also exited EMA band with momentum strength

$RR - Richtech Robotics - $7.25 RetestNASDAQ:RR (Richtech Robotics) continues its breakout trend, now holding above $6.50 after reclaiming key $5.70 support.
Momentum volume is accelerating as automation and AI robotics names heat up again.
Channel projections show room toward $7.25–$7.60 in the near term if bulls hold trend support.
#RichtechRobotics #RR #AIStocks #Automation #NASDAQ #MomentumTrading #MyMIWallet

$DVLT - #DataVault #AI - $2.68 PTNASDAQ:DVLT has officially broken out above $2.00 after multiple retests of the $1.10–$1.40 range last week. Momentum remains strong following its IBM partnership news, and price action is respecting an ascending channel projecting toward $2.50–$2.80.
A clean hold above $1.74 could confirm continuation — eyes on the next leg up.
#DatavaultAI #DVLT #AI #AIStocks #MomentumTrading #NASDAQ #StockMarket

EURSEK: Trend ContinuationKey Observations
Daily Timeframe:
Price breaks HTL and shows downtrend confluence with EMAs
EMA20 is also expanding away from EMA60 to indicate the downtrend continuation
H1 Timeframe:
Swinging this downtrend as intraday upside is exhausted
Price is also showing confluence with EMA20 and EMA60

BTCUSD Setup You Can’t MissHey everyone, Kilian here!
The Bitcoin market keeps showing positive signals as the uptrend holds steady. On the technical chart, a double bottom pattern is gradually taking shape, with the first low followed by a higher low, a clear sign that buying pressure is building. At the moment, price is trading just above the neckline, a critical level that many analysts see as the key decision point for the next move.
If price holds above the neckline and confirms the breakout, the bullish scenario aiming toward 124,625 becomes stronger. But if the market slips back below this level, it could signal buyer weakness and raise the risk of a reversal.
As always, traders should wait for clear confirmation before entering, and stick to strict risk management rules in this volatile environment.
Trade safe and stay disciplined.

ETHEREUM BULLISH BREAKOUT|LONG|
✅ETHUSD shows a clean breakout above the key level as ICT traders anticipate continuation toward the next liquidity pool near 4,760$. Price may retest the breakout zone before pushing higher. Time Frame 2H.Setup Risk: High!
LONG🚀
✅Like and subscribe to never miss a new idea!✅

USDCAD: H1 ConfluenceKey Observations
Daily Timeframe:
On Friday's close last week, price held above the daily level
This week's open indicate price is likely held supported
H1 Timeframe:
There's confluence on the H1 timeframe where price is crossing above the DTL
Price is also moving away from the EMA band, which indicates momentum could be picking up here

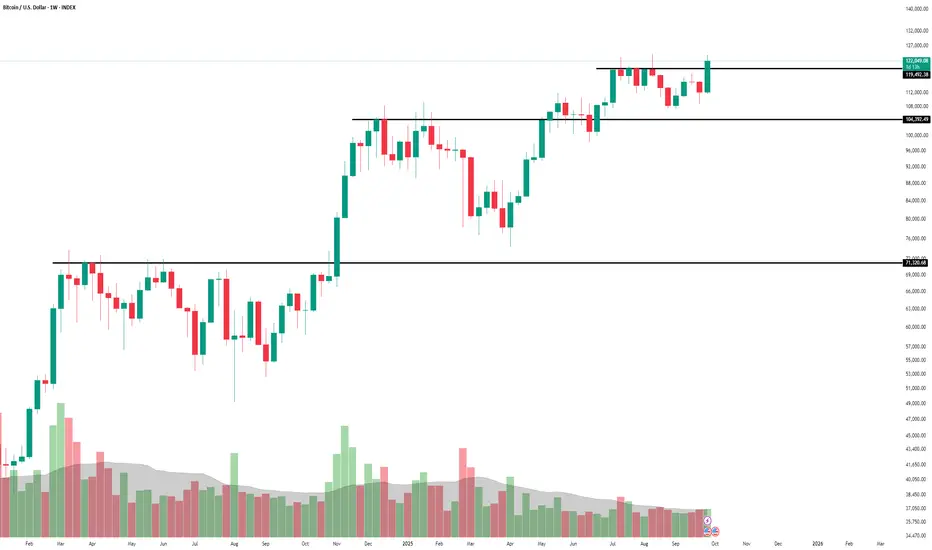
06/10/25 Weekly OutlookLast weeks high: $125,735.08
Last weeks low: $111,559.20
Midpoint: $118,6547.14
New All Time High for Bitcoin in the first week of "Uptober", really impressive strength since flipping $117,500.
BTC still finds itself within a range between ATH and $108,000 but with such strength on the bounce from range lows, could we see price discovery going into the last leg of the year?
From a macro perspective month/quarter end is now over and done with, banks have completed their window dressing/de-risking and we can expect liquidity to flow back into the risk markets. Rate cut cycle continues, M2 Global money supply at ATH with seemingly no plans to stop in the near future.
For now I am still treating trading BTC as it is in a range until we get price acceptance above $125,000. If there is a breakout above and a rally altcoins should follow. In terms of news releases this week because of the US Government shutdown there is a disruption on data releases but overall nothing of great importance is disrupted.
Good luck this week everybody!

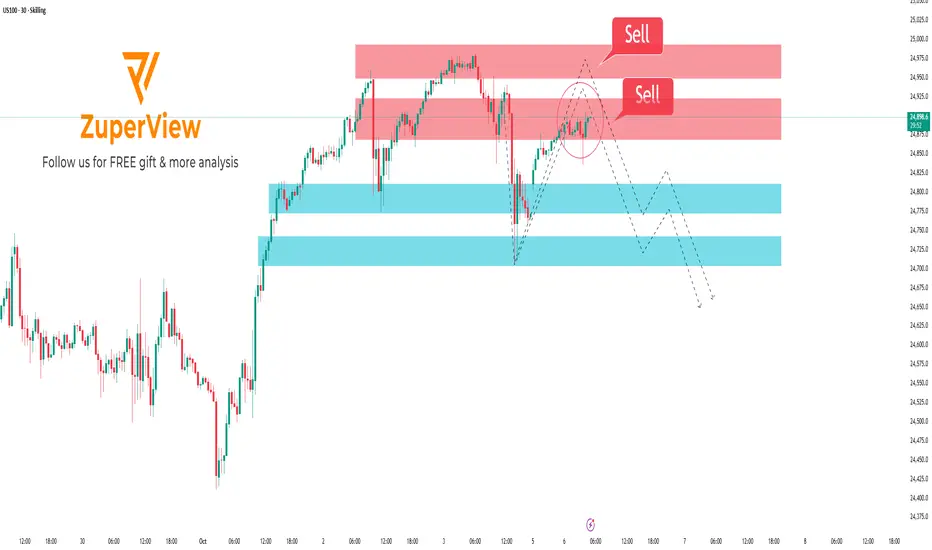
US100: Strong resistance sell setup on the 30-minute chart
📈 SKILLING:US100 — Technical Analysis: Sell Setup Near Strong Resistance
🔍 Technical Analysis:
• Currently, US100 price is approaching a significant resistance zone (highlighted in red). This area has acted as a strong ceiling in recent sessions, where sellers tend to emerge.
• The price has rallied back after a sharp decline but is showing signs of slowing momentum as it nears this resistance. This often leads to a rejection rather than a clean breakout, especially on a 30-minute timeframe.
• Below, the light blue zones represent key support levels, which could serve as realistic targets if sellers regain control. These zones are important areas where buyers previously stepped in, creating potential bounce points.
• The drawn dashed lines illustrate a possible price path: a test of the resistance level, failure to break higher, followed by a pullback and continuation of the downward trend.
• For confirmation of the sell setup, traders should look for reversal candlestick patterns such as rejection wicks (long upper shadows), bearish engulfing candles, or pin bars at the resistance zone. These signals help validate that sellers are gaining dominance.
• Volume and momentum indicators should also be monitored for divergence or weakening bullish pressure near resistance to strengthen the case for a sell.
📊 Trade Considerations:
• Entering a sell position should be done only after clear confirmation of price rejection at resistance.
• Setting a stop loss slightly above the resistance zone helps manage risk in case of a false breakout.
• Targets can be placed near the support zones (light blue areas), with partial profit-taking to lock gains while allowing some position to run if price reacts there.
📌 Summary:
The technical structure of US100 on the 30-minute chart suggests a high probability of price reversal from the strong resistance area. A cautious sell setup is favored, waiting for confirming price action signals to reduce risk. Proper risk management is essential to navigate potential volatility near this key level.
Please like and comment below to support our traders. Your reactions will motivate us to do more analysis in the future 🙏✨
Harry Andrew @ ZuperView
Gold Technical Analysis – Is a Pullback Coming?XAUUSD is currently moving within a well-defined ascending channel, and the price is testing the upper boundary. This area acts as a dynamic resistance, and if the price gets rejected here, we could see a mild pullback back toward the support zone around 3,900.
If buyers manage to defend this support, the bullish structure remains intact and gold could attempt to push higher again. On the other hand, if support breaks, a deeper correction toward the lower boundary of the channel is possible, creating potential short opportunities for traders waiting for the right setup.
To identify an optimal entry point, watch for confirming signals such as a bullish engulfing pattern, long rejection wicks at support, or a sudden surge in buying volume. Risk management should always be your top priority. Make sure signals are clearly confirmed and apply a solid risk management strategy before entering a position.
What’s your take on this? Share your thoughts and strategies in the comments! And don’t forget, discussions in the TradingView community are a great way to sharpen your trading skills and grow together as traders.
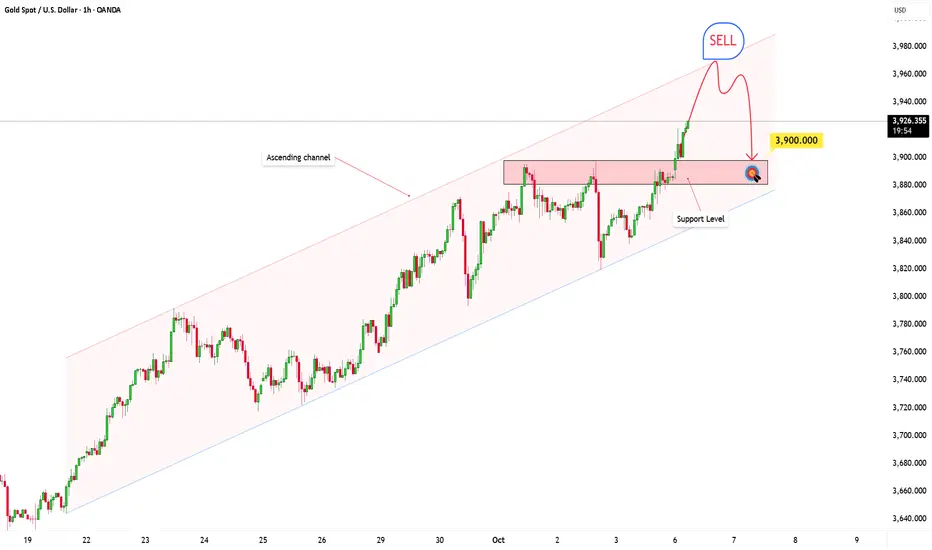
XAUUSD: Stepping Up Within the Rising ChannelHello everyone, Kilian here!
Gold (XAUUSD) is currently in a strong upward trend, moving within a rising price channel. Recently, the price pulled back from the top of the channel and touched the lower boundary, where it faced significant resistance. This suggests that buyers are stepping back into the market, pushing the price higher once again.
If the bullish momentum continues, we could see the price break through the top of the channel, signaling a further upward move. Given the current market conditions, this scenario looks quite likely.
However, if the price closes below the lower boundary of the channel, the bullish trend could be invalidated, and we may see a shift toward a downtrend. At that point, we’ll need to be cautious and watch for any potential short-term pullbacks as the market adjusts.

AUDUSD: Momentum Picking UpKey observations
Daily Timeframe:
Price holds above EMA20 and bullish bar indicates potential upside momentum
EMA20 remains above EMA60 to technically indicate uptrend
H1 Timeframe:
Price cross above DTL to indicate upside momentum
Price also crossing above EMA20 to indicate uptrend resumption

AUDCAD: DTL BreakoutDaily Timeframe:
Bullish bar on market open indicates strength
Bullish bar also covering dojis on two previous days
H1 Timeframe:
Price crosses above DTL as first indication of momentum
Price is above crossing above EMA20
EMA20 is also expanding away from EMA60
Price crossing back above EMA60 indicates bearish sentiment is unlikely to hold

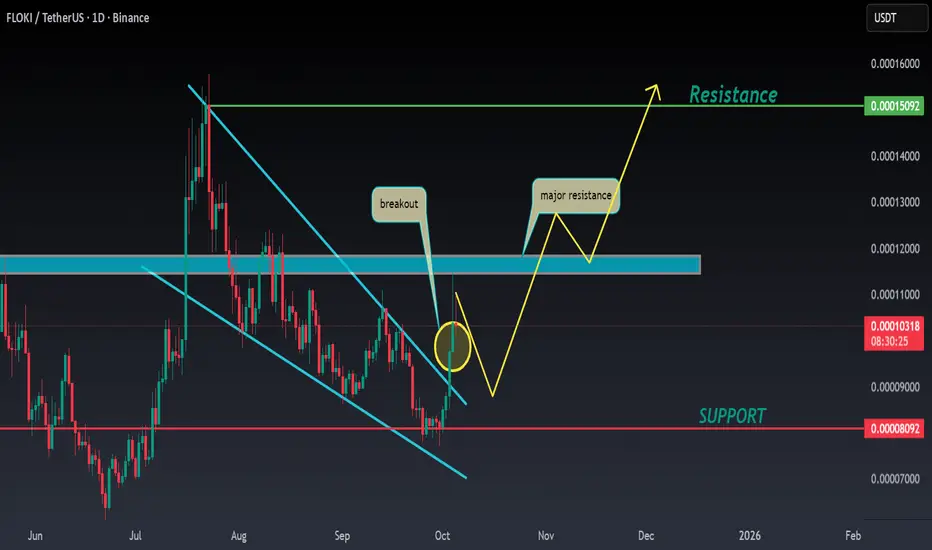
FLOKI ANALYSIS📊 #FLOKI Analysis
✅There is a formation of Falling Wedge Pattern on daily chart with a breakout and currently pullback from its major resistance zone 🧐
Pattern signals potential bullish movement incoming in few days
👀Current Price: $0.00010
🚀 Target Price: $0.00015
⚡️What to do ?
👀Keep an eye on #FLOKI price action and volume. We can trade according to the chart and make some profits⚡️⚡️
#FLOKI #Cryptocurrency #TechnicalAnalysis #DYOR
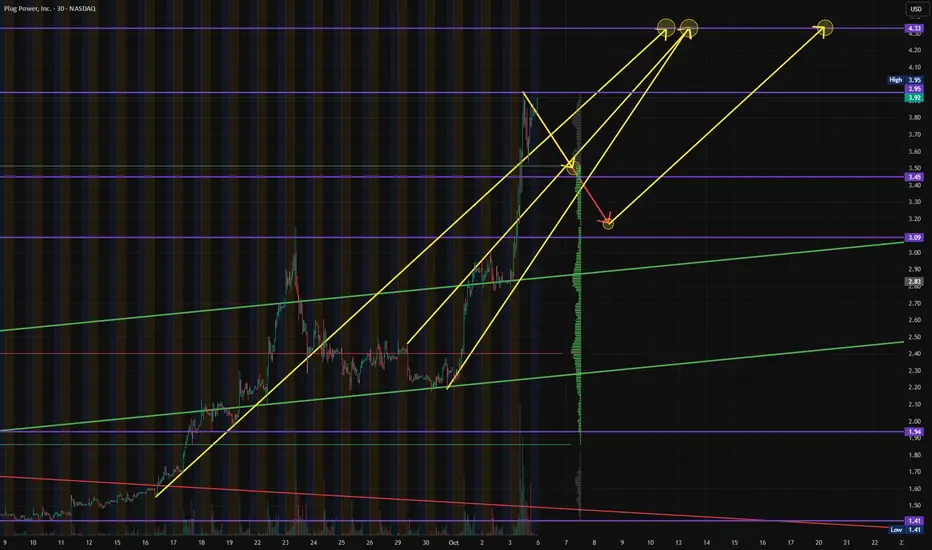
$PLUG - Plug Power, Inc - $4.33 Short-Term PT/UpdateNASDAQ:PLUG hit our previous $3.45 PT and broke out to $3.95 Level of Resistance. If we can't find the volume to keep pushing through those $3.95's, then we'll be looking for the following Re-Entries: $3.20 - $3.45
Price Target: $4.33
XAUUSD Long: Path to 3975 After CorrectionHello, traders! The price auction for XAUUSD has been in a powerful and sustained bullish phase, with the market structure being clearly defined by a major ascending trend line. This uptrend has demonstrated significant strength, breaking through multiple key resistance levels such as the 3630 demand 2 and the 3820 demand 1 levels, confirming that buyers are in full control of the market.
Currently, after reaching a new high, the price has entered a corrective phase. This pullback is guiding the auction down towards the major ascending trend line that has been the backbone of this entire upward move. This area represents a critical test of the trend's integrity and a key zone for buyers to show their initiative.
My scenario for the development of events is a continuation of the primary uptrend. I believe that this correction is a healthy pullback and an opportunity for buyers to re-enter at a value area. In my opinion, the price will find strong support on the ascending trend line, leading to a reversal and the start of the next impulsive wave higher. The take-profit is therefore set at 3975. Manage your risk.

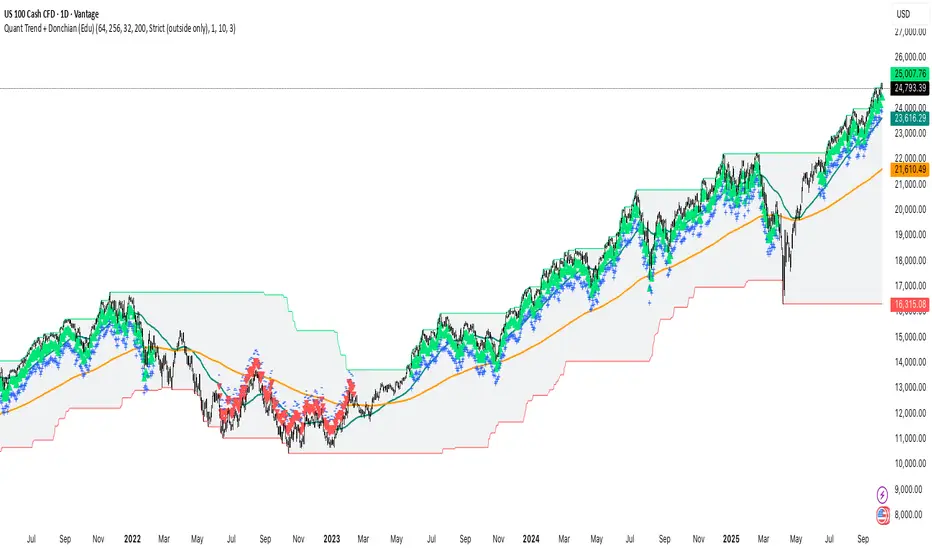
Trend-Following + Donchian Breakout (Regime Visualizer)Most traders chase trends too late or exit too early.
Quant systems don’t predict — they measure and adapt.
This educational chart uses the public Quant Trend + Donchian indicator to visualize how trend-following and breakout logic can define market regimes in NASDAQ 100 & S&P 500.
⚙️ Core Logic
• Trend — EMA(64 vs 256): approximates EWMAC trend state.
• Breakout — Donchian (200): identifies volatility-based range breaks.
• Volatility awareness — internally normalized to adjust behavior across markets.
📊 How to read it
• EMA fast > EMA slow and price near Donchian high → bullish trend regime.
• EMA fast < EMA slow and price near Donchian low → bearish regime.
• Inside channel with EMAs tangled → range or noise.
💡 Key insight
Regime definition + volatility scaling > entry cleverness.
Systems survive not by prediction, but by risk-controlled persistence .
This public view illustrates the foundations used in my more advanced risk-scaled quant strategies for NASDAQ and S&P indices.
#Quant #TrendFollowing #Breakout #Donchian #EMA #NASDAQ #SP500 #SystematicTrading #AlgorithmicTrading #Volatility
MPWR 1D: shoulders are squared and the battery's still fullMonolithic Power Systems broke out of a long-term descending trendline after completing a clean inverse head and shoulders. Now the price is pulling back into the 705–688 zone — a textbook retest area that combines the neckline, the 0.705–0.79 Fib levels, and a major volume shelf. Add to that a golden cross (EMA50 crossing EMA200 from below) and we have a solid technical foundation for continuation. Volume on the pullback is low, indicating no panic, just rotation. If 688 holds, the next levels to watch are 755.66 and 952.17 — the latter being the 1.618 Fib extension. Tactical setup: look for a reversal signal between 705–688, with a stop just below 661. As long as price holds this zone, the bullish structure remains intact.
Fundamentally, MPWR remains one of the strongest names in the semiconductor space. With over $1.5B in annual revenue and industry-leading margins, the company continues to see strong demand from data center and EV sectors. In its latest report, management highlighted accelerating orders from Tier‑1 manufacturers. The balance sheet is clean, with zero debt, and ongoing buybacks provide downside support. In a sector full of volatility, MPWR stands out with both structural reliability and technical clarity - making it a strong candidate for long-term positioning.
If this textbook pattern plays out, the train’s just leaving the station. The best seat is usually the one taken before the doors close.

KIOCL on the verge of 8 years BreakOut📊 KIOCL Ltd – 8-Year Breakout Summary
🔑 Price Action Overview
The stock is trading at ₹528.80 (+19.99%), hitting an upper circuit with strong momentum.
Price is on the verge of a multi-year breakout from the consolidation zone that lasted nearly 8 years (2017–2025).
Historically, every breakout in KIOCL has led to sharp parabolic moves (2017 rally, 2020 rally, 2024 rally).
📈 Key Resistance Levels
1. ₹540 – ₹560 zone → Immediate breakout resistance (current price testing this zone).
2. ₹620 – ₹650 → Next major resistance; earlier rejection zones in 2017 and 2024.
3. ₹750 – ₹800 → Medium-term resistance zone.
4. ₹900 – ₹1000 → Psychological & historical supply zone.
📉 Key Support Levels
1. ₹500 – ₹510 → Immediate support (previous resistance now acting as support).
2. ₹450 – ₹460 → Strong support, base of recent rally.
3. ₹400 – ₹410 → Long-term support, multiple touch points (2023–24).
4. ₹340 – ₹350 → Strong multi-year support zone; breakdown here invalidates bullish structure.
🔍 Volume & Strength
Volume has spiked sharply (11.5M vs avg 9.9M), confirming institutional buying interest.
Weekly chart breakout with highest volume in years indicates accumulation phase turning into expansion phase.
📊 Technical Indicators
Momentum: RSI likely entering overbought zone but still bullish (strengthening breakout).
Trend: Higher highs & higher lows visible since mid-2023.
Pattern: Cup & Handle / Long-term Rectangle breakout.
🚀 Upside Potential
Measured move targets (based on breakout projections):
First Target: ₹620 – ₹650 (20–25% upside)
Second Target: ₹750 – ₹800 (45–50% upside)
Final Target: ₹900 – ₹1000 (80–85% upside)
⚠️ Risks
Profit booking after sharp rallies.
If it fails to sustain above ₹500 support, trend may weaken.
PSU stocks can be volatile due to government policies.
✅ Summary in One Line:
KIOCL is on the verge of an 8-year breakout with strong volumes. Sustaining above ₹500–₹510 opens the gates for ₹620 → ₹750 → ₹900+ in the medium to long term, while downside is protected by ₹450 & ₹400 supports.

EURUSD Long: Awaiting Bullish Breakout from PennantHello, traders! The price auction for EURUSD has been in a corrective phase, which has taken the form of a large downward pennant. This bullish reversal pattern has been defined by a series of complex lower highs and lower lows, with the price consolidating between the descending supply line and the demand line near the 1.1715 demand level.
Currently, the auction is at a critical inflection point, trading at the apex of this pennant where the supply and demand lines converge. The price has found support near the 1.1715 demand zone, and after a complex series of moves, is now challenging the immediate overhead resistance. This compression of volatility indicates a significant breakout is imminent.
My scenario for the development of events is a bullish resolution of this downward pennant. I expect the price to make an impulsive move and break out above the descending supply line. In my opinion, this breakout will have enough momentum to carry the price up to the major horizontal supply zone. The take-profit is therefore set at the 1.1815 supply level. Manage your risk!

This is Bitcoin weekly. What do you see here?BITSTAMP:BTCUSD weekly is showing breakout from a base around 119500. Volumes are increasing but not good enough yet so a retest maybe. Or could this be a fake-out?
Only time will tell ...