EURJPY Potential BEARISH SetupEURJPY
Bearish Setup
Breakout Analysis:
Distribution pattern with breakdown below key support suggests downside acceleration/momentum.
Strategy Framework:
Since the forecast calls for more downside momentum we can anticipate a corrective move towards BOS. The zone between BOS and Resistance Zone give us our POI, where we should be looking for shorts to ride the downside wave towards our targets.
Technical Analysis:
- Breakdown Level:
- Entry Strategy: Looking for Shorts at confirmed BOS level
- Stop Loss: Above Resistance zone.
Target Zones:
- Primary Target: 1 (R:R 1:2)
- Secondary Target: 2 (R:R 1:3)
- Extension Target: 3 (R:R 1:4)
Bearish Confirmations:
🔻 Rejection candlestick patterns
🔻 Bearish Reversal patterns
🔻 Impulsive moves in line with setups directional bias
IDEA INVALIDATION:
- BULLISH momentum above Resistance Zone
Position Management:
- Exit: Partial profits at targets
- Stop adjustment: Trail below resistance
LIKE or COMMENT if this idea sparks your interest, or share your thoughts below!
FOLLOW to keep up with fresh ideas.
Tidypips: "Keep It Clean, Trade Mean!"
Breakout!

NZD/USD — Swing Zone Key Support & Resistance for a BreakoutNZD/USD — Swing Zone Key Support & Resistance for a Breakout or Reversion
It appears to show candlesticks (or candles) over a given timeframe — each candle representing price action over a set period (the timeframe isn’t specified in the snapshot). The chart provides a visual of highs, lows, opens, and closes for that period.
If there are any indicators or overlays (e.g. moving averages, support/resistance zones, trend‑lines), they are not clearly visible in the shared snapshot — so analysis must rely on raw price action (see below).
🧠 Price Action & Structure
From the visible segment of the chart:
Trend bias: The price history seems to show swings — there may have been a recent downward move followed by some consolidation or attempt to rebound. The pattern suggests possible correction or consolidation rather than a clean, strong uptrend or downtrend.
Support and resistance zones: Given the swings, there are likely to be key price levels (swing highs as resistance, swing lows as support). Traders often draw horizontal lines at these pivots to anticipate reactions.
Volatility and uncertainty: The visible swings suggest volatility — price is not moving in a straight line, which means participants should be cautious; the market might be swinging between support and resistance rather than trending.
If you were to trade or follow NZD/USD based on this chart:
Watch for breakouts above recent swing‑high (would signal bullish momentum) or breakdowns below swing‑low (possible bearish continuation).
Use support/resistance zones — since price seems to bounce between highs and lows, trading reversals or breakouts could be viable.
Avoid entering during consolidation or “chop” — when price action is indecisive, risk is higher; wait for clearer structure or confirmation. This echoes general chart–reading best practices.

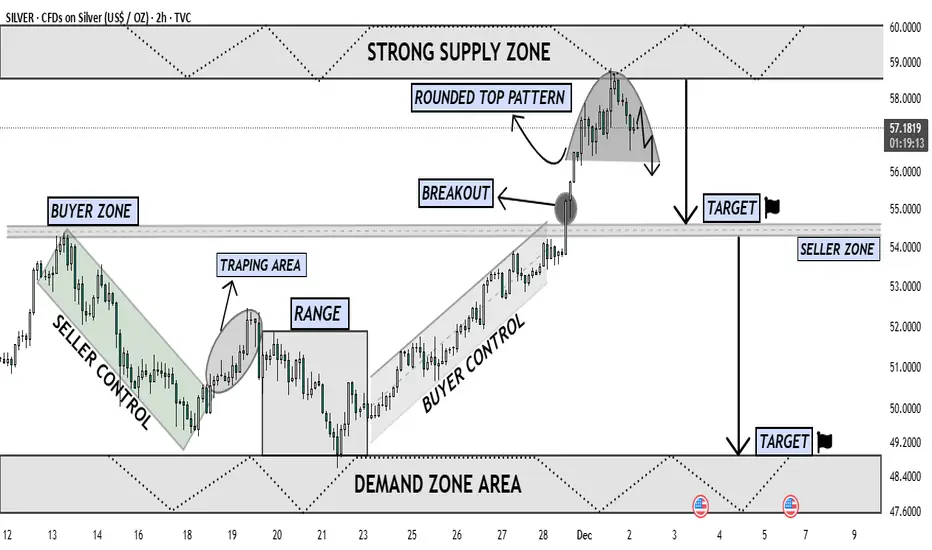
Silver Forming Major Top Near Supply Downside Retracement LikelyThe chart shows Silver reaching a major Strong Supply Zone near the 58–60 level, where price has reacted multiple times in the past. After a strong impulsive rally driven by Buyer Control, the market broke above the previous Buyer Zone, confirming bullish strength. However, once price entered the upper supply region, momentum started to fade, forming a clear Rounded Top Pattern — a classic distribution structure indicating exhaustion of buyers.
Following the breakout retest, buyers failed to continue upward, and sellers stepped in aggressively from the supply zone. The chart now shows a shift from buyer dominance to seller pressure, with price beginning to curve downward inside the rounded top. This shape reflects decreasing highs, weakening demand, and early reversal signals.
The projected move suggests that once the neckline of the rounded top breaks with strong bearish candle confirmation, price is likely to fall toward the first Target Zone around 54, which aligns with the Seller Zone and previous breakout structure. If bearish continuation remains strong, the next logical target lies in the Demand Zone Area between 48–49, where liquidity is expected to support a potential reversal or consolidation.
Overall, this chart indicates a high-probability corrective phase, with sellers preparing to reclaim control as the market rejects the supply zone and transitions into a deeper pullback phase. Buyers must show strong defense at the mid-support; otherwise, Silver could decline further toward the lower demand region.
ASIA: BO/MTime: 20:15 GMT
4H Setup: REV/IBM
4H Confluences: EMA13, RSI reversal break, Weekly Level
15m Setup: BO/M
15m Confluences: EMA13, EMA89, EMA Cross
Target: 2R Bread & Butter

ETHUSDT Major breakout and pump may happen soonA decisive breakout above the $3,100 level for Ethereum would represent a significant technical milestone, potentially heralding the beginning of a new bullish phase. Such a move, particularly if validated by sustained volume and a daily close above this key resistance, could initiate a strong upward impulse with an initial technical target near the $5,000 zone, aligning with measured move projections from the recent consolidation structure.
It is important to emphasize that a confirmed breakout of the prevailing channel resistance is a prerequisite for this bullish scenario to unfold. Based on current technical structure and momentum indicators, we assess the probability of such a breakout occurring in the near term at approximately 70%, though traders should await clear confirmation before positioning for extended upward movement.
DISCLAIMER: ((trade based on your own decision))
<<press like👍 if you enjoy💚

GBPUSD BEARISH BIAS|SHORT|
✅GBPUSD Price is breaking below the supply zone after taking out local internal liquidity, showing a clean shift in orderflow toward downside imbalance. With the breakout confirmed, price is likely to seek the inefficiency below and draw toward the target level.
SHORT🔥
✅Like and subscribe to never miss a new idea!✅

GBP-USD Bearish Breakout! Sell!
Hello,Traders!
GBPUSD has broken structure beneath the horizontal supply and is now trading below a key distribution zone. A bearish continuation is likely as liquidity from late buyers gets exposed, targeting the clean draw below current lows. Time Frame 3H.
Sell!
Comment and subscribe to help us grow!
Check out other forecasts below too!
Disclosure: I am part of Trade Nation's Influencer program and receive a monthly fee for using their TradingView charts in my analysis!

EURUSD Uptrend Intact: Price Approaches Major 1.1650 ResistanceHello traders! Here’s my technical outlook on EUR/USD based on the current market structure. After breaking out of the Buyer Zone near 1.1600–1.1610, the price pushed higher and re-entered the ascending channel, continuing to form higher highs and higher lows along the channel’s Support Line. Buyers managed to defend the zone after a fake breakout, confirming strong demand within this area. Currently, EUR/USD is approaching the 1.1650–1.1660 Resistance Level, where the previous rejection occurred. As the pair moves within the rising channel, bullish momentum remains intact, but the structure also suggests that the market may slow down as it nears this overhead resistance. As long as the price holds above the Buyer Zone and continues respecting the channel’s Support Line, the bullish scenario remains valid. A short pullback toward the channel’s midline is possible before buyers attempt another push upward. A continuation of this upward movement may drive EUR/USD toward the TP1 target at 1.1650–1.1660, aligning with the major Resistance Level. A clean breakout above this level would open the door for further bullish expansion. However, a breakdown below the Support Line or a return into the Buyer Zone could weaken the current bullish structure and expose the pair to deeper corrective movement. Please share this idea with your friends and click Boost 🚀

Gold Slows at Channel Top — Market Targets 4,150 Before Move UpHello traders! Here’s my technical outlook on XAU/USD based on the current market structure. After breaking out of the broader consolidation phase, gold continued to move within a rising channel, forming consistent higher highs and higher lows along the Support Line. Buyers maintained strong momentum as the price pushed toward the Resistance Line, which aligns with the major Resistance Level near 4,240. However, after reaching this upper boundary, the market showed clear signs of exhaustion, indicating that buyers are struggling to push further into the resistance zone. This reaction suggests that the price may soon initiate a corrective move. At the moment, XAU/USD is trading inside a narrowing rising structure, with the Support and Resistance Lines converging, creating compression. As long as the price holds above the local Support Level around 4,150, the bullish structure remains intact. A pullback from the Resistance Line toward this area is the most likely short-term scenario before buyers attempt another push. This zone aligns with the first target TP1, which also acts as a key reaction zone from previous price behavior. A successful rebound from support could allow bulls to regain strength and attempt another test of the 4,240 resistance. If a breakout occurs, it would open the door for further bullish continuation. However, if the price fails to hold the Support Line or breaks back below the 4,150 zone, the structure may shift to a deeper correction, exposing gold to lower support areas. Please share this idea with your friends and click Boost 🚀

EURUSD Pullback Before Bullish ExpansionQuick Summary
EURUSD is still showing strong bullish momentum, but a short term correction toward 1.15903 is likely before price continues higher to break the previous high. The presence of liquidity and an order block at the retracement zone increases the probability of a sweep before a new bullish push begins.
Full Analysis
The EURUSD continues to maintain its upward structure, and the current price action suggests that a temporary pullback may occur before the next bullish expansion. The level around 1.15903 stands out as a logical correction point
This retracement zone is significant because it contains both resting liquidity and a strong order block. These factors often attract price, as the market tends to sweep liquidity before continuing its primary direction. A sweep in this zone would remove weak hands, fill inefficiencies, and position the pair for a stronger continuation move.
Once liquidity below 1.15903 is taken, the expectation is for EURUSD to resume its bullish trajectory and aim for a break above the previous high. Waiting for a reaction or confirmation at the level can provide a higher quality entry, but the overall bias remains bullish as long as the structure stays intact.

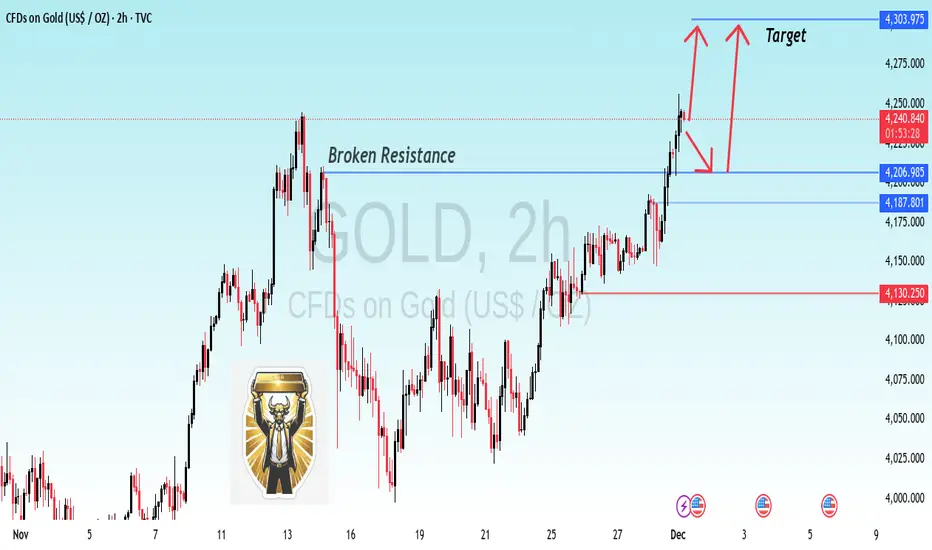
GOLD Breakout Confirmation Bulls trakin ControlUPDATE: Previous GOLD Idea Hit 100% Exactly as Expected! | JT_CHARTsMaster
The last analysis played out perfectly — GOLD followed the exact structure, respected the levels, and completed the move with full accuracy.
Thank you to everyone who supported the previous idea!
---
📌 Current Analysis (2H Timeframe)
Gold has broken the key resistance zone, and price is now retesting the breakout area.
After this clean retest, the market is showing signs of bullish continuation.
Key Points:
✔ Previous resistance now acting as support
✔ Break–retest–continuation structure is active
✔ Market is holding above the breakout zone
✔ Bullish momentum is building toward the next targets
---
📈 Expected Move
As long as gold stays above the breakout level, the probability of a move toward the next targets remains strong.
I’ve highlighted the expected upward move on the chart with arrows for clarity.
---
🙏 Thanks for Your Support
Your boosts, comments, and likes motivate me to share more accurate analyses like this.
👉 If you found this helpful, please Boost the idea and leave a comment — it really helps!
— JT_CHARTsMaster
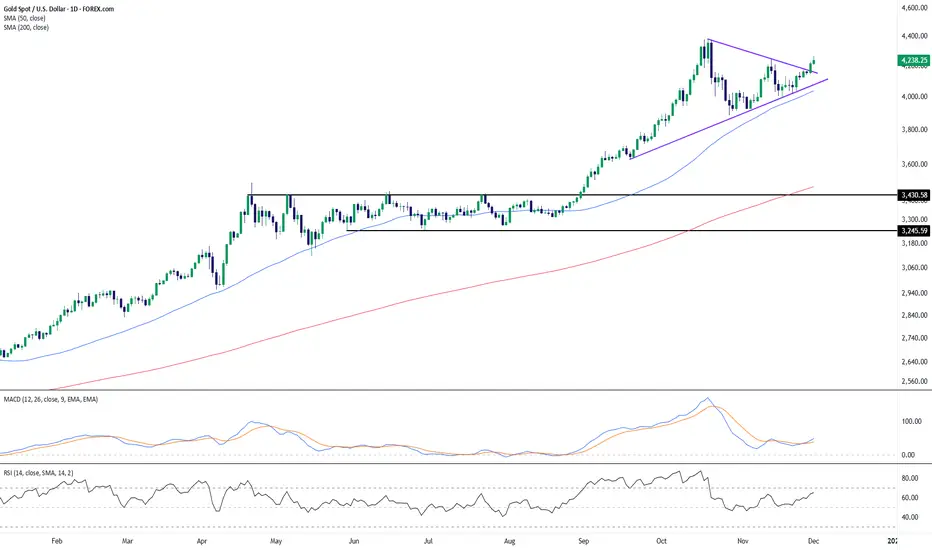
Gold Breaks Out of Triangle Structure as Trend Strength Remains Gold has pushed through the upper boundary of a contracting triangle formation, marking a continuation of the broader uptrend that has been intact since early in the year. The breakout follows several weeks of compression, with progressively higher lows aligning along a rising trendline, while buyers repeatedly tested the upper diagonal boundary.
The moving averages reinforce the constructive bias: price continues to trade well above both the 50-day SMA and the 200-day SMA, with the 50-day maintaining a strong upward slope. This places the current move firmly within a longer-term bullish structure, and the recent expansion in distance from the 50-day SMA highlights renewed upward momentum following the consolidation phase.
Momentum indicators are also showing early signs of improvement. The MACD lines have begun curling higher after a period of easing, suggesting that downside momentum has faded. RSI has climbed back into the mid-60s, reflecting strengthening buying interest without yet indicating overstretched conditions.
Overall, the breakout from the triangle aligns with the prevailing uptrend and indicates a return of bullish pressure. As always, how price behaves on any retest of the breakout area—or near the rising trendline—may provide additional insight into the durability of this momentum shift.
-MW
Welcome to BEAR SEASONAs the timeline clearly indicates, we've entered bear season. Good luck to everyone. I've opened my Short, lit a cigarette, and sipped my cappuccino, watching with pleasure as the stoves go out.

EURUSD Long: Channel Support Intact, Path Open Toward 1.1625Hello, traders! EURUSD is trading within a developing ascending channel, where price action continues to respect both the higher lows and the upper boundary of the structure. This upward movement formed after buyers defended the Demand Zone around 1.1550, which acted as a strong pivot area and triggered a bullish reversal via a clear inverse Head and Shoulders pattern. This pattern gave buyers the momentum needed to break back above the mid-range structure.
Currently, after reclaiming this level, EURUSD made a steady climb inside the ascending channel. However, price is now approaching the 1.16250 Supply Zone, which has previously acted as a strong reaction area where multiple breakouts and fake breakouts occurred. This remains the key short-term barrier that buyers need to overcome for further upward continuation.
My scenario: if buyers maintain structure above the Demand Zone at 1.15900 and hold the ascending channel’s support, EURUSD may continue pushing toward the 1.16250 level. This zone, aligned with the channel’s upper boundary, is the main target for the current bullish leg. A clean breakout above this resistance could open the door for a stronger bullish extension. However, if price reaches the Supply Zone and shows weakness or rejection, a corrective pullback toward the channel’s lower boundary is possible while still preserving the bullish structure. As long as EURUSD holds above the Demand Zone and respects the channel, the bullish scenario remains valid. Manage your risk!

XAUUSD Short: Rejection Pattern Points Toward 4,110 SupportHello, traders! XAUUSD continues to move within a broader ascending channel, where the price is forming higher pivot points along the Demand Line while consistently reacting to the descending Supply Line above. This structure indicates ongoing compression between buyers and sellers. Recently, Gold approached the upper Supply Line, where the price once again failed to break through, forming another lower high. This confirms that sellers are still defending the supply zone around $4,190–$4,200, keeping upward momentum limited. Before that, the price made several breakout attempts above the mid-range resistance, but many of them turned into fake breakouts, indicating liquidity grabs. Each rejection pushed Gold back toward the Demand Line, where buyers repeatedly created strong pivot points and revived the bullish momentum.
Currently, XAUUSD is trading close to the resistance area, and the chart suggests a potential pullback. If sellers maintain their pressure, the price may decline toward the $4,110 demand level, which aligns with both historical support and the upward Demand Line.
My scenario, if the price respects the Supply Line and fails to break higher, a bearish correction toward the $4,110 support zone becomes likely. However, if buyers manage to break above the descending Supply Line with strong momentum, the bearish idea becomes invalid, and Gold may continue its bullish expansion. Manage your risk!

Walmart Stays Strong, Ready for the Next LeapWalmart is proving once again why it remains one of the strongest companies in the world. Even as many retailers struggle, Walmart continues to grow, innovate, and win the confidence of investors.
Its stock is already up 22% this year, beating the S&P 500, and many signs show that the company could stay strong in 2026 as well.
◉ Why Walmart Is Winning
Walmart has become a perfect mix of traditional retail and modern technology.
Strong results:
● Revenue up 5.8% year over year
● Operating income up 8%
● EPS rising from $0.58 to $0.62
Market share growth:
Walmart gained more customers in grocery and general merchandise. Even higher-income shoppers have been spending more at Walmart.
E-commerce strength:
Online sales grew 27% as Walmart expands its online offerings and reaches customers beyond its stores.
Growing advertising business:
Walmart’s ad sales increased 53% in the latest quarter, turning it into a serious player in retail advertising.
◉ Technology Is Shaping Walmart’s Future
Walmart is investing heavily in technology to stay ahead:
● Partnering with OpenAI to let customers use ChatGPT for shopping and checkout
● Training developers to code faster with AI
● Automating supply chains and warehouses
● Buying Vizio to strengthen its advertising ecosystem
These changes are helping Walmart protect its low-price model while moving closer to becoming a tech-driven retailer.
◉ Leadership and Listing Changes
Two important updates were recently announced:
● CEO Doug McMillon is stepping down after ten years
● John Furner, head of Walmart U.S., will become the new CEO
Walmart also announced that it will move its stock listing from the New York Stock Exchange to the Nasdaq. This connects Walmart more closely with tech-focused indexes and funds.
◉ Dividend Stability
Walmart is a Dividend King, raising its dividend every year for more than 50 years. This adds strong stability for long-term investors.
◉ Technical Outlook
● From a technical point of view, the stock recently broke out of an ascending triangle pattern and touched a new all-time high.
● If this momentum continues, Walmart could see another strong rally in 2026.
◉ Final Thoughts
Walmart is winning today and building an even stronger position for the future. With solid financials, strong e-commerce growth, expanding advertising revenue, and steady leadership changes, the company is well-placed for 2026 and beyond.

BTCUSD: Channel Momentum Points Toward $93,700 TargetHello everyone, here is my breakdown of the current Bitcoin setup.
Market Analysis
BTCUSD has shifted from a prolonged bearish phase into a clear bullish recovery after breaking out of the major downward channel. The price confirmed the end of the bearish structure once it broke above the descending trendline and reclaimed the Support Zone around $89,800–$90,200, which previously acted as a strong demand area during the selloff. After the breakout, Bitcoin established a new upward channel, forming higher highs and higher lows, indicating that buyers are currently in control. The price is now moving steadily along the channel's Support Line, respecting its structure and maintaining bullish momentum. Recent price action also includes several breakout confirmations, showing that buyers successfully defended the Support Zone and turned it into a base for further growth.
Currently, BTCUSD is approaching the $93,000–$93,700 Resistance Zone, which remains the main obstacle for buyers. This level acted as strong resistance earlier and aligns with the mid-upper region of the ascending channel, making it a key reaction area where sellers may attempt to slow down the bullish trend.
My Scenario & Strategy
My scenario remains bullish as long as Bitcoin stays above the $90,200 support zone and continues to trade within the upward channel. The structure suggests that buyers may attempt another push toward the $93,700 resistance, where the next major reaction is expected.
Therefore, a clean breakout above $93,700 would confirm further bullish continuation and open the path toward higher targets, potentially extending the uptrend to the upper channel boundary. However, if BTC reaches the resistance and shows signs of rejection or weakening momentum, we may see a pullback toward the channel’s Support Line — yet the broader bullish structure will remain valid as long as the zone around $90,200 holds. For now, the market supports a long bias, with the primary objective being a retest of the $93,700 resistance zone, which stands as the key level buyers are aiming for.
That’s the setup I’m tracking. Thank you for your attention, and always manage your risk.

EURUSD: Sellers Target Move Toward 1.15200 SupportHello everyone, here is my breakdown of the current EURUSD setup.
Market Analysis
EURUSD continues to trade within a corrective market structure after a strong bullish impulse that formed an Upward Channel earlier in the month. Once price broke below that channel, the pair shifted into a broader consolidation, forming a descending Triangle pattern defined by a Triangle Resistance Line above and a Triangle Support Line below. After dropping from the 1.16000 Resistance Zone, the market produced a clear fake breakout above this level, signaling strong seller presence. This rejection aligned with the Triangle Resistance Line, confirming it as a firm boundary preventing further upside. On the downside, EURUSD also created a fake breakout at the Triangle Support Line, showing that buyers remain active around the 1.15200 Support Zone.
Currently, price is trading in the middle of this triangle structure, moving away from resistance and showing early signs of bearish momentum building toward the lower boundary. The broader picture reflects a balanced but weakening market, where sellers still hold the advantage as long as price remains under the 1.16000 Resistance.
My Scenario & Strategy
My scenario is bearish, based on the repeated rejections from the 1.16000 Resistance and the overall pressure along the Triangle Resistance Line. As long as EURUSD stays below this key zone, the probability favors further downside movement inside the triangle. My expectation is for price to make another minor pullback toward the 1.15850–1.15900 area, where short-term liquidity may form, before resuming the decline toward the 1.15200 Support Zone. This level aligns with the Triangle Support Line and represents the main downside target for the current move.
Therefore, a clean breakout below 1.15200 would signal stronger bearish continuation and open the path for deeper declines. However, if price rejects the support again and forms higher lows, we may see another corrective bounce back into the triangle — but the bearish bias holds as long as the 1.16000 Resistance remains intact. For now, the market supports a short scenario with a focus on a move toward the 1.15200 support area.
That's the setup I'm tracking. Thank you for your attention, and always manage your risk.

BTC Buyers Hold Control — Targeting $95,700 Resistance RetestHello traders! Here’s my technical outlook on BTC/USD based on the current market structure. After breaking out of the Buyer Zone near $86,400–$88,000, the price entered a sustained upward channel, forming higher highs and higher lows along the Support Line. However, BTC recently approached the Resistance Line inside the channel and showed signs of exhaustion, indicating that buyers are losing momentum as the price nears the local Seller Zone around $94,000–$95,700. The chart currently shows the market trading within a rising corrective structure, with bulls trying to hold the Support Line to maintain the short-term uptrend. As long as the price stays above the Buyer Zone and respects the channel’s Support Line, the bullish scenario remains valid. The structure suggests a potential pullback from Resistance toward the mid-channel area before buyers attempt another move upward. A continuation of this trend may push BTC/USD toward the TP1 target at $95,700, where the previous rejection occurred. A clean breakout above this level would open the door for stronger bullish expansion. However, a breakdown below the Support Line or a drop back into the Buyer Zone could weaken the trend and expose the price to deeper declines. Please share this idea with your friends and click Boost 🚀

EURUSD Retracement Before Bullish ContinuationQuick Summary
Although the overall outlook remains bullish, the EURUSD may go down first to collect liquidity below the Tokyo Low. This zone aligns with equal lows and a clean order block after, making 1.15855 a strong area for a continuation buy if a clear rejection or choch forms.
Full Analysis
The bullish structure on the EURUSD is still intact, but before continuing upward, the pair may need to sweep the liquidity sitting beneath the Tokyo Low, The area below the Tokyo Low also aligns with equal lows, which naturally attract liquidity and making this zone even more likely to be tested
The level around 1.15855 stands out as a probable point for bullish continuation once liquidity has been taken. However, entering directly at the level is not ideal. It is safer and more effective to wait for a clear sign of reaction such as a strong rejection or a confirmed choch on a lower timeframe. These signals help validate that the market is ready to shift from sweep to expansion upward.

USD/JPY — Poised for Bullish Reversal at Key Demand ZoneUSD/JPY is currently testing a major demand zone, a level where price has historically found strong buying interest. This area has acted as a structural support multiple times, making it a high-probability zone for a bullish reversal.
The recent price action shows slowing downside momentum, with smaller candles and wicks rejecting lower levels — signaling that buyers are stepping in. If the market holds this zone, we could see:
A bullish engulfing candle or pin-bar formation confirming rejection.
A strong upward impulsive move targeting previous swing highs.
Increased buying momentum as traders enter at a low-risk point.
For traders looking to go long, this setup allows for strategic entry near the support zone, with a stop-loss just below the demand area to manage risk. The upside potential aligns with prior highs, making it an attractive risk-to-reward opportunity.
Key Point: Wait for confirmation via a bullish candlestick pattern or a retest of the zone before entering to maximize probability of success.

RANGE BREAKOUT WITH RETEST & DOWNSIDE CONTINUATION SETUPRANGE BREAKOUT WITH RETEST & DOWNSIDE CONTINUATION SETUP
The EUR/GBP chart displays a well-defined market structure transition from accumulation ranges into a broader bearish cycle. Initially, the price moved through multiple tight ranges, indicating accumulation and liquidity building on both sides. Each breakout from these ranges created short-term bullish impulses, but the upward momentum consistently weakened as price approached the strong supply zone.
Once price tapped the major supply zone, selling pressure increased sharply, marking the start of a clean descending channel (seller zone). This channel represents controlled distribution by sellers, which pushed the market back below the previous mid-range support.
The most important structural event is the bearish breakout from the central range support. After the breakout, price returned for a textbook retest, where previous support flipped into resistance — a classic confirmation of bearish continuation.
The market is now positioned between key liquidity levels, and unless the retest zone is reclaimed, probability favors a continuation move towards the next support level. If this level breaks, further decline toward the lower support base becomes the next logical target.
Overall sentiment remains bearish, with sellers controlling the flow, and any long positions remain risky unless the market reclaims the broken support area and breaks structure to the upside.

AUDUSD STRONG BREAKOUT|LONG|
✅ AUDUSD is breaking structure as it trades out of the demand block, signalling a continuation toward the upside liquidity pocket. With momentum shifting, the pair aims to draw toward the next clean inefficiency above before reaction. Time Frame 4H.
LONG🚀
✅Like and subscribe to never miss a new idea!✅
