BITCOIN (BTC/USD): Can 100K Support Hold - A Pullback in SightBitcoin may experience a rebound from a significant daily historical support level.
Following its test, the price formed a double bottom pattern on an hourly timeframe and has successfully broken above its neckline.
I anticipate a bullish movement towards 104,000.
Breakout-pullback

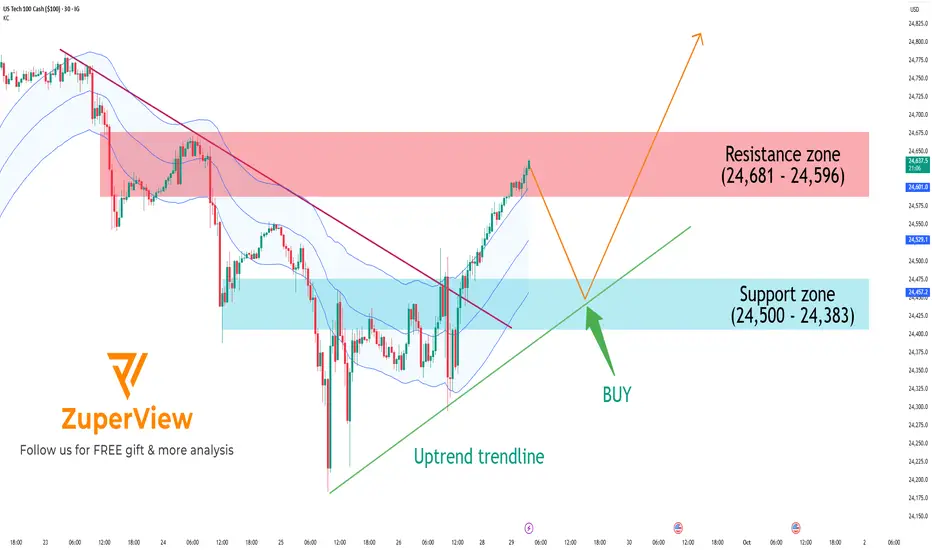
US100: Approaching resistance, pullback likely before breakoutThe IG:NASDAQ has shown a strong short-term recovery after breaking a major descending trendline. However, price is now testing a significant resistance zone, and a technical pullback is likely before the uptrend can continue.
📊 Technical Analysis: 30-minute Chart
📉 1. Overall Trend
Price has successfully broken above a descending trendline (red line), shifting market structure from bearish to bullish.
An uptrend line (green) is now acting as dynamic support.
Price is trading near the upper band of the Keltner Channel, indicating sustained bullish momentum.
🟥 2. Resistance Zone: 24,596 – 24,681
This zone has acted as a strong supply area in the past, causing multiple rejections.
Price is currently testing this area again → a rejection or short-term pullback is highly probable.
🟦 3. Support Zone: 24,383 – 24,500
This zone overlaps with previous consolidation and aligns with the uptrend line.
If a pullback occurs, this area could attract buyers and act as a launchpad for the next leg up.
🔁 Potential Trade Setups
✳️ Primary Scenario (preferred):
Price rejects at resistance → pulls back to support → bounces and resumes the uptrend
Wait for a pullback toward 24,500 – 24,383
Look for bullish price action (e.g., bullish engulfing, hammer) for entry
Enter long if support holds:
🎯 TP1: 24,650
🎯 TP2: 24,700+
🛑 SL: Below 24,350 (trendline invalidation)
🔻 Alternative Scenario (risk):
If price breaks below 24,383 and the uptrend line fails → short-term trend could shift sideways or bearish
Avoid long entries without a confirmed recovery
Re-evaluate trend structure if support fails
✅ Conclusion
A short-term uptrend is in place
However, price is now testing a major resistance zone, and a healthy pullback is likely
Please like and comment below to support our traders. Your reactions will motivate us to do more analysis in the future 🙏✨
SBUX | What's Next?SBUX has been on a tear lately. The screenshot I am including explains all of this as well; however, SBUX has seen a decline in value since being bouncing between the tight Support and Resistance levels. With all confluences taking into consideration - news, patterns, price action, and whatever else you can think of to make a case for a breakout beyond resistance or a reversal would be great towards helping me learn more!
Appreciate your time!
NASDAQ:SBUX

JKCEMENT : Strong Bullish Momentum with Possible BreakoutJK Cement Ltd. (NSE: JKCEMENT) has recently demonstrated strong bullish momentum, marked by significant price movements and key technical indicators that point towards a potential breakout. Investors and traders are closely watching this stock for further upward movement, making it an attractive candidate for a swing trade.
Key Highlights:
Possible Breakout
The recent price action in JK Cement Ltd. suggests a possible breakout from a previous resistance zone. The stock has surged past the ₹4894.23 resistance level, indicating strong buying interest and the potential for continued upward movement. This breakout is a bullish signal that could pave the way for higher price targets.
Strong Bullish Candle
In the latest trading session, JK Cement Ltd. formed a strong bullish candle, closing with a substantial gain of ₹150.60 (+3.25%). This candle not only signifies significant buying pressure but also breaks above key resistance levels, reinforcing the bullish sentiment. The strength of this bullish candle is a clear indicator of strong upward momentum.
RSI Breakout
While the RSI (Relative Strength Index) is not explicitly shown in the chart, the overall price movement suggests a possible RSI breakout. An RSI breakout above the 70 level typically indicates overbought conditions, reflecting strong bullish momentum. Such a breakout often attracts additional buyers, pushing the stock price higher.
Possible Swing Trade
Given the current technical setup, JK Cement Ltd. presents a compelling opportunity for a swing trade. The combination of a possible breakout, a strong bullish candle, and a potential RSI breakout indicates a high probability of continued upward movement. Swing traders can consider entering a long position, targeting the next resistance levels at ₹4999.42 and ₹5157.63. It is also prudent to set a stop-loss below the recent support level at ₹4630.83 to manage risk.
Additional Chart Patterns and Readings
Double Bottom Pattern
Upon further analysis, the chart reveals a potential double bottom pattern formed around the 13th of January. This pattern is a bullish reversal signal, indicating that the downtrend may have ended and a new uptrend could be starting. The breakout above the resistance zone further confirms this bullish reversal, adding to the positive outlook for JK Cement Ltd.
Volume Analysis
The volume bars at the bottom of the chart highlight a significant increase in trading volume on the most recent day. This 5-day volume breakout, where the volume is significantly higher than the average over the past five days, adds credibility to the price movement. The 5X volume breakout indicates strong participation from traders and investors, further validating the bullish sentiment.
Conclusion
JK Cement Ltd. is exhibiting strong bullish signals, with key technical indicators pointing towards a potential breakout and continued upward movement. The strong bullish candle, possible RSI breakout, and significant volume increase make it an attractive candidate for a swing trade. Traders should monitor the stock closely and consider entering a long position while managing risk with appropriate stop-loss levels.
With the current market setup, JK Cement Ltd. is poised for further gains, making it a stock to watch in the coming days. 📈🚀

ZENSARTECH): Strong Bullish MomentumZensar Technologies Ltd. (NSE: ZENSARTECH) has recently demonstrated remarkable bullish momentum, breaking through key resistance levels and achieving a 52-week high. The stock price surged to ₹836.90, marking an impressive 11.58% increase in a single trading session. This breakout is particularly noteworthy as it is accompanied by a substantial spike in trading volume, indicating strong investor interest and confidence in the stock.
Key Highlights:
52-Week Breakout: The stock has achieved a 52-week breakout, surpassing the highest price level observed in the past year. This breakout is a positive signal for investors, suggesting potential for further price appreciation.
RSI Breakout: The significant price movement and volume spike suggest that the RSI (Relative Strength Index) has broken out of a previous range, indicating overbought conditions and strong bullish sentiment. Although the RSI is not explicitly shown in the chart, the overall market behavior supports this inference.
52-Week Volume Breakout: The volume data reveals a substantial increase on the most recent trading day, indicating a 52-week volume breakout. This surge in volume supports the bullish price action and suggests strong investor interest.
20-Day Volume Breakout: The recent volume spike also represents a 20-day volume breakout, as the trading volume on the most recent day is significantly higher than the average volume over the past 20 days.
20X Volume Breakout and Price Change: The chart shows a 20X volume breakout, with the most recent trading day's volume being 20 times higher than the average volume. This massive increase in volume is accompanied by a significant price change, underscoring the strong buying interest and bullish sentiment surrounding Zensar Technologies Ltd.
Technical Analysis Insights:
The chart shows strong bullish momentum as the stock price has broken above the previous resistance level of approximately ₹800. This breakout, accompanied by a significant increase in trading volume, indicates strong buying interest and confidence among investors.
The volume data at the bottom of the chart highlights a substantial increase on the most recent trading day, reaching 28.28 million shares. This volume spike is not only the highest in the past year but also represents a 20-day volume breakout, with the trading volume being significantly higher than the average over the past 20 days.
Conclusion:
Overall, Zensar Technologies Ltd. is exhibiting strong bullish momentum, with key technical indicators pointing towards further potential gains. Investors should closely monitor the stock for continued strength and potential opportunities for profit. The recent breakout above key resistance levels, combined with substantial volume increases, suggests that the stock could experience further price appreciation in the coming days.
For those interested in the stock market analysis and investment strategies, Zensar Technologies Ltd. presents an exciting opportunity to capitalize on the current bullish trend. Keep an eye on this stock as it continues to make waves in the market. 📈🚀

GBPUSD - NEW BREAKOUT 🚀
As We Talked in The Previous Analysis:
The Resistance Level (1.27428 - 1.28280) is Broken.
Currently The Price Retreated To Support Line and Failed To Break it.
The Resistance Line is Broken !
So, I Expect a Bullish Move 📈
----------
TARGET: 1.28520🎯


4-Hour View on Crude OIL FuturesHello enveryone,
We have identified a strong long signal on the 4-hour chart for Crude Oil futures.
This trade falls under the category of a swing trade, with dual targets: the first at $80 and the second at $82, expected within the next few days.
IBROURI ABDESSAMAD

🟢Bloktopia BREAKOUT🟢The price is at the bottom of a one-year channel, and it has also broken its 8-month trendline. After a pullback, expect a 50% pump.
Set your stop just below the demand zone.

GOLD Strong Bearish Breakout! Sell!
Hello,Traders!
GOLD is now making
A pullback to retest
The broken key horizontal
Level of 1942 which is
Now a resistance so
As we are bearish biased
A further move down
Is to be expected
After the retest
Sell!
Like, comment and subscribe to help us grow!
Check out other forecasts below too!

NZDJPY - NEW BREAKOUT📈Hey Traders👋🏻
On The Weekly Time Frame The NZDJPY Price Reached a Resistance Level (86.566 - 88.170)✔
Currently, This Key Level is Broken (Resistance Level Becomes new Support Level)🔥
So, I Expect a Bullish Move📈
i'm waiting for a retest...
-----------
TARGET: 90.289🎯
___________
if you agreed with this IDEA, please leave a LIKE, SUBSCRIBE or COMMENT!

USD/JPY Long -Enthusiasm leading up to the Pattern Break Pullback
-Proportionate Small Pattern Leading to the Break
-Projected target reasonable given the size of the overall pattern
-Weekly supporting evidence

SLB is breaking out of a head and shoulders patternIn this chart I point to main chart pattern in the SLB prices at this moment, that is the head and shoulders. Not only that, but the prices are doing a breakout of this pattern, that I indicate step-by-step at the purple text in the chart.
I am also trying to take some advantage of this movement, and so I bought a very short term put option to try catch some profit from an eventual falling in prices. The put information is in the gray text in the chart.

Important levels on EURUSD We’re looking at selling opportunities on EURUSD.
The levels we’re expecting a reaction from, are 1,0836-46
Upon reaching these levels and pullback, we will look for the selling opportunities with SL above 1,0930 or aggressive one above retracement.
The target is a breakout of 1,0710 and confirmation of the downside move on H1.
Reduce the risk upon a test of the previous low.

Important levels on EURUSD EURUSD is heading towards 61,8 after yesterday’s announcement.
These are important levels, that we will watch for a possible pullback.
No grounds for entry ATM and we’re waiting a reaction.
Upon entry, the goal is a breakout of 1,0515 and continuation of the downside move.

EURCHF - IMPORTANT BREAKOUT !The EURCHF price breaks the daily Support level and support line ,the old support level becomes new resistance level ✔🧐
so, i predict a bearish move 📉
TARGET: 0.97429🎯
...
if you agreed with this IDEA, please leave a LIKE, FOLLOW or COMMENT!

Gold Week 4 Ends with a...New higher highs, or higher low retesting previous breakout key levels? We'll see

AUDUSD Watch: Key Level Break and Lower Low, Wait for a PullbackCheck out my previous post "Breaking Down The FX Market: What You Need To Know" for a comprehensive video analysis.
The AUDUSD has been in a bit of a tricky situation lately, as price has broken a key level and made a lower low. This has traders wondering where the pair may be headed next. However, before jumping in, it's important to wait for a pullback and not chase price. With the upcoming Federal Reserve rate decision, it's important to keep a close eye on the market and be cautious in your trades. The FED is expected to raise interest rates, which could have a significant impact on the currency markets. This means that traders should be paying close attention to the market developments and be prepared for any potential volatility. By being patient and waiting for a pullback, traders can better position themselves for success in the AUDUSD market.

CADCHF - BULLISH MOVE 🚀The CADCHF price is in Daily Support Level 🧐
The Key Level and Resistance Line are broken 🔥
so, i predict a bullish move 📈
TARGET: 0.69272🎯
...
if you agreed with this IDEA, please leave a LIKE, FOLLOW or COMMENT!

oh the places its gonefinally we see a daily bull move out of bitcoin, and the moment it appears to be reaching escape velocity a wild pullback appears. theres a chance this leads to consolidation towards signal (.5 of bounce/top of consolidative area lows weekly), but if we hold this pivot im looking near weekly highs (bottom of last monthly bounce). even if we trend back down toward equillibrium im still buying long term.

Eur/Aud Long break out pull backFor trading view
Setup: Break out pull back
Trade rating: 3.5
Reward: risk: 2.65
Market conditions: slow holday season
Euro has been one of the best performing currencies and the Aussie has been consistently quite weak
lets see if our limit order is filled

HIENS3 just starting?Waiting for possible pull-back entry on 15min tf. If this is just the first leg, could be the nice winner. SRSI could use some cool-off time.
Set alerts
Good luck traders

Audchf Breakout pull back
Setup: Breakout pullback
Trade rating:4.5\5
Reward: risk: 7:1
Market conditions: choppy
this is a great entry for an awesome risk to reward.
concerns are the tight stop and the market condition is not ripe for strong moves but we have some resistance above and it looks promising
