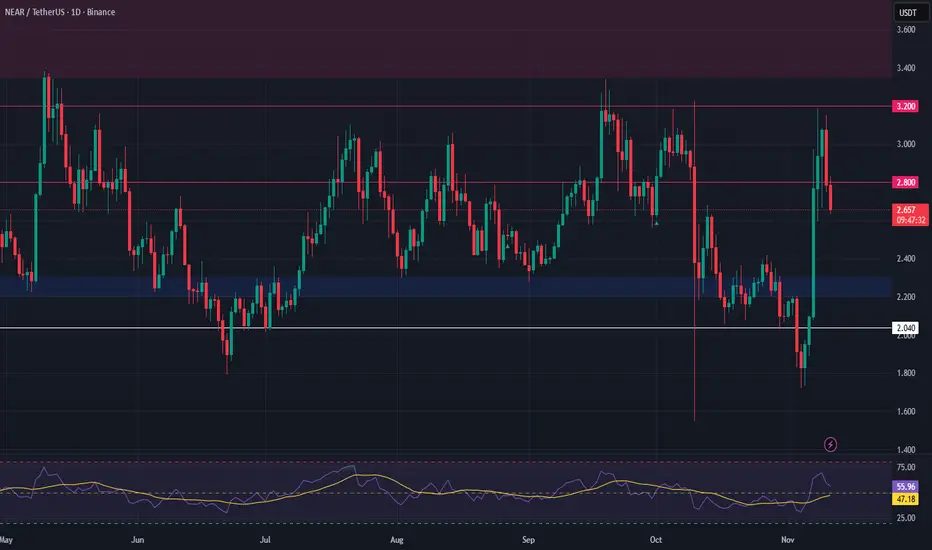
NEAR Protocol – AI Sector Strength & Breakout SetupStrength is rotating back into the AI and Web3 sectors, and NEAR is starting to show leadership. We’ve seen a clean breakout above consolidation, with volume confirming bullish intent. This could mark the beginning of a new leg up if the structure holds.
💡 Trade Idea
Entry Zone: $2.20 – $2.30 (support retest)
Take Profit Targets: $2.80 / $3.20
Stop Loss: $2.04
A pullback into the highlighted zone offers a high-probability entry, as prior resistance flips to support. The setup provides a solid R/R ratio for momentum continuation.
📊 Technical Outlook
Breakout confirmed with volume
Retest in progress or upcoming
Momentum shifting into AI narratives across crypto and equities
Watch closely for confirmation on the retest. As always, manage risk carefully.
🔔 Set alerts around the support zone for potential entry timing.
Breakout-trading
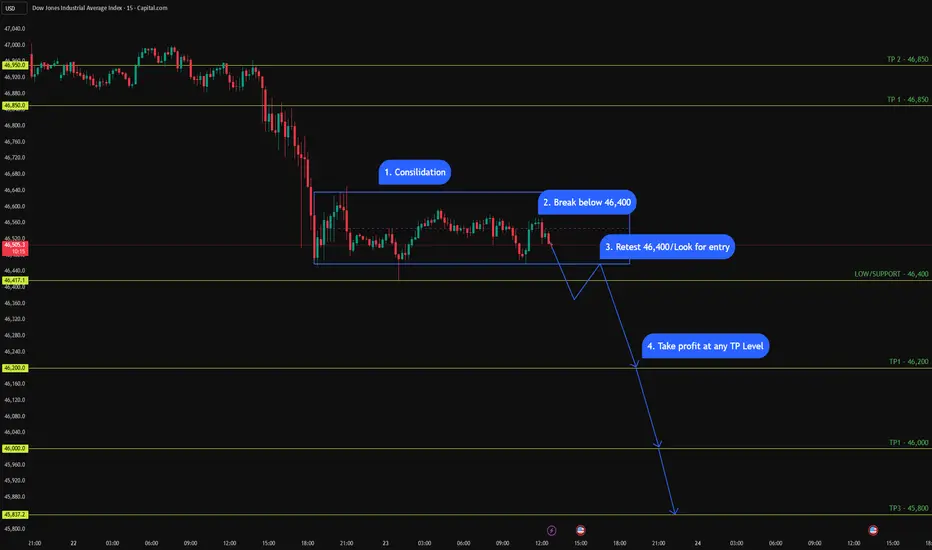
US30 (15M - 1M Daily Setup) - Bearish Bias US30 (15M - 1M Daily Setup) - Bearish Bias 📉
Price is consolidating under key resistance, forming lower highs. I’m watching 46,400 as the make-or-break level.
✅ Plan:
1️⃣ Consolidation phase complete
2️⃣ Looking for a clean break below 46,400
3️⃣ Retest → possible short entry
4️⃣ Target zones:
• TP1 → 46,200
• TP2 → 46,000
• TP3 → 45,800
📍 Bias stays bearish as long as price remains below 46,850 – 47,000.
Let’s see if the breakdown plays out. 👀
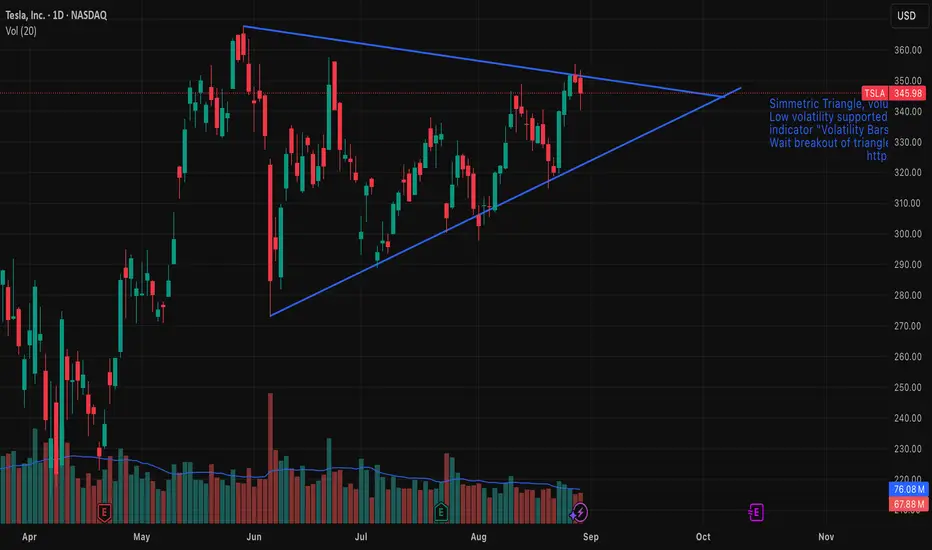
Tesla (TSLA) — Symmetrical Triangle Breakout IdeaSummary
Pattern: Symmetrical triangle on daily chart.
Expected timeframe for breakout: Within 1–2 weeks.
Targets: $367 on an upside breakout; $273 on a downside breakout.
Risk management: Use a stop-loss just outside the triangle after breakout confirmation; position size per your risk rules.
Setup & Rationale
A well-defined symmetrical triangle has formed on TSLA’s price action, characterized by converging trendlines connecting lower highs and higher lows. Volume has contracted inside the pattern, consistent with consolidation. Symmetrical triangles are neutral continuation/reversal patterns; the breakout direction provides the trading signal.
Key technical points:
Price is approaching the apex, increasing the likelihood of a decisive breakout in the next 1–2 weeks.
Volume decline during the consolidation and a volume spike on breakout would confirm conviction.
The breakout should be taken after a daily close beyond the upper or lower trendline (or after a retest), not merely intraday probes.
Entry Criteria
Upside trade: Enter long on a daily close above the upper trendline (or on a confirmed retest).
Downside trade: Enter short on a daily close below the lower trendline (or on a confirmed retest).
Targets & Measurement
Measure the pattern height (vertical distance between the initial high and low of the triangle) and project it from the breakout point.
Upside target (projected): $367.
Downside target (projected): $273.
Adjust targets proportionally if you use a measured move from the actual breakout point rather than the pattern’s maximum height.
Stops & Risk Management
Place stop-loss slightly outside the opposite trendline or beyond a recent swing point to avoid false breakouts.
Preferred approach: fixed-risk percent per trade (e.g., 1–2% of portfolio) and scale position size accordingly.
Consider tightening stops to breakeven after price clears ~50% of the distance to the target.
Confirmation: daily close beyond trendline plus above-average volume (up or down depending on direction).
Symmetrical triangles are neutral; false breakouts occur. Wait for confirmation.
News, earnings, or market-wide events can invalidate technical setups quickly—monitor catalysts.
Adjust targets/stops if volatility expands or if the breakout lacks volume confirmation.
BITCOIN Bullish Breakout! Buy!
Hello,Traders!
BTCUSD reclaims key horizontal level after liquidity sweep, signaling strength. Breakout confirms bullish intent with Smart Money driving price toward 114,341 target to fill imbalance overhead. Time Frame 3H.
Buy!
Comment and subscribe to help us grow!
Check out other forecasts below too!
Disclosure: I am part of Trade Nation's Influencer program and receive a monthly fee for using their TradingView charts in my analysis.

SILVER BEARISH BREAKOUT|SHORT|
✅SILVER broke the key
Structure level of 37.60$
And the breakout is confirmed
Which makes me bearish biased
And I think that after the retest of
The broken level is complete
A bearish continuation will follow
SHORT🔥
✅Like and subscribe to never miss a new idea!✅

NYKAA<>BreakoutA breakout is occurring with increasing volume. A high-volume close above the 221-222 level would confirm the breakout, potentially from a Cup & Handle pattern.
Keeping on radar.

Denta Water & Infra Solutions Ltd <>Returns Chart shared on July 16th has already yielded a 20%+ return. Analysis suggests the stock should consolidate at its current high level after the recent steep rise, followed by a potential breakout.


DXY WIL KEEP GROWING|LONG|
✅DXY is making a rebound
From the horizontal support
Level of 104.500 while trading
In an uptrend so we are bullish
Biased and we will be expecting
A further bullish move up
LONG🚀
✅Like and subscribe to never miss a new idea!✅

$MBLY YOU AREN'T READY FOR WHAT COMES NEXT! NASDAQ:MBLY
YOU AREN'T READY FOR WHAT COMES NEXT!🚀
1⃣ #HIGHFIVESETUP
2⃣ BREAKOUT👏 RETEST 👏HIGHER 👏
3⃣ PRICE/VOLUME GAP TO FILL
🎯 $17.21
🎯 $20.01
Original videos and write-ups linked below.
LIKE IT! ♥️
SHARE IT! 🔁
BOOKMARK IT! 📘
NFA
#tradingstrategy #HIGHFIVESETUP

DXY BEARISH BREAKOUT|SHORT|
✅DXY is trading in a
Downtrend and the index
Broke the key horizontal
Level of 100.600 which
Reinforces our bearish bias
And makes us expect a
Further move down
SHORT🔥
✅Like and subscribe to never miss a new idea!✅

GOING TO ALL TIME HIGH...NSE:SONACOMS trade at 700, and make a rounding bottom pattern, when it break 720 level then it going to its all time high level @ 830, and after that it next Resistence is @ 1000....

CHF_JPY BEARISH BREAKOUT|SHORT|
✅CHF_JPY broke the rising
Support and the breakout
Is confirmed so we are
Bearish biased and we
Will be expecting a
Further move down
SHORT🔥
✅Like and subscribe to never miss a new idea!✅

PANW Cup n Handle Breakout Inbound! NASDAQ:PANW #PANW Cup n Handle breakout inbound! 💥
X: @TheRonnieVShow
You've been warned!
🍳Daily Cup n Handle
🍳95% SUCCESS RATE+AVG RISE of 52%
🍳MACD uptrend & continuation above zero line
🍳RSI Uptrend
🍳 GAP Fill
🎯$359.82
🎯$497
#whalenancypelosi
NOT FINANCIAL ADVICE 🖖

EUR_AUD WILL KEEP FALLING|SHORT|
✅EUR_AUD is going down
And the pair broke the key
Horizontal level of 1.6229
Which is now a resistance
And the breakout is confirmed
So we are bearish biased and
We will be expecting a
Further bearish continuation
SHORT🔥
✅Like and subscribe to never miss a new idea!✅

DXY BEARISH BREAKOUT|SHORT|
✅DXY broke the rising
Support line and the breakout
Is confirmed so we are bearish
Biased and we will be expecting
A further move down
SHORT🔥
✅Like and subscribe to never miss a new idea!✅

GBP-CAD Swing Breakout! Buy!
Hello,Traders!
GBP-CAD is trading in an
Uptrend and the pair
Broke the key horizontal
Level of 1.7316 and the
Breakout is confirmed
So we are bullish biased
And I think that we will
See a further move up
Buy!
Like, comment and subscribe to help us grow!
Check out other forecasts below too!

✅SPY BULLISH BREAKOUT|LONG🚀
✅SPY is trading in an
Uptrend and now we are
Seeing a bullish breakout
Of the key horizontal level
Of 479.88$ and the breakout
Is confirmed which reinforces
Our bullish bias and makes us
Expect a further move up
LONG🚀
✅Like and subscribe to never miss a new idea!✅

Great Break out StockCOFORGE gives a Great Break out on upside we can see upto 50% Return in Coming months and 20% in few weeks

AUD-USD Will Keep Growing! Buy!
Hello,Traders!
AUD-USD finally broke the
Long-term falling resistance
Line and the breakout is
Confirmed so we are
Bullish biased and I think
The the pair will go higher
Mid-term
Buy!
Like, comment and subscribe to help us grow!
Check out other forecasts below too!

ITDC 1:8.75 RR Trade set up1. Trend: Accumulation
2. Trade set up: Breakout
3. Strength: strong
4. RR: 1:8.75

ABB Getting ready for next legABB After previous trade again getting ready for next leg if it breakouts.
Keep on watchlist.

GNS : BREAKOUT VIEW $7GNS seems to enter a building trend in the last week, we are checking if this coin is able to break out to $7 in the coming time.
What makes this coin making a good chance for the breakout?
The technical side of the coin and the time frame confirmations including the price action data show there is a good chance this coin can break out.
Manage always risks, there is no rule in trading called a guaranty.
Further, this update is not trading advice.
