XAUUSD Projection: Expecting More UpsideOANDA:XAUUSD The price has dropped sharply from the top of the channel and is now approaching a key reaction zone, where several strong technical factors are converging: horizontal support, trendline support, and the Fibonacci 0.618 retracement level. This is the area where I expect the market to react strongly.
If the upward momentum picks up again from here, it’s highly likely that the channel's peak will be broken, and I’m targeting a higher level, around 3830. This is a price level I believe will be tested if the bullish trend continues.
However, trading always comes with risks. If the price closes below the lower boundary of the channel, the bullish structure will be broken and a bearish trend could start immediately.
Trade safely!
Breakout

NATGAS Strong Bullish Bias! Buy!
Hello,Traders!
NATGAS After a bullish gap up, price confirmed strength with a breakout above the horizontal demand area. SMC bias points to continuation, targeting the 3.40$ region. Time Frame 9H.
Buy!
Comment and subscribe to help us grow!
Check out other forecasts below too!
Disclosure: I am part of Trade Nation's Influencer program and receive a monthly fee for using their TradingView charts in my analysis.

NZDCAD: HTL HoldDaily Timeframe
Price holds below HTL as it fails despite opening higher after last week's closing bar
H1 Timeframe
Price crosses below ATL to signal possible downside momentum
Price crosses below EMA20 and is moving away from the band
EMA20 hovers below EMA60 to indicate bearish sentiment

Rectangle breakout with strong volume buildup📈 Buy Above: ₹155
🎯 Target 1: ₹185
🎯 Target 2: ₹210
🛑 Stop Loss: ₹135
⚡Volume confirmation + breakout retest can give momentum move.

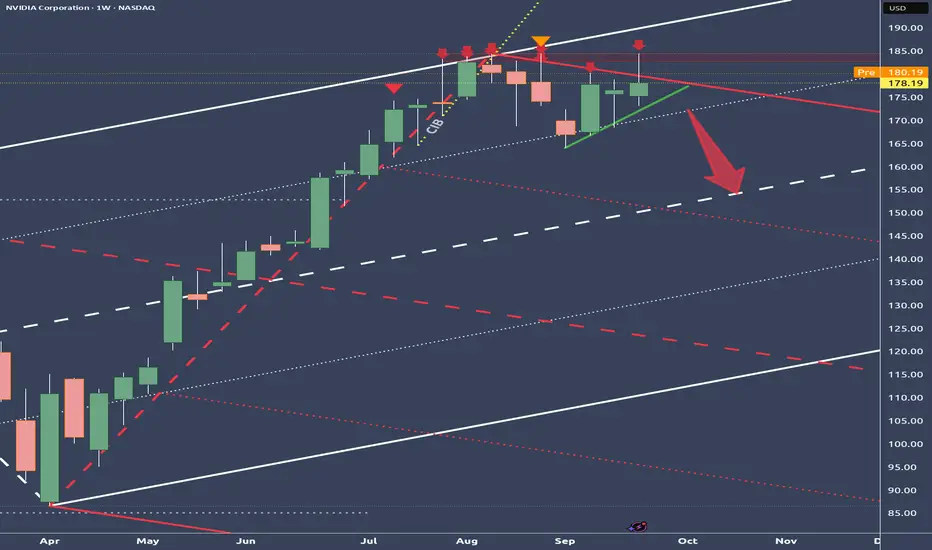
NVIDIA – Enormous Pressure After Reaching the Stretch LevelBetween July 31 and August 13, price kept nagging at the white U-MLH,
but there wasn’t enough strength to break through.
From there, price began to drift lower, pressing against the red U-MLH.
The close last Friday failed to break below the red U-MLH –
a clear sign of weakness!
If the green mini-trendline gives way and the white ¼-Line moves above price as well,
NVDA could be ripe for a short setup.
Let’s stalk the trade.
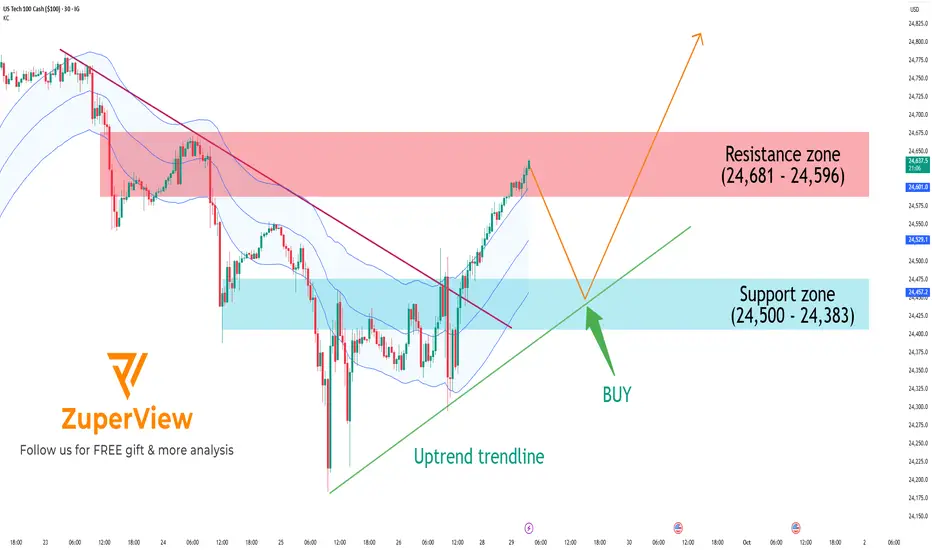
US100: Approaching resistance, pullback likely before breakoutThe IG:NASDAQ has shown a strong short-term recovery after breaking a major descending trendline. However, price is now testing a significant resistance zone, and a technical pullback is likely before the uptrend can continue.
📊 Technical Analysis: 30-minute Chart
📉 1. Overall Trend
Price has successfully broken above a descending trendline (red line), shifting market structure from bearish to bullish.
An uptrend line (green) is now acting as dynamic support.
Price is trading near the upper band of the Keltner Channel, indicating sustained bullish momentum.
🟥 2. Resistance Zone: 24,596 – 24,681
This zone has acted as a strong supply area in the past, causing multiple rejections.
Price is currently testing this area again → a rejection or short-term pullback is highly probable.
🟦 3. Support Zone: 24,383 – 24,500
This zone overlaps with previous consolidation and aligns with the uptrend line.
If a pullback occurs, this area could attract buyers and act as a launchpad for the next leg up.
🔁 Potential Trade Setups
✳️ Primary Scenario (preferred):
Price rejects at resistance → pulls back to support → bounces and resumes the uptrend
Wait for a pullback toward 24,500 – 24,383
Look for bullish price action (e.g., bullish engulfing, hammer) for entry
Enter long if support holds:
🎯 TP1: 24,650
🎯 TP2: 24,700+
🛑 SL: Below 24,350 (trendline invalidation)
🔻 Alternative Scenario (risk):
If price breaks below 24,383 and the uptrend line fails → short-term trend could shift sideways or bearish
Avoid long entries without a confirmed recovery
Re-evaluate trend structure if support fails
✅ Conclusion
A short-term uptrend is in place
However, price is now testing a major resistance zone, and a healthy pullback is likely
Please like and comment below to support our traders. Your reactions will motivate us to do more analysis in the future 🙏✨
EURCAD: Trend ContinuationA cautious trade for this week's open, expecting volatility to remain low on a Sunday night.
Daily Timeframe
Price is in an uptrend as EMA20 remains above EMA60, and price is also bouncing off of EMA20
Price recently broke above the HTL marked
H1 Timeframe
Price is accelerating away from the EMA20, and EMA20 is expanding away from EMA60
Price also crossed above the DTL

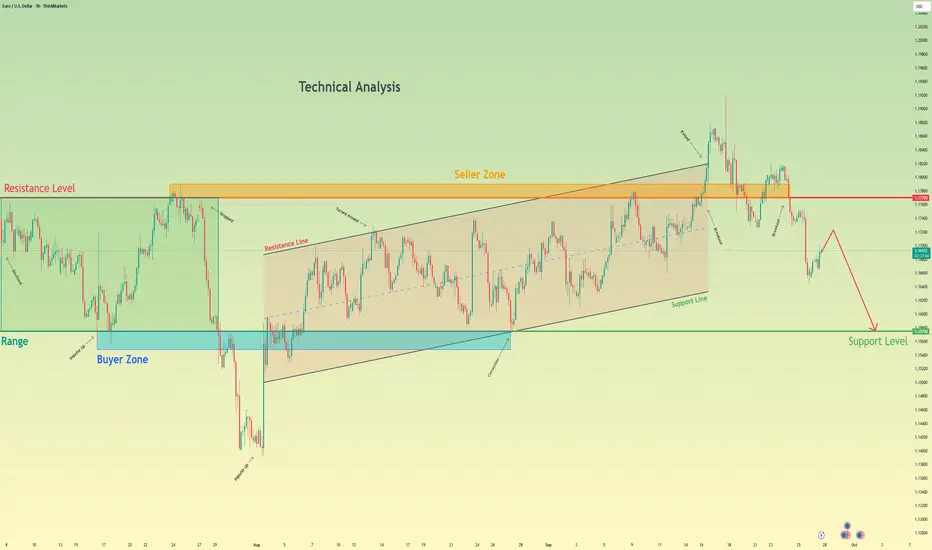
Euro will Fall Towards the 1.1575 Support LevelHello traders, I want share with you my opinion about Euro. The market for the Euro has recently shown a significant sign of weakness, with a failed breakout above the key 1.1770 Resistance Level. After a sustained rally within an upward channel, the price of EURUSD pushed into the 1.1770 - 1.1790 seller zone but failed to find acceptance, quickly reversing back below the broken levels. This 'bull trap' has invalidated the immediate bullish momentum and shifted the short-term market structure to a bearish bias. Currently, after the initial sharp decline from the highs, the asset is in a minor corrective bounce. In my mind, this price action represents a low-momentum pause before the next wave of selling. I expect that this small upward movement will soon be exhausted, and the price will continue its bearish movement downwards. A failure to produce a strong rally from these levels confirms that sellers have regained control. Therefore, I have placed my TP for this trend-continuation scenario at the major 1.1575 support level. This target is a logical objective, as it represents the next significant area of historical support and aligns with the 1.1575 - 1.1548 buyer zone. Please share this idea with your friends and click Boost 🚀
Disclaimer: As part of ThinkMarkets’ Influencer Program, I am sponsored to share and publish their charts in my analysis.
Cognex (CGNX) – Downtrend Breakout + Double Bottom ConfirmationOn the Weekly timeframe , NASDAQ:CGNX is showing strong bullish technical signals:
The long-term downtrend line has been broken both on body and shadow, confirmed with high volume .
The last weekly candle is forming near a retest, while on the Daily chart, a strong bullish candle confirms buyers stepping in.
A clear Double Bottom pattern has formed, with the neckline overlapping the downtrend line, providing stronger confirmation.
Price is trading above EMA50 & EMA100 , with EMA50 attempting a bullish cross over EMA100.
The stock has also broken through local resistance , opening the way for higher targets.
MACD is bullish, showing positive momentum.
RSI is already inside the overbought zone. However, since no divergence is present, this could still support bullish continuation, though short-term pullbacks are possible.
Key Levels:
If the breakout and retest confirm, the first target is the nearby resistance zone.
A further move towards the next resistance level (~$72–73) is possible if momentum sustains.
Important Note:
This analysis is not a buy/sell signal , but rather an educational outlook. While technicals are bullish, traders should remain cautious as RSI is in the overbought zone, where short-term corrections are common.
(For educational purposes only, not financial advice.)

BULL 4H - Bulls are back in town?On the 4H chart, the setup looks solid: a falling wedge breakout with both MA50 and MA200 left below the price. Buyers stepped in with volume, confirming interest in the move. The first target sits around $18.35, and if momentum continues, the next checkpoints are $22 and $27.6.
From a fundamental angle, Webull keeps expanding its client base and strengthening its position in the competitive brokerage market. With retail trading demand still alive, recovery scenarios for the stock look plausible.
The tactical play is simple: as long as the price stays above the moving averages, bulls are in control. Still, watch for pullbacks - markets love to test support after breakouts.
And yes, the ticker “BULL” practically screams the trend. Just make sure you don’t treat it like a real bull - those don’t care about targets.

Adobe (ADBE) – Double Bottom + EMA50 Breakout PotentialOn the Daily timeframe, NASDAQ:ADBE is showing early signs of strength:
A Double Bottom pattern has formed, often seen as a bullish reversal signal.
RSI divergence was present at the pattern lows, and RSI has broken above its trendline, suggesting momentum shift.
Price closed above the EMA50 , an important technical milestone.
MACD is in positive territory, supporting a potential continuation upward.
Volume has not spiked dramatically, but it is gradually increasing compared to recent history.
Key Levels:
If the downtrend resistance line is broken and price retests neckline/downtrend area successfully, the pattern projects a move at least towards the next local resistance zone.
Confirmation is crucial: a breakout without retest can be a false signal.
Important Note:
This analysis is not a buy/sell signal. It highlights potential upside if key technical levels are broken and confirmed. Patience for breakout + retest may provide a clearer setup.
(For educational purposes only, not financial advice.)

GOLD 1H - flag breakout confirms bullish momentumOn the 1H chart, gold has completed a bullish flag formation and already broken out to the upside. Key retest levels sit at 3748 and 3730, where buyers may confirm control. With EMA50 and EMA200 holding below, structure remains bullish. RSI has cooled off, supporting a potential continuation move.
Fundamentally , dollar weakness and Fed uncertainty sustain safe-haven demand.
Tactical plan: watch for price reaction on a possible retest of 3748–3730, as buyer interest here could launch a push toward 3820–3830.
The breakout has already happened - now gold needs confirmation to extend the rally.

ARKK: when a breakout isn’t just a breakout-it’s a runway to $91On the weekly chart, ARKK has broken out of a long-standing ascending channel, ending a year-long consolidation phase. The breakout above $71.40, with a confident close and rising volume, signals a transition from accumulation to expansion. The move came right after a golden cross (MA50 crossing MA200), further confirming institutional interest. Price has already cleared the 0.5 and 0.618 Fibonacci retracements — and the 1.618 extension points to $91.40 as the next technical target.
Momentum indicators like MACD and stochastic remain bullish with room to run. Volume profile shows low supply above $75, which could fuel an acceleration toward the target zone.
Fundamentally, ARKK remains a high-beta, high-risk vehicle — but one with focus. The ETF is positioned around next-gen tech: AI, robotics, biotech, and automation. Assets under management now exceed $9.3B with +$1.1B net inflow in 2025. YTD return stands at 37%, and its top holdings (TSLA, NVDA, COIN) are back in favor. This isn’t just a bet on innovation — it’s diversified exposure to a full-blown tech rally.
Tactical setup:
— Entry: market $69.50 or on retest
— Target: $80.21 (1.272), $91.40 (1.618 Fibo)
Sometimes a breakout is just technical. But when there’s volume, a golden cross, and billions backing it — it’s a signal to buckle up.

IMX ABOUT TO BREAK MAIN LEVEL ON WAY - UPDATE 27-09-2025📊IMX/USDT Update
IMX has successfully moved above the low time frame zone, showing early signs of strength.
Price is now approaching the main trend level (around 0.708 – 0.715). This is the critical zone where confirmation could trigger the next bigger move.
Key levels:
0.708 – 0.715 → main trend resistance. Breakout here would confirm strength.
0.654 → cycle support. As long as this level holds, the bullish structure remains valid.
0.969 – 1.00 → breakout target zone.
Upside scenario:
If IMX clears the main trend zone, probability increases for a breakout rally toward $0.95 – $1.00.
Downside risk:
If IMX fails to break the main trend and falls back below 0.708, sideways consolidation could continue, with 0.654 as the must-hold support.
📌 Summary
IMX is above the low time frame zone → momentum is improving.
Main trend breakout above 0.715 = increased probability of rally.
Target: $0.95 – $1.00 if breakout is confirmed.
Support: $0.654 remains the cycle base.

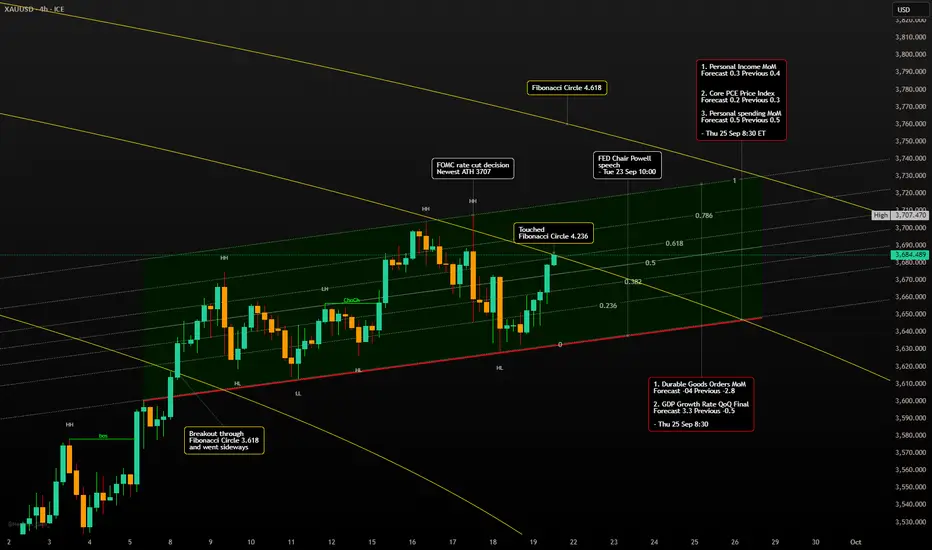
Gold Week Sep 22 - Sep 26 - Fibonacci Circles Breakout?🎢 Last Friday was a rollercoaster, and not the fun kind for me. 😅 My trading plan went completely haywire, and I'm pretty sure everyone reading was like, "What is this noob doing? 😂" But hey, we learn from our mistakes, right? So let's break down what happened.
FX_IDC:XAUUSD Crazy Friday 💥
I usually trade during the European session, and everything was going smoothly. Gold was behaving just as I expected, dropping to $3643. Then, chaos! 😱
First, it shot up to $3659, and just when I thought it was done, it decided to fall back down to $3643. But wait, there's more! At the start of the US session 🇺🇸, it went on a bullish rampage, soaring to $3685, the high of the day. 🚀 I was totally caught off guard! My bias was short because of the recent highs after the FOMC and rate cut news. That was a big lesson learned. 😩
What's Up Next? A Big Week Ahead! 🔮
Get ready, because this week is going to be HUGE! 🎉 My analysis shows that Gold is in a **super important spot** right now. It's in the perfect position to try and make a big move higher! 📈
You might not believe me, but my Fibonacci circle analysis is screaming "breakout!" 📢 If you draw a Fibonacci circle on the daily chart from **$3500.200 (April 21, 2025)** to **$3246.550 (June 29, 2025)**, you'll see a pattern of breakouts. And guess what? We're on one of those circles right now! It's no joke, you should totally try it yourself. 🤯
As long as Gold holds this level, it's primed for a surge. 🌊 I even drew an image showing that Gold is sitting right on the 4.236 Fibonacci circle level from Friday's close. This is serious stuff! 🧐
I'm expecting a sideways "ping pong" 🏓 kind of week until Thursday, bouncing around the 0.382 and 1 Fibonacci levels. The ascending parallel channel gives us a clue on where it might go in the short term.
Heads Up: This Week's Economic Events 📅
Keep an eye on these key events, as they can really shake things up! 🔔
Thursday, September 25th, 8:30 AM EST
- Durable Goods Orders MoM: Forecast -0.4% (Previous -2.8%)
- GDP Growth Rate QoQ Final: Forecast 3.3% (Previous -0.5%)
Friday, September 26th, 8:30 AM EST
- Personal Income MoM - Forecast 0.3 Previous 0.4
- Core PCE Price Index - Forecast 0.2 Previous 0.3
- Personal spending MoM - Forecast 0.5 Previous 0.5
My Two Cents: A Word of Caution 🙏
Things can change in the blink of an eye, so be careful! I don't know what the next Asian and EU session will bring, but I have a feeling the US session is gearing up to buy Gold again. 💰
Remember, different trading sessions (Asia 🌏, Europe, and the US) have different biases. Don't make the same mistake I did last Friday! 😔 Stay sharp and happy trading! 🚀
-------------------------------------------------------------------------
This is just my personal market idea and not financial advice! 📢 Trading gold and other financial instruments carries risks – only invest what you can afford to lose. Always do your own analysis, use solid risk management, and trade responsibly.
Good luck and safe trading! 🚀📊
God Candle on SQD Entering Its Next Era
After a massive breakout from sub-$0.10 levels, $SQD has rallied over 100% in 24h, fueled by growing adoption news and upcoming staking/rewards utility.
Chart Setup
Strong parabolic move with volume confirming trend.
Local top printed around $0.28 before sharp rejection → healthy cooling phase now around $0.20 support zone.
Key support: $0.20 psychological + breakout retest.
Resistance: $0.25–$0.28 range (previous rejection zone).
Scenarios
Holding above $0.20 could set up a higher low → continuation toward $0.30+.
Failure to hold $0.20 may trigger a deeper retrace into $0.16–$0.18 accumulation zone before the next leg.
Narrative Catalyst
SubSquid isn’t just hype – it’s solving blockchain data infra across Solana, Ethereum, Polkadot & more. With 100M+ daily API calls, 70+ projects, and staking about to go live, token demand could accelerate alongside ecosystem adoption.
📌 Outlook
Near term → consolidation after vertical run.
Mid term → continuation likely as adoption narrative + staking kick in.
Long term → if SubSquid becomes the “AWS of Web3 data,” today’s moves may just be the beginning.

AUD-USD Bullish Confirmation! Buy!
Hello,Traders!
AUDUSD confirms breakout above neckline, shifting order flow bullish. SMC structure suggests price will expand toward liquidity resting at 0.6555. Time Frame 1H.
Buy!
Comment and subscribe to help us grow!
Check out other forecasts below too!
Disclosure: I am part of Trade Nation's Influencer program and receive a monthly fee for using their TradingView charts in my analysis.

Is this a platinum breakout?Using a weekly chart of a platinum ETF.
Breaking out above it's triangle pattern. Needs confirmation though or retrace in the next coming months

GUTS - Fractyl Health - $1.38 Breakout - $2.55 PTNASDAQ:GUTS broke above a $1, hitting $1.38 before consolidating. NASDAQ:GUTS is currently breaking a long-term downward channel it's been trading in since Apr 2024. We need to see support above $1.14 to push past the $1.37 - $1.47 Resistance Levels, looking for a $2.55 PT / Retest based on the comany stated: Trial Results Support Revita as First Therapy for Post-GLP-1 Weight Maintenance; Shares Rise Pre-Bell

CHFJPY: Trend ContinuationI see another trend continuation opportunity over on the CHFJPY pair. One thing to note is that rollover is in a few hours so consider exiting and re-entering this position to avoid getting stopped out.
Daily Timeframe:
Price crossed above HTL and the fakeout was invalidated quickly as price crossed back above HTL
H1 Timeframe:
I see quite a bit of confluence here with the following signals observed in the subsequent bullets
Price is moving out of EMA band again
Price crossed above DTL so that signals a likely end to the intraday counter-trend move
EMA20 remains above EMA60 to show overall uptrend confluence with the daily timeframe

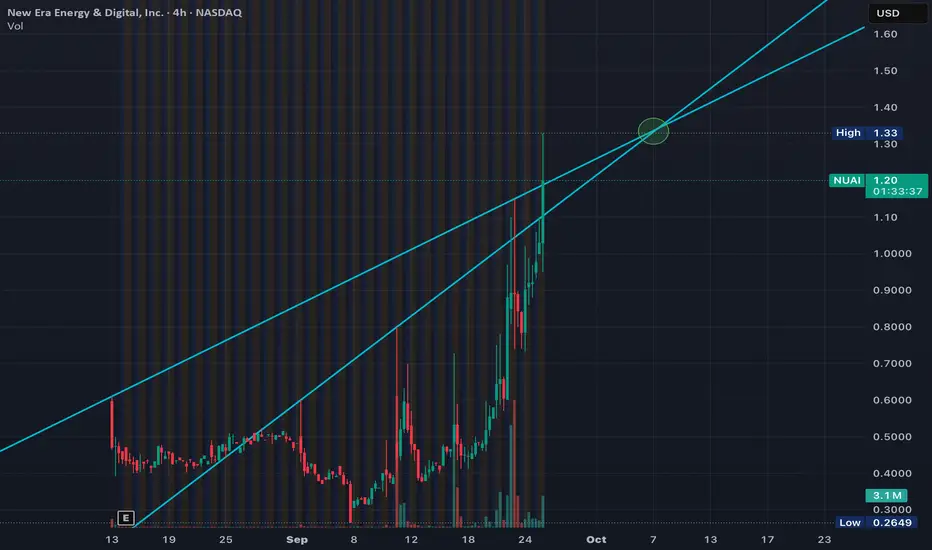
$NUAI - New Era Energy - $1.33 Breakout PointNASDAQ:NUAI broke $1 this morning, hitting $1.33 before slightly consolidating after Market Open. Looking for a continuation into a $1.33 retest and breakout after the company announced that its advancing its development of its Texas Data Center Venture for 1 Gigawatt Power Capacity.
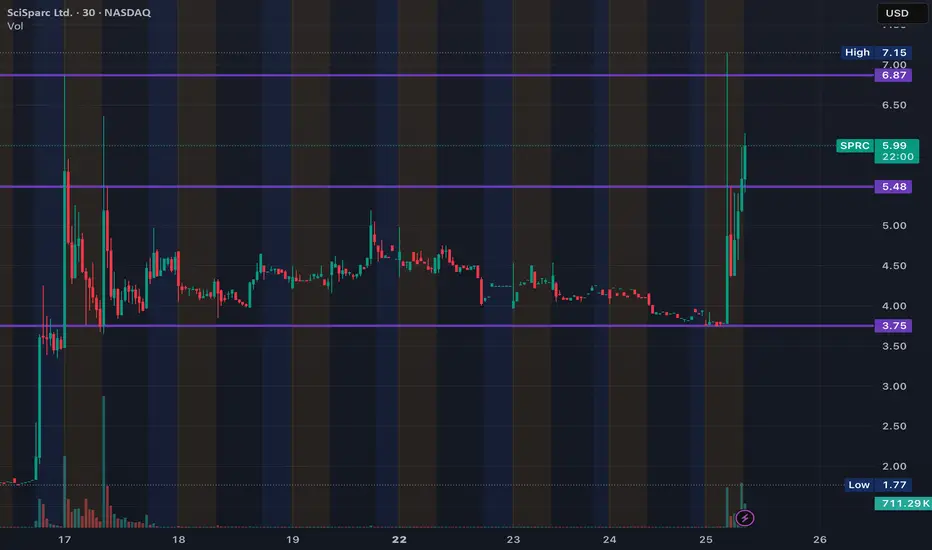
$SPRC - SciSparc - $5.47 Breakout - $10.45 RetestNASDAQ:SPRC bounced off the $3.75 support and hit $7.15, retesting the $6.87 levels of resistance. Looking to find support on the $5.47 levels to continue breaking that $6.87 and pus to retest the $10.45s after announcing plans to launch a quantum computer ting 3D protein modeling initiative.
$EVAX - Evasion - $5.52 Resistance? $8.92 Retest?NASDAQ:EVAX broke out this morning $5.52 and is showing signs of potentially consolidating after announcing licensing for its EVX-83 Vaccine Candidate to Merck for $7.5 Million Cash Payment, up to $592 Million in Milestones and Royalties on Sales.
If we could get past that $5.52 Level of Resistance and blow through $6, we would be targeting an $8.92 Retest and consolidation at that point.
