AUDCAD: Trend ContinuationThere's a trend continuation opportunity present on the AUDCAD pair. Here's my breakdown by timeframe.
Daily Timeframe:
Price pulled back and held supported at EMA20, which isn't a strong indication of support
Strong uptrend is indicated by EMA20 above EMA60
H1 Timeframe:
There's confluence here where Price is exiting the EMA20/60 band
EMA20 also remains above EMA60 for a strong uptrend
Pricing breaking DTL also remains valid as there was upside momentum
Breakout

XAUUSD Setup: Overbought Conditions Signal a Potential Pullback!OANDA:XAUUSD Price is approaching a key resistance zone at the upper boundary of the ascending channel. This boundary often acts as a natural barrier where the market tends to slow down or reverse. As price reaches the channel top, the probability of a correction increases as profit-taking pressure builds.
If a correction unfolds, the 3,715 USD level will be the key support to watch. The resilience of buyers around this zone will determine whether the uptrend can extend further and push prices beyond previous highs. On the other hand, if 3,715 is broken, the market could shift direction with price sliding deeper toward the lower boundary of the channel and temporarily putting buyers at a disadvantage.
What matters most now is not rushing into trades but observing carefully. The market always leaves clues through price action, candlestick formations and trading volume. When these elements align, confirmation becomes stronger and that is the moment when a setup carries real weight. Above all, risk management remains essential because it is the shield that allows traders to withstand uncertainty and seize opportunities with confidence.
Good luck and trade safe!

BITCOIN Bullish Breakout! Buy!
Hello,Traders!
BTCUSD reclaims key horizontal level after liquidity sweep, signaling strength. Breakout confirms bullish intent with Smart Money driving price toward 114,341 target to fill imbalance overhead. Time Frame 3H.
Buy!
Comment and subscribe to help us grow!
Check out other forecasts below too!
Disclosure: I am part of Trade Nation's Influencer program and receive a monthly fee for using their TradingView charts in my analysis.

ETH Analysis: Deeper Pullback in PlayETH is still trading within a broader uptrend channel, but recently, the price has started to pull back after a significant rally. After pushing up too far, the market is now taking a breather and recalibrating.
From a technical standpoint, this pullback is completely normal and healthy after such a strong move. Pullbacks like this are part of any bullish trend, providing the market a chance to reset. If the pullback continues, the next target could be the 3,600 support area, where multiple key factors converge: horizontal support, trendline support, and the 0.618 Fibonacci retracement level.
The 3,600 level is crucial. If ETH holds strong here and shows signs of a reversal, it could be a solid entry point for the next leg up. However, if the price breaks below this level, we may see deeper downside, and the current bullish structure could start to break down.
As always, confirm your setups before entering and make sure your risk management is solid. Stay alert for the next opportunities!

EUR/USD is poised for a significant moveHey everyone, it's Ken here!
Looking at the EUR/USD chart on the H2 timeframe, I have to say, things are looking pretty solid. The price is moving around, but notice how it's climbing slowly and steadily. This tells me the buyers are getting active and feeling bullish.
That said, I'm not jumping in just yet. I'm waiting for confirmation before making a move. My target is a buy towards 1.1880, but I want to see the price pull back to the level I’ve marked first.
Once it does, I’ll be keeping an eye out for volume increases and a solid candlestick pattern to confirm it's go-time.
What do you guys think? Drop your thoughts in the comments, I’d love to hear what you think!

NZD_CHF SWING BEARISH BREAKOUT|SHORT|
✅NZD_CHF broke the key
Structure level of 0.4640
While trading in an local
Downtrend, which makes me
Bearish biased, and and I think
That after the retest of the
Broken level is complete,
A bearish continuation will follow
SHORT🔥
✅Like and subscribe to never miss a new idea!✅

NZD_USD BEARISH BREAKOUT|SHORT|
✅NZD_USD price breaks key support zone, confirming bearish orderflow. Smart Money shows breakout with liquidity run, targeting lower demand near 0.5810 as sellers take control after structure shift.
SHORT🔥
✅Like and subscribe to never miss a new idea!✅

$JZXN - Jiuzi Holdings - $4 PTNASDAQ:JZXN jumped from $0.78 to $3.13 going into today's trading session. Looking for support at the $2.53 to push and hold above the $3 Price Levels to push on to our $4 PT.
This comes after announcing a new Chief Financial Officer and beginning a $1B Investment Strategy into Crypto

NZD_JPY FREE SIGNAL|SHORT|
✅NZD_JPY is going down currently
As the pair broke the key structure level around 86.600
Which is now a resistance, so we are bearish
Biased and therefore we can enter a following short trade:
Entry: 86.500
Stop Loss: 86.700
Take Profit: 86.100
SHORT🔥
✅Like and subscribe to never miss a new idea!✅

GBPNZD Trade AnalysisCMCMARKETS:GBPNZD
---
📊 GBPNZD Trade Analysis
**Technical Outlook (Weekly & Daily):**
* **Resistance Zone:** 2.30 is a major pivot, coinciding with a resistance that dates back to Nov 2009 continuation cell.
* **Support Levels:**
* Immediate: 2.22 (near-term take-profit level).
* Stronger: 2.18–2.14 (historical resistance turned support in 2016).
* Extended: 2.09, 2.02, 1.97 (if bearish momentum sustains).
* **Alternative Upside Scenario:** If price decisively breaks above 2.30, the path opens to 2.36 → 2.46 → 2.52 (previous highs).
**Psychological Levels:**
* **2.30:** A psychological round number where markets tend to slow before breaking direction. Either strong rejection → sell-off, or breakout → bullish continuation.
* **2.20 handle:** Also a magnet level if bearish continuation gathers steam.
**Fundamental Outlook:**
* **GBP:** Weak momentum; growth and inflation concerns may keep GBP capped. BoE stance likely cautious.
* **NZD:** Relatively stronger outlook if RBNZ maintains hawkish bias or data surprises positively. NZD strength supports downside in GBPNZD.
* **Macro Risk:** Any global risk-off event could weigh on NZD (commodity-linked, risk currency), which would blunt the bearish bias.
---
### 🎯 Playbook (Your Setup)
* **Entry:** 2.30 (short bias at rejection).
* **Stop Loss:** 2.33 (clear invalidation above resistance).
* **Take Profit 1:** 2.22 (short-term support).
* **Take Profit 2:** 2.18 (historical breakout retest).
* **Extended Targets:** 2.09 → 2.02 → 1.97 (if momentum sustains).
**Alternative Scenario (Bullish Breakout):**
* Above 2.30 → upside targets at 2.36 → 2.46 → 2.52.
* This would invalidate immediate short bias.
---
### 🧮 Risk–Reward
* From 2.30 short to 2.22 → **Risk 300 pips / Reward 800 pips ≈ 1:2.6 R\:R**.
* Extended to 2.18 → **1:4 R\:R**.
* Extended downside to 2.09+ → >1:7 R\:R.
* Attractive skew provided resistance holds.
---
✅ **Summary:**
* Strong bearish case if 2.30 holds as resistance.
* Fundamentals lean slightly in favor of NZD, which supports bearish GBPNZD bias.
* Psych level 2.30 is the battleground — rejection = bearish play, breakout = bullish extension.

$SLE - Super League - $13.98 Retest?NASDAQ:SLE broke out from $3.20 in yesterday’s trading session and continued to $13.98 after announcing a private placement and investment from Evo Fund

$SLE - Super League - $13.97 Retest?NASDAQ:SLE broke out from $3.20 in yesterday’s trading session and continued to $13.98 after announcing a private placement and investment from Evo Fund

NZDCAD: Weak Bearish SignalThis pair is interesting, but must be approached with caution.
Daily Timeframe:
Price crosses below HTL, but the overall daily price action is quite chaotic so should proceed with caution
H1 Timeframe:
Price fails to make a new higher high on the intraday timeframe, which is a good sign that this uptrend is weakening
There's also greater confluence with the overall downtrend as price crosses below ATL
Another indication of downtrend is price below EMA20 and EMA20 is pushing below EMA60

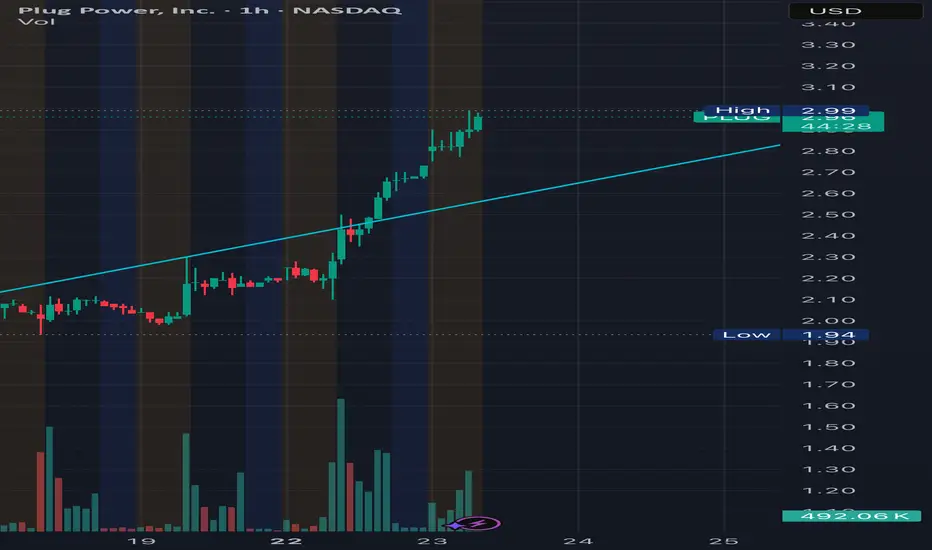
$PLUG - Plug Power - $3.49 PTNASDAQ:PLUG broke out from $1.41 and currently projecting a $3.40 PT after announcing it will be offering over 185 million shares at a $2.00 exercise price, will remain valid until March 2028.
EURUSD: Dip and Bounce from Triangle SupportHello everyone, here is my breakdown of the current Euro setup.
Market Analysis
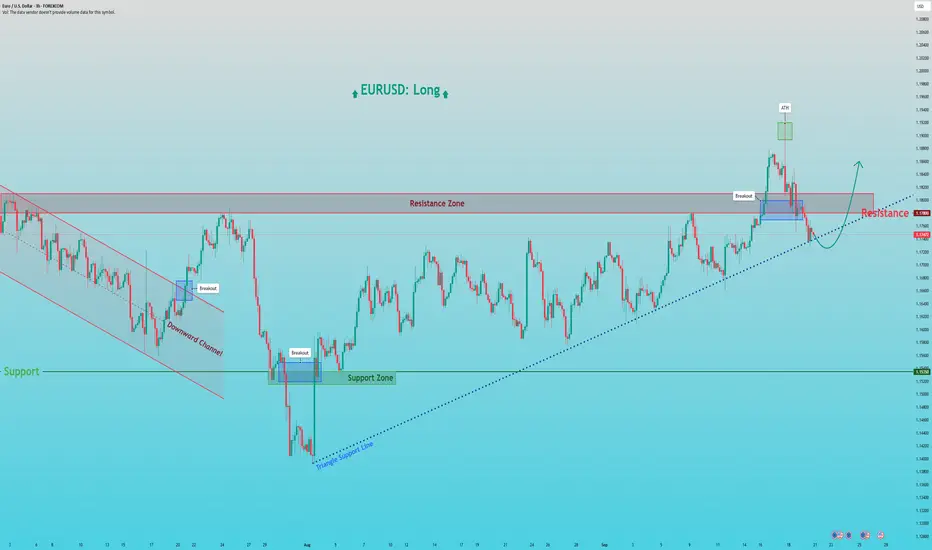
After reversing from a prior Downward Channel, EURUSD has been consolidating in a large Upward Triangle. This pattern is typically bullish and is defined by a flat horizontal Resistance at the 1.1780 level and an ascending support line, showing that buyers are becoming progressively more aggressive on each dip.
An interesting part of this pattern's history is the 'fake breakout' we saw previously, where the price spiked to a local ATH at 1.1920 before falling back inside. Currently, the price is again in a corrective pullback, heading towards the ascending Triangle Support Line for another test.
My Scenario & Strategy
My scenario is based on the expectation that this Upward Triangle will eventually resolve to the upside. I'm looking for the price to complete its downward movement and find strong support on the ascending Triangle Support Line. A confirmed bounce from this line would be the key signal that buyers are stepping in to defend the trend.
Therefore, the strategy is to watch for this bounce. A successful rebound that finally leads to a decisive breakout above the Resistance Zone would validate the long scenario. The primary target for the subsequent expansion is 1.1860, a logical objective for the move that would follow.
That's the setup I'm tracking. Thank you for your attention, and always manage your risk.
Bitcoin will Retest Support Before the Next Leg UpHello traders, I want share with you my opinion about Bitcoin. The market structure for Bitcoin has seen a significant shift from bearish to bullish, following a strong reversal from the 109300 - 110000 buyer zone. This pivotal move led to a breakout from a prior downward wedge, invalidating the bearish trend and establishing the current, well-defined upward channel. The price action for BTC has since been constructive, creating a series of higher highs and higher lows within the boundaries of this new channel. Currently, the asset is undergoing a healthy corrective phase after being rejected from the highs, and the price is now trading at a critical inflection point, close to the ascending support line of the channel. In my mind, this pullback represents a classic trend-continuation opportunity. I expect that the price will bounce from the channel's ascending support line. I think this rebound will have enough momentum to break through the 117500 Resistance Level and continue its rally towards the major seller zone. Therefore, I have placed my TP at 119500. Please share this idea with your friends and click Boost 🚀
Disclaimer: As part of ThinkMarkets’ Influencer Program, I am sponsored to share and publish their charts in my analysis.

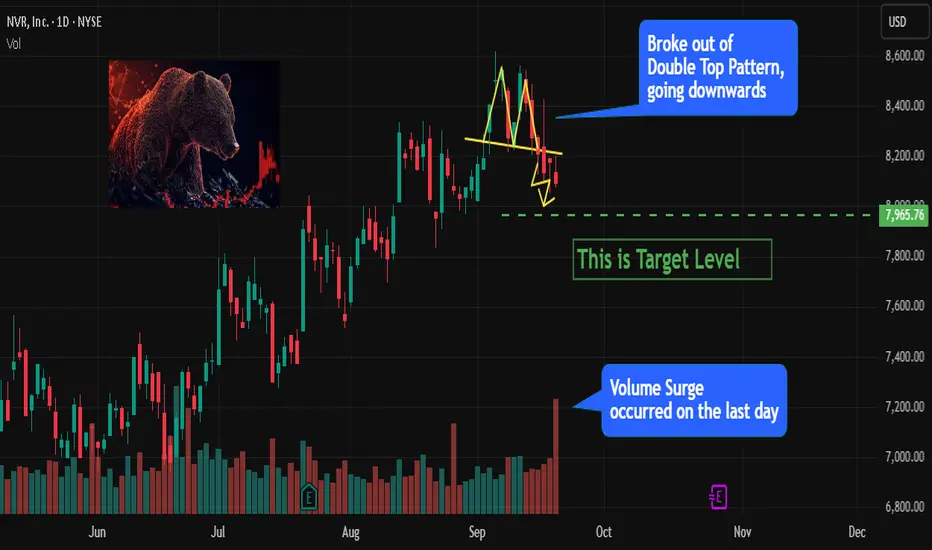
NVR Breaks Down from Double Top - Bearish Outlook Ahead1. Double Top Breakdown
NVR has recently broken down from a Double Top pattern .
This classic reversal structure indicates a shift from bullish to bearish sentiment.
2. Volume Confirmation
The breakdown was accompanied by a strong surge in volume on the last trading day .
High volume confirms strong selling interest and increases the reliability of the move.
3. Bearish Momentum Building
Sellers have taken control after the failed attempt to sustain recent highs.
Price action shows increasing downward momentum with little sign of reversal yet.
4. Downside Potential
With breakdown of the Double Top pattern and heavy volume, NVR shows strong downward potential .
Further weakness is likely if selling pressure continues in the next sessions.
5. Technical Confluence
Breakdown of a major reversal pattern (Double Top).
Strong volume confirming the bearish move.
All factors point toward extended downside.
GBPNZD: Trend ContinuationMomentum is picking again on the GBPNZD pair. Here are my observations on the daily and H1 timeframes.
Daily Timeframe:
HTL marks a resistance turned support
Price is also exiting the EMA areas, which is an indication of momentum
H1 Timeframe:
Price shows momentum as it crossed above the DTL
Price shows confluence with higher timeframe trend as it holds above EMA20
Uptrend is signaled by EMA20 remaining above EMA60

AVAX — 220-Day Range Broken, Next Stop $35?After 220 days of consolidation, AVAX has finally broken out of its trading range. The key resistance at $27 was cleared, and price quickly pushed into the $30 psychological level, where it faced rejection. Currently, AVAX is consolidating just below, around $29.
So, what’s next? Now all eyes are on the retest to confirm $27 as the new launchpad.
Support Confluence (Long Entry Zone)
3M/Quarterly level: $27.71 → major support
0.382 Fib retracement: $27.65 (low $23.87 → $30)
0.5 Fib retracement: $26.93 → perfectly aligned with $27 zone
Swing High: $27.38 → could be retested
4H 21 EMA: $27.71
4H 21 SMA: $27.41
Weekly VWAP: $27.41
Fair Value Gap (FVG): imbalances in this zone
📌 With all these layers of confluence, the $27.7–$27.4 zone is the ideal long entry area.
Resistance Confluence (Take Profit Zone)
0.5 Fib retracement of the entire downtrend: $35.22
15B Market Cap resistance: $35.5
Yearly Open: $35.7 → major target
3M/Quarterly level: $35.71
TPO resistance cluster: $35.22–$37.28
📌 Together, these levels form a stacked resistance zone at $35–$37, making it both the ideal take-profit area and a potential short setup.
Zoomed-Out View:
TPO Chart Reference:
🟢 Long Trade Setup
Entry Zone: $28.0 → $27.4 (DCA best approach)
Stop-Loss: Below $26 (to be adjusted after reversal confirmation)
Take Profit: $35
Potential Gain: +25%
R:R: 1:4+
Technical Insight
After 220 days of sideways compression, the breakout above $27 marks a shift in market structure.
A retest of this level would validate it as new support and provide a high-probability swing long setup.
The $35–$37 zone, reinforced by the yearly open at $35.7, stands out as the major resistance cluster, making it both the ideal profit target and a potential reversal area.
Key Levels to Watch
Support Zone: $28–$27
Resistance Zone: $35–$37
🔍 Indicators used
DriftLine — Pivot Open Zones → For identifying key yearly/monthly/weekly/daily opens that act as major S/R reference points
Multi Timeframe 8x MA Support Resistance Zones → to identify support and resistance zones such as the 4H 21 EMA/SMA.
➡️ Available for free. You can find it on my profile under “Scripts” and apply it directly to your charts for extra confluence when planning your trades.
_________________________________
💬 If you found this helpful, drop a like and comment!

GBP-JPY Bearish Breakout! Sell!
Hello,Traders!
GBP-JPY made a bearish
Breakout of the rising
Support line and now
Made a retest of the new
Rising resistance and made
A pullback so we are
Bearish biased and we
Will be expecting a
Further bearish move down
Sell!
Comment and subscribe to help us grow!
Check out other forecasts below too!
Disclosure: I am part of Trade Nation's Influencer program and receive a monthly fee for using their TradingView charts in my analysis.

Hype's path to $55BYBIT:HYPEUSDT.P is currently forming a wedge shape pattern, is it indicating that it will break out and follow Path A, the blue path? I'm not so sure, I am sure we'll hit $55 either way.
If we take the red path, Path B, we'll come down to some heaviy support which could give us the fuel needed to get to $55
Out of all of the oscillators I was using, all except the chop zone on the daily mind you, were in bearish mode. So logically one would choose the red Path B right?
I can't wait to see how this plays out, shall we dip some and buy some more BYBIT:HYPEUSDT.P on Path B or experience more of a continuation of the current trendline to $55?
Let me know what you think in the comments, that'ls all for today, let's go HYPE!!! straight to $55!

Gold's Next Move: Is a Breakout Imminent?Looking at the XAUUSD chart, I’m finding it quite fascinating.
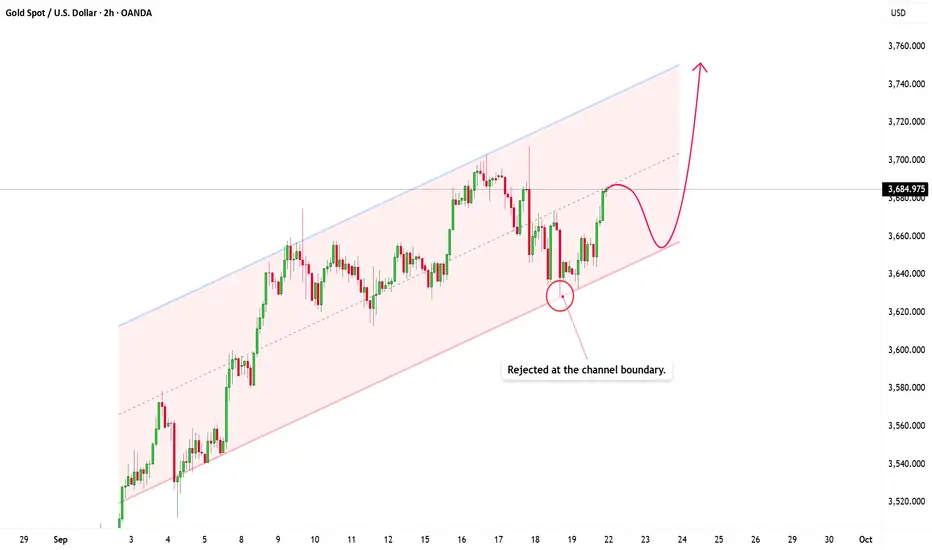
Here’s the situation: XAUUSD is moving within an upward parallel channel, respecting the market structure perfectly, and we’re starting to see early signs of renewed buying interest right after a strong rejection from the support zone.
Currently, price is trading near a key resistance zone, and this is where the market gets interesting. At this resistance zone, there's a high likelihood of a short-term correction within the price channel. If price holds within the channel, the uptrend could continue, and the upper channel boundary might even be broken, extending the upward momentum further.
I’m targeting the upper boundary of the channel, and given the market context, this is entirely possible.
Keep in mind that, in a channel like this, trading with the trend is generally more favorable than fighting against it. Until the channel is broken, the bulls are still in control.
Do you agree? Feel free to share your thoughts in the comments below!
BTCUSD Short Setup After Trendline BreakBTCUSD just made a decisive break below the main trendline, a clear signal that bearish momentum is building. Sellers have stepped up, and the tone of the market has shifted — control is now in their hands.
In the short term, I’m watching for a retest of the broken level. What used to be support may now act as resistance. If buyers can’t push price back above that zone, it confirms weakness and opens the door for continuation lower, with 112,000 as the next key target.
Traders should keep an eye on bearish signals like rejection wicks, bearish engulfing candles, or strong sell volume. A clean reclaim above resistance would invalidate the bearish bias, but until then, sellers remain in control. Let’s see how this unfolds.
