USDCHF BEARISH BREAKOUT|SHORT|
✅USDCHF clean break below rising trendline with bearish displacement confirms BOS. Price trading under broken structure, expecting retrace into premium FVG before continuation toward sell-side liquidity at target. Time Frame 1H.
SHORT🔥
✅Like and subscribe to never miss a new idea!✅
Breakout

PUMP/USDC - Strong Rebound from Major Low + BreakoutPrice has formed a clear higher low after a deep correction and is now breaking above the previous consolidation zone with increasing momentum. The structure turned bullish on this timeframe with a textbook bounce from support. Watching if buyers can sustain the move toward the next significant extension area – early signs look promising, but confirmation still needed.

Skycoin: ready for a second leg? key levels to watch aheadSkycoin. Is this old alt warming up for a second leg or was that spike the whole show? Recently the market has been rotating into smaller caps again, and Skycoin woke up with a sharp impulse up while most traders were still staring at majors. Now price is chilling right under a thick supply zone, so the next move from here can be juicy.
On the 4H chart, price is ranging just below resistance around 0.067–0.069 after a strong vertical pump. RSI cooled from overbought back to the mid‑50s without any real dump, which looks more like a pause than distribution. VPVR shows a chunky support node in the 0.063–0.065 area, so I’m leaning to the long side as long as that block holds. I might be wrong, but this looks like a classic consolidation before a breakout.
My base case ✅ a shallow pullback into 0.064–0.065 or a clean 4H close above 0.069 opens the road toward 0.072–0.075. If buyers fail and we get a firm close below 0.061, the bulls are trapped and I’d expect a slide toward 0.058 ⚠️. I’m stalking a long from the green zone and will reassess if that support gets sliced. Not financial advice, just my game plan.

U.S. Dollar Index (DXY) – 1H Technical AnalysisU.S. Dollar Index (DXY) – 1H Technical Analysis
Timeframe: 1-Hour Chart
1. Market Structure Overview
The DXY is currently trading around 96.83, following a clear rejection from major higher-timeframe resistance near 97.80–98.00. Price has transitioned from a bullish structure into a short-term bearish phase after:
A double rejection at the main resistance zone
A confirmed breakout failure above prior resistance (~97.20)
A subsequent Change of Character (CHoCH) signaling momentum shift
The broader structure shows distribution at highs and a controlled decline toward key support.
2. Key Technical Zones
🔵 Main Resistance: 97.75 – 98.00
Strong supply zone
Multiple rejections (circled areas)
Likely institutional distribution
Remains valid until clean breakout and sustained acceptance above
🔵 Intermediate Resistance: ~97.20
Prior breakout level turned resistance
Clean rejection after retest
Now acting as short-term upside target
🟢 Main Support: 96.30 – 96.50
Higher-timeframe demand zone
Recent bullish reaction (long lower wick + impulse bounce)
Currently defending downside
3. Smart Money Concepts (SMC) Perspective
FVG (Fair Value Gap) formed during previous bullish leg — later mitigated.
Break of Structure (BOS) occurred to the downside after resistance rejection.
CHoCH confirms short-term bullish attempt after support reaction.
Liquidity likely rests:
Below 96.30 (sell-side liquidity)
Above 97.20 (buy-side liquidity)
Market appears to be in a range compression phase between 96.40 and 97.20 before expansion.
4. Current Price Behavior
Price is consolidating above main support after a sharp rebound. The structure suggests:
Short-term accumulation near support
Potential liquidity sweep toward 96.40 before expansion
Compression pattern often precedes impulsive move
Momentum is neutral-to-slightly bullish on lower timeframe after support defense.
5. Trading Scenarios
🟢 Bullish Scenario (Preferred While Above 96.30)
Potential dip into 96.40–96.50 (liquidity grab)
Bullish confirmation on lower timeframe
Target 1: 97.00
Target 2: 97.20 (range high / resistance)
Extended target: 97.75 (main resistance)
Invalidation: Sustained break and close below 96.30.
🔴 Bearish Scenario
If 96.30 breaks decisively:
Liquidity flush toward 96.00–95.80
Continuation of short-term bearish structure
Broader correction within higher timeframe distribution
6. Conclusion
The DXY is trading inside a defined range between 96.30 (support) and 97.20 (resistance) after rejecting major higher-timeframe supply at 98.00.
Current structure favors a short-term bullish retracement toward 97.20, provided support continues to hold. However, the broader context still reflects distribution near major resistance, meaning upside may remain corrective unless 97.75–98.00 is reclaimed.
Disclaimer
This analysis is provided for educational purposes only and does not constitute financial, investment, or trading advice. The information presented is based on technical analysis and market structure interpretation at the time of writing. Financial markets involve risk, and past performance is not indicative of future results. Always conduct your own research and consult with a licensed financial advisor before making any trading or investment decisions.

XAUUSD Long: Holds Demand - Upside Toward $5,180 in PlayHello traders! Here’s a clear technical breakdown of XAUUSD (1H) based on the current market structure shown on the chart. Gold previously experienced a strong impulsive bullish move, which ultimately topped at a clear pivot high, where buying pressure began to fade and sellers stepped in aggressively. From this pivot point, price reversed sharply and entered a corrective bearish phase, forming a sequence of lower highs and lower lows. This move was guided by a well-defined descending supply trend line, confirming sustained selling pressure and controlled downside continuation rather than panic-driven selling. During this decline, price broke below a key Demand Zone around 5,000, triggering a bearish continuation and accelerating the sell-off toward the next pivot low. However, at this lower pivot point, selling momentum weakened significantly, and buyers responded with strong demand. This marked a structural shift, as price began forming higher lows and eventually broke above the descending supply trend line — an early signal that bearish control was losing strength.
Currently, after reclaiming the broken structure, XAUUSD transitioned into a ranging phase above demand, suggesting accumulation rather than distribution. The recent breakout from this range confirmed renewed buyer interest, with price now holding above the Demand Zone while respecting a rising demand trend line. Current price action shows consolidation near demand, indicating a healthy pause rather than rejection.
My primary scenario favors bullish continuation, as long as price holds above the 5,000 Demand Zone and continues to respect the ascending demand line. From a structural perspective, the failure of sellers to regain acceptance below demand suggests that the previous breakdown was corrective. A sustained bullish reaction from this area could lead to a move toward the 5,180 Supply Zone (TP1), where sellers may attempt to defend. A clean breakout and acceptance above supply would open the door for further upside expansion. However, a decisive breakdown and acceptance below the demand zone and rising trend line would invalidate the bullish scenario and signal deeper corrective risk. Until then, structure and price behavior continue to favor buyers. Manage your risk!

XAUUSD: Range Holding Strong - Upside Expansion PossibleHello everyone, here is my breakdown of the current XAUUSD setup.
Market Analysis
XAUUSD previously experienced a strong bearish impulse, breaking decisively below a key support area and triggering an acceleration to the downside. This sell-off marked a clear loss of bullish control and led to a deep corrective phase. After forming a local bottom, price began to recover and transitioned into a consolidation phase, signaling a slowdown in selling pressure. During this recovery, Gold started forming higher lows while respecting a rising triangle support line, indicating that buyers were gradually stepping back into the market. As price continued to stabilize, XAUUSD broke above the descending triangle resistance line, confirming a short-term structural shift in favor of buyers. Following this breakout, price entered a well-defined range above the support zone, showing acceptance above demand rather than an immediate rejection. Multiple breakout and retest behaviors around the support area suggest that buyers are actively defending this level. The market is now compressing within this range, reflecting absorption of supply and preparation for a potential directional move.
Currently, XAUUSD is trading above the key support zone around 5,040–5,060, while holding structure above the rising triangle support line. Price action remains constructive, with recent pullbacks appearing corrective rather than impulsive. This behavior suggests that bearish attempts are being absorbed, and buyers maintain short-term control as long as price stays above support.
My Scenario & Strategy
My primary scenario favors a bullish continuation, provided XAUUSD continues to hold above the 5,040 support zone and respects the ascending triangle support line. Consolidation above demand indicates accumulation rather than distribution. A confirmed breakout and acceptance above the current range would open the path toward the 5,180 resistance zone (TP1), which aligns with a major resistance and previous supply area. This level is expected to attract selling pressure, making it a key upside objective.
However, a decisive breakdown and acceptance below the support zone and triangle support line would invalidate the bullish scenario and signal a return of bearish pressure, potentially leading to a deeper corrective move. Until that happens, market structure and price behavior continue to favor buyers.
That’s the setup I’m tracking. Thank you for your attention, and always manage your risk.

EURUSD: Market Structure Flip Signals Upside Potential To 1.1970Hello everyone, here is my breakdown of the current EURUSD setup.
Market Analysis
EURUSD was previously trading within a clearly defined downward channel, marked by consistent lower highs and lower lows. This structure reflected controlled bearish pressure, where sellers maintained dominance but price action remained technical and orderly. Each corrective rally toward the upper boundary of the channel was met with selling interest, confirming the validity of the bearish trend and the strength of supply at higher levels. As price approached the lower boundary of the descending channel, downside momentum began to weaken. Sellers struggled to extend the move lower, and EURUSD started forming a base. This loss of bearish strength ultimately resulted in a decisive breakout above the downward channel, signaling a potential trend shift rather than a simple correction.
Currently, price broke out of the consolidation range to the upside and held above the reclaimed support, reinforcing bullish intent. The market is now trading above a rising trend line, with higher lows forming, indicating that buyers are gradually gaining control. Overall, EURUSD is transitioning from a bearish structure into a bullish continuation phase, supported by strong structural reclaim and healthy consolidation.
My Scenario & Strategy
My primary scenario favors bullish continuation, as long as EURUSD holds above the key Support Zone and continues to respect the rising trend line. The successful breakout from the downward channel, followed by consolidation and another upside breakout, suggests that the prior bearish move has been exhausted and that sellers are losing control. From a structural perspective, the inability of price to break back below support confirms that recent pullbacks are corrective rather than impulsive. As long as price remains above support, dips are viewed as potential continuation setups within a developing uptrend. The next key upside objective is the Resistance Zone around 1.1970, which aligns with previous resistance and a major supply area. This level represents a logical TP1, where partial profits can be considered and where sellers may attempt to defend the level. A clean breakout and acceptance above this resistance would confirm further bullish expansion and open the door for higher targets.
However, if EURUSD fails to hold above the support zone and breaks decisively below the rising trend line, the bullish scenario would be invalidated, and the market could rotate back into a deeper correction or range. Until such a breakdown occurs, the overall bias remains bullish, with structure favoring continuation to the upside.
That’s the setup I’m tracking. Thank you for your attention, and always manage your risk.

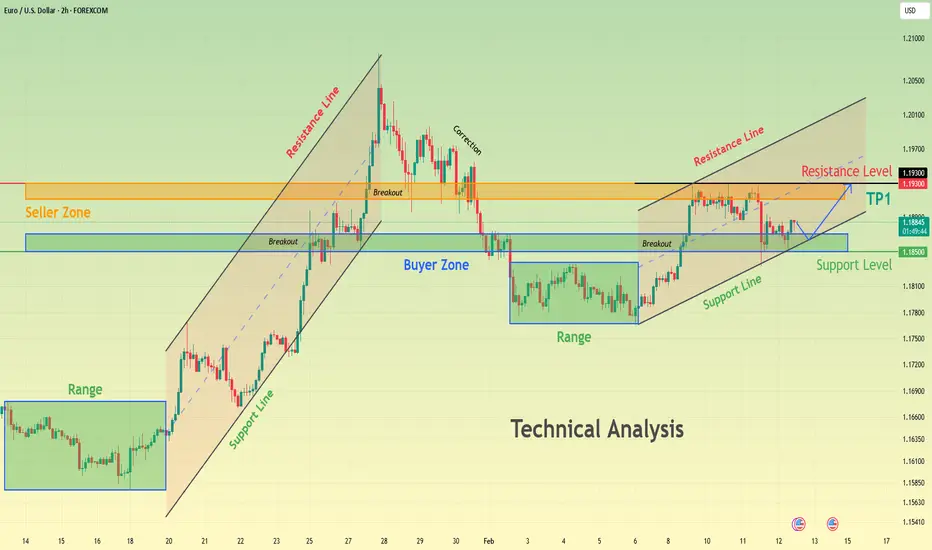
EURUSD Compressing Above Demand - Next Move IncomingHello traders! Here’s my technical outlook on EURUSD (2H) based on the current chart structure. The pair is trading within a broader bullish environment, supported by a clearly defined rising support line that has guided price higher over time. Earlier in the move, EURUSD entered a consolidation phase, forming a clean range where buyers and sellers were temporarily balanced. This range acted as an accumulation zone before a strong impulsive breakout to the upside, confirming buyer dominance and continuation of the bullish trend. Following the breakout, price accelerated aggressively and pushed into the Seller Zone / Resistance area around 1.1930, where selling pressure increased significantly. This led to a corrective pullback, as sellers defended the resistance and price retraced lower. However, the decline found support at the Buyer Zone near 1.1850, which also aligns with the broader support level and rising structure. This reaction signaled that buyers were still active and willing to defend demand, preventing a deeper breakdown and maintaining the overall bullish structure. Currently, EURUSD is consolidating above the Buyer Zone and holding above the key support level, while respecting the rising channel structure. Price action shows compression just above support, suggesting absorption of selling pressure rather than distribution. Multiple breakout attempts from this area indicate that buyers are gradually regaining control, while sellers are struggling to push price decisively below demand. This type of consolidation after a corrective move often precedes another impulsive leg higher. My primary scenario favors bullish continuation, as long as EURUSD holds above the 1.1850 Buyer Zone and continues to respect the ascending support line. A confirmed breakout and acceptance above the current consolidation would open the path toward the 1.1930 Resistance / Seller Zone (TP1), where sellers may attempt to react again. A clean breakout above this resistance would further strengthen the bullish case and signal continuation of the broader uptrend. On the other hand, a decisive breakdown below the Buyer Zone and loss of structural support would invalidate the bullish setup and shift focus toward a deeper corrective phase. For now, structure, trend, and price behavior continue to favor buyers. Please share this idea with your friends and click Boost 🚀
XAUUSD Builds Strength Above Demand - Next Target $5,190Hello traders! Here’s my technical outlook on XAUUSD (3H) based on the current chart structure. Gold is trading within a broader bullish market structure, supported by a well-defined rising trend line that has guided price higher over time. Earlier in the move, price entered a consolidation phase, forming a clear range where buyers and sellers were in temporary balance. This range acted as an accumulation zone before a strong impulsive breakout to the upside, confirming buyer dominance and continuation of the bullish trend. After the breakout, XAUUSD accelerated sharply and reached a major pivot high, where strong selling pressure entered the market. This led to a deep corrective drop, erasing a large portion of the prior rally. However, the decline stalled at a key support area near the trend line, where price sharply reversed — a clear sign that buyers were still defending the broader bullish structure. This reaction marked a structural “turnaround” rather than a full trend reversal. Currently, gold is consolidating again above the Buyer Zone and holding above the rising trend line. Price has formed another tight range just above support, indicating compression and absorption of supply. Multiple breakout attempts from this range suggest growing bullish pressure, while the market continues to respect the demand area below. This type of consolidation after a strong recovery often signals preparation for the next impulsive move. My primary scenario favors bullish continuation as long as price holds above the Buyer Zone and the ascending trend line. A confirmed breakout and acceptance above the current range would open the path toward the Resistance / Seller Zone around 5,190, which serves as TP1 and a key area where sellers may react. A clean break above this level would further strengthen the bullish case and signal continuation of the broader uptrend. On the other hand, a decisive breakdown below support and loss of the trend line would invalidate the bullish setup and shift focus toward a deeper corrective phase. For now, structure, trend, and price behavior continue to favor buyers. Please share this idea with your friends and click Boost 🚀

BTCUSDT Compression Below Resistance Signals Expansion To 71,800Hello traders! Here’s my technical outlook on BTCUSDT (4H) based on the current chart structure. Bitcoin previously traded within a well-defined range, where price respected both the upper and lower boundaries for an extended period. This consolidation phase reflected balance between buyers and sellers, with multiple reactions from range highs and lows. Eventually, price broke down from the range, signaling a loss of bullish control and the start of a corrective bearish phase. Following the range breakdown, BTC entered a descending channel, characterized by lower highs and lower lows. Price respected the falling resistance line, confirming sustained selling pressure and controlled downside continuation rather than a volatile sell-off. During this move, several corrective bounces were capped by the descending resistance, reinforcing the bearish structure. Currently, BTCUSDT is consolidating above the Buyer Zone, while also attempting to break and hold above a newly formed ascending support line. This behavior suggests that selling pressure is weakening and buyers are gradually gaining control. The recent breakout attempts from minor resistance indicate early bullish intent, although price is still capped below the key Seller Zone / Resistance near 71,800. My primary scenario favors a move higher toward the 71,800 resistance level (TP1), which aligns with the Seller Zone and previous breakdown area. A clean breakout and acceptance above this resistance would confirm a deeper recovery and potentially signal a trend shift. However, a strong rejection from the Seller Zone could lead to another pullback toward the Buyer Zone. A decisive breakdown below the 68,000 support and loss of the ascending support line would invalidate the bullish recovery scenario and open the door for renewed downside continuation. For now, BTCUSDT shows signs of stabilization after a strong drop, with buyers defending demand and price compressing below resistance — a classic setup for a potential breakout move. Please share this idea with your friends and click Boost 🚀

MU — Buy | Trend Continuation SetupBias: Bullish
Entry zone: $418.50 – $423.74
Stop-loss: $358.66
Target 1 (resistance): $455.50
Target 2 (primary): $568.10
Estimated R:R: ~1:2+ (to primary target)
Trade thesis:
MU remains in a structurally healthy uptrend with ADX (~38) confirming strong directional momentum and RSI (daily / 1h ~61–62) indicating positive but not overextended momentum. Price continues to trade above key long-term moving averages, reinforcing the continuation structure. Recent pullbacks have occurred on muted volume, suggesting orderly consolidation rather than distribution and supporting a new long entry within the defined zone. Sentiment remains constructive (broad positive semiconductor coverage and supportive demand narrative), providing an additional macro tailwind to the setup.
What to watch:
Monitor price behavior near $455.50, where participation and volume expansion should confirm continuation toward the primary target. A shift in order flow, deterioration in sentiment, or loss of structure toward the $366 support region would weaken the thesis. Under the current quieter volatility regime, upside progression may be gradual, but the combined trend strength, consolidation profile, and constructive sentiment support a bullish continuation positioning.

MANTA/USDC - quick bounce, next targets in sight?From deep discount to first resistance cleared. Speculative path toward 6–14% Fib extensions if no immediate rejection.

GOLD 13/02 – H1 ROUTE MAP | COMPRESSION BEFORE EXPANSIONAfter a strong rebound from the 44xx region at the beginning of the month, gold is entering a clear range compression phase on the H1 timeframe. The price no longer maintains continuous upward momentum, but it has not yet returned to a strong downtrend structure. Instead, the market is forming a narrowing equilibrium zone – a state that often appears before a significant liquidity expansion phase.
On the macroeconomic front, recent US economic data shows improvement in the labor market, while the CPI has not created a strong enough surprise to change monetary policy expectations. Therefore, the USD is no longer rising strongly but has not weakened clearly either. This causes gold to fluctuate strongly intraday but lacks trend commitment. The market is not reacting to news that is too bad or too good – but because there is not yet a big enough reason to reprice the structure.
Technical observation on H1 shows that the previous downtrend structure (CHoCH from the peak) is still valid on the larger timeframe. However, the recent rebound has created a triangular accumulation zone, with the upper edge around 5030–5050 and the lower edge around 4970–4900. The lower FVG zones are continuously held, indicating that support still exists, but each approach to 5050 is rejected. This reflects a supply-demand balance state, not a clear trend.
In the current context, the 5030–5050 zone acts as a confirmation zone if the price is accepted above. At that point, the rebound could extend to 5120 and beyond. Conversely, if 4970 is breached with structural acceptance, the probability of sweeping down to the 4900–4820 zone will increase. These are important confluence points between the H1 structure and the H2 liquidity zone.
LucasGray does not trade within the compression zone. The market is accumulating energy. The breakout, when it occurs, will be clear, and what we need is the price reaction at the confirmation zone, not predicting the direction beforehand.
Current bias: Neutral – waiting for a breakout above 5050 or a loss of 4970 to confirm the next structure.
— LucasGrayTrading

2Z/USDC – possible bounce from monthly low?2Z seems to have found some footing around the 0.073–0.074 zone after a sharp drop.
Looks like we're slowly building higher with a series of higher lows so far.
If this structure holds, first interesting area might be around the 1.75 fib extension (~5–6%), and maybe even 2.5 fib (~11%) if momentum picks up.
Just watching how it behaves near the dotted trendline and the 0.08 region – could be an early recovery attempt, but still very early guess.

ZKC/USDC – Possible Break & Trend ShiftPrice is testing a key level, where a potential breakout could signal a short-term trend shift to the upside. The idea is based on structure change and momentum, with targets aligned to nearby resistance zones and risk defined below the range.

ZEC/USDC – Potential Breakout & ContinuationPrice is approaching a key level, where a possible breakout and continuation to the upside may occur. The idea is based on market structure and reaction around prior resistance, with potential targets near higher liquidity zones and invalidation below the recent range.

GBP-JPY Bearish Breakout! Buy!
Hello,Traders!
GBPJPY strong displacement broke structure below horizontal supply, confirming bearish BOS. Liquidity sweep above range completed, now trading in discount with momentum. Expect continuation toward resting sell-side liquidity below.Time Frame 5H.
Sell!
Comment and subscribe to help us grow!
Check out other forecasts below too!
Disclosure: I am part of Trade Nation's Influencer program and receive a monthly fee for using their TradingView charts in my analysis.

EURJPY BEARISH BREAKOUT|SHORT|
✅EURJPY clean break below the 4H supply with strong displacement confirms bearish BOS. Price swept buy-side liquidity and left a clear FVG imbalance. Expect a minor retracement into premium before continuation toward sell-side liquidity pools.Time Frame 4H.
SHORT🔥
✅Like and subscribe to never miss a new idea!✅

EURUSD Short: Corrective Pullback Into Demand Zone 1.1850Hello traders! Here’s a clear technical breakdown of EURUSD (4H) based on the current market structure visible on the chart. EURUSD previously printed a strong impulsive bullish move that topped at a well-defined pivot high, where buying momentum began to weaken and sellers stepped in aggressively. From this pivot point, price reversed and entered a corrective bearish phase, forming a sequence of lower highs and lower lows. This decline was guided by a clean descending supply trend line, confirming controlled selling pressure rather than panic-driven liquidation. During this bearish leg, price also broke below a key rising trend line, reinforcing short-term bearish control. Eventually, the decline slowed near a lower pivot low, where selling pressure faded and buyers started to respond with strong demand. This reaction marked an important structural shift, as price began to stabilize and form higher lows, signaling that bearish momentum was losing strength. Following this pivot, EURUSD reclaimed structure with a strong bullish impulse, breaking above the descending supply trend line and confirming a change in short-term market character. After the breakout, price transitioned into a ranging phase, indicating temporary balance between buyers and sellers rather than immediate continuation. This range acted as a consolidation zone after the impulsive recovery, suggesting accumulation rather than distribution. A bullish breakout from the range confirmed renewed buyer interest and pushed price back into a higher supply area, where upside momentum has recently slowed.
Currently, EURUSD is pulling back from the Supply Zone and approaching the Demand Zone around 1.1850, which aligns closely with a rising demand trend line. This confluence makes the area a key battlefield between buyers and sellers. Price action so far suggests a corrective pullback rather than a full trend reversal, with no strong acceptance below demand yet. As long as price holds above this demand zone and continues to respect the rising trend line, the broader bullish structure remains intact.
My primary short scenario favors a move lower toward the 1.1850 Demand Zone, as long as price remains capped below the Supply Zone and fails to reclaim bullish momentum. The current pullback appears corrective, not impulsive, supporting the short continuation bias toward demand. A strong bearish reaction into 1.1850 would complete the corrective leg, where partial profits can be secured. However, a strong bullish reaction or acceptance above supply would invalidate the short idea and signal renewed upside potential. Until then, structure and price behavior favor a downside rotation into demand. Manage your risk!

XAUT: ready for the next rally? key levels to watch nowXAUT. Who said only stablecoins are for parking cash in crypto? Tokenized gold is back in the spotlight: according to market sources, safe haven flows are growing again while spot gold hangs near highs, and XAUT’s market cap is pressing right under all-time resistance.
On the 4H chart we’ve got a monster uptrend and now a tight sideways chop right under the red supply zone around 2.6B+. RSI cooled from overbought but still holds above the midline, and the volume profile shows a fat support pocket below, not much resistance above. That combo looks more like bullish consolidation than a top to me.
My base case: a clean 4H close above the 2.65B cap zone unlocks a run toward 2.75B and possibly higher ✅ Safer plan is either a breakout-retest long, or a dip buy into the first green demand near 2.50-2.45B. If that area fails, I’d watch 2.30B for a deeper pullback and admit I might be wrong, but for now bulls still drive this bus ⚠️

BIRBUSDT.P: short setup from daily support at 0.21652SETUP SUMMARY
In my opinion, BINANCE:BIRBUSDT.P may soon break out of its local accumulation. The price is testing the 0.21550 level for the third time today, and it is quite possible that the breakout will happen on this third attempt.
On the lower timeframe, each high is getting lower, and volatility remains low. We recently tested the level and are currently heading toward a near retest.
PRO-THESIS FACTORS:
trend alignment
liquidity vacuum beyond level
volatility contraction on approach
close retest
prolonged consolidation
precise level testing
price compression (Squeeze)
lack of rejection after false break Leave your thoughts on the setup in the comments. Follow this profile to monitor all upcoming ideas.

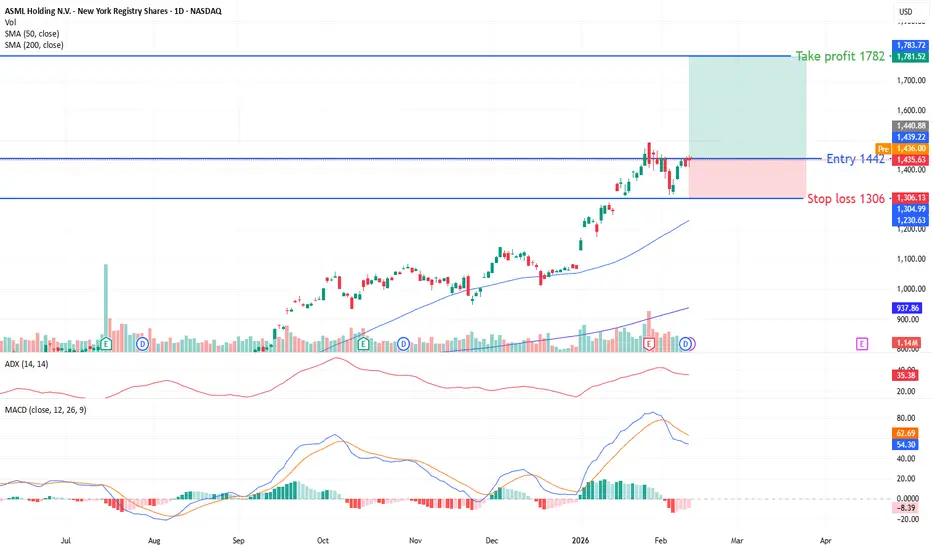
ASML — Trend Continuation Long SetupBias: Bullish trend continuation while above structural support
Buy aligned with the prevailing trend-continuation structure. The medium-term technical backdrop remains constructive: price holds firmly above the 50- and 200-day SMAs, the 4H EMA cluster continues to act as dynamic support, and ADX (~35) confirms a healthy directional environment rather than a range regime. Momentum is elevated but not overheated, with hourly and daily RSI readings signaling strength without reaching exhaustion territory.
Sentiment remains modestly positive and meets the entry threshold required for new positioning, while order-flow analysis shows no visible signs of distribution. The primary tactical consideration is participation: 1H volume has been relatively low, so any breakout attempt should be accompanied by a clear expansion in volume to validate continuation.
Key Levels
Major Support: 1316
Primary Resistance / Breakout Trigger: 1493
Trade Plan
Look for continuation entries on pullbacks holding above trend support or on confirmed breakout above 1493 with expanding volume.
Monitor ADX and participation metrics; weakening momentum or declining participation during advances would increase the probability of consolidation and require reassessment.
TATA POWER_head and shoulder break outTATA POWER recently break head and shoulder pattern,
As per pattern trade set up can be done as add with SL of 367 and target expected 400.
This is for educational purpose do not trade on basis of this.
The information provided is for educational and informational purposes only and should not be considered as financial or investment advice. Stock market investments are subject to market risks. Please conduct your own research or consult with a qualified financial advisor before making any investment decisions. I am not responsible for any losses incurred based on this information.
