NZDUSD: Downtrend ConfluenceDaily TF Observations
Price is in a clean downtrend
H1 TF Observations
Price faked out of one ascending trend line (ATL)
However, price is making a clean break below the second ATL
EMA20 is also below EMA60
Breakout

BTCUSD Technical Analysis – Is a Correction on the Way?BINANCE:BTCUSD is currently trading inside a well-defined falling wedge, and the price is pressing against the lower boundary of the pattern. This level could serve as dynamic support, and if a strong rejection occurs, we may see a corrective move toward the 102,000 resistance area.
If sellers successfully defend that zone, the bearish structure remains intact, increasing the likelihood of BTCUSD moving back down to lower price levels. However, if price breaks above this resistance, a deeper correction toward the upper boundary of the wedge could unfold.
At this stage, closely monitoring candlestick signals and volume activity around this key area is essential for spotting high-quality selling opportunities. Ensure every trade setup is backed by solid confirmation, and always maintain strict risk management.
If you have any thoughts or additional perspectives on this setup, I’d be happy to hear them. Feel free to share your opinion in the comments!

A High-Impact Support Zone Meets a Breakout StructureIntroduction
Markets occasionally compress into areas where structure, momentum, and historical buying pressure align with surprising precision. When that compression occurs at a major higher-timeframe floor, traders often pay closer attention—not because the future is predictable, but because the chart reveals a location where price behavior typically becomes informative.
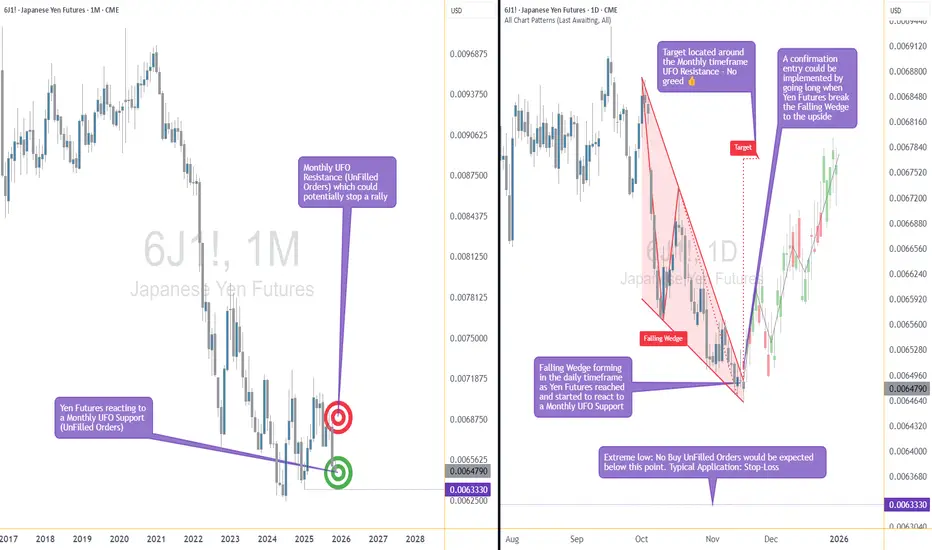
The current case study centers on a market pressing into a high-impact support zone visible on the monthly chart, while the daily chart displays a falling wedge pattern that has gradually narrowed the range of movement. This combination often highlights moments where the auction process is nearing a decision point. The purpose here is to dissect that confluence using multi-timeframe structure, pattern logic, and broad order-flow principles—strictly for educational exploration.
Higher-Timeframe Structure (Monthly)
The monthly chart shows price approaching a well-defined support area between 0.0065425 and 0.0063330, a region that has acted in the past as a base for significant reactions. These areas often develop because markets rarely absorb all buy interest in a single pass; pockets of unfilled orders may remain, leading to renewed reactions when price returns.
This type of zone does not guarantee a reversal. However, historically, when price reaches such levels, traders tend to monitor whether selling pressure slows or becomes less efficient. In this case, the structure suggests a recurring willingness from buyers to engage at these prices, forming a foundation that has held multiple swings.
The presence of a clear, higher-frame resistance at 0.0067530 anchors the broader range. When price rotates between such boundaries, the monthly context often acts as a roadmap: major support below, major resistance above, and room in between for tactical case-study exploration.
Lower-Timeframe Structure (Daily)
Shifting to the daily chart, price action has carved a falling wedge, a pattern often associated with decelerating downside movement. In wedges, sellers continue to push price lower, but with diminishing strength, as each successive low becomes less effective.
This type of compression structure can provide early evidence that the auction is maturing. Traders studying such patterns often watch for:
tightening of the range,
shorter waves into new lows,
initial signs that buyers are defending intraday attempts to drive price lower.
The daily wedge in this case sits directly on top of the monthly support zone—an alignment that strengthens its analytical relevance. The upper boundary of the wedge sits near 0.0065030, and a break above that line is often interpreted as price escaping the compression phase.
Multi-Timeframe Confluence
Multi-timeframe confluence arises when higher-frame structure provides the background bias and lower-frame patterns offer the tactical trigger. In this case:
The monthly chart signals a historically responsive support zone.
The daily chart shows structural compression and slowing downside momentum.
The interaction between them creates a scenario where educational case studies tend to focus on breakout behavior, as the daily timeframe may provide the first evidence that higher-frame buyers are engaging.
This confluence does not imply certainty. It simply highlights a location where structure tends to become more informative, and where traders often study the transition from absorption to response.
Order-Flow Logic (Non-Tool-Specific)
From an order-flow perspective, strong support zones typically develop where prior buying activity left behind unfilled interest. When price returns to that region, two things often happen:
Sellers begin to encounter difficulty driving price lower, as remaining buy orders absorb their activity.
Compression patterns form, as the market oscillates in a tightening range while participants test whether enough liquidity remains to cause a directional shift.
A breakout of the daily wedge represents a potential change in the auction dynamic. While sellers are still active inside the wedge, a breakout suggests their pressure may have become insufficient to continue the sequence of lower highs and lower lows. Traders studying market transitions often use such moments as part of hypothetical scenarios to understand how imbalances evolve.
Forward-Looking Trade Idea (Illustrative Only)
For educational purposes, here is how a structured case study could frame a potential opportunity using the discussed charts:
Entry: A hypothetical entry could be placed above the falling wedge, around 0.0065030, once buyers demonstrate the ability to break outside the compression structure.
Stop-Loss: A logical invalidation area in this case study would be at or below the monthly support, around 0.0063330, where failure would indicate the higher-timeframe zone did not hold.
Target: A purely structural wedge projection would suggest a target near 0.0067695, aligning closely with the broader resistance region on the monthly chart.
These price points yield a reward-to-risk profile that is measurable and logically linked to structure, though not guaranteed. This case study exists solely to illustrate how support-resistance relationships and pattern logic can be combined into a coherent, rules-based plan, not as an actionable idea for trading.
Yen Futures Contract Context
The larger (6J) and micro-sized (MJY) versions of this futures market follow the same underlying price but differ in exposure and margin scale. The standard contract generally carries a greater notional value and therefore translates each price movement into a larger monetary change. The micro contract mirrors the same structure at a reduced size, allowing traders to adjust position scaling more precisely when navigating major zones or breakout structures such as the one discussed in this case study:
6J equals 12,500,000 Japanese Yen per contract, making it suitable for larger, institutional players. (1 Tick = 0.0000005 per JPY increment = $6.25. Required Margin = $2,800)
MJY equals 1,250,000 Japanese Yen per contract, making it suitable for larger, institutional players. (1 Tick = 0.000001 per JPY increment = $1.25. Required Margin = $280)
Understanding margin requirements is essential—these products are leveraged instruments, and small price changes can result in large percentage gains or losses.
Risk Management Considerations
Strong support zones can attract interest, but risk management remains the foundation of any structured approach. Traders studying these transitions typically:
size positions relative to the distance between entry and invalidation,
maintain clear exit criteria when structure fails,
avoid adjusting stops unless the market has invalidated the original reasons for the plan,
adapt to new information without anchoring to prior expectations.
These principles emphasize the importance of accepting uncertainty. Even at major support zones, markets can remain volatile, and scenarios may unfold differently than anticipated.
When charting futures, the data provided could be delayed. Traders working with the ticker symbols discussed in this idea may prefer to use CME Group real-time data plan on TradingView: www.tradingview.com - This consideration is particularly important for shorter-term traders, whereas it may be less critical for those focused on longer-term trading strategies.
General Disclaimer:
The trade ideas presented herein are solely for illustrative purposes forming a part of a case study intended to demonstrate key principles in risk management within the context of the specific market scenarios discussed. These ideas are not to be interpreted as investment recommendations or financial advice. They do not endorse or promote any specific trading strategies, financial products, or services. The information provided is based on data believed to be reliable; however, its accuracy or completeness cannot be guaranteed. Trading in financial markets involves risks, including the potential loss of principal. Each individual should conduct their own research and consult with professional financial advisors before making any investment decisions. The author or publisher of this content bears no responsibility for any actions taken based on the information provided or for any resultant financial or other losses.
EURUSD Long: Buyers Targeting a Move Toward 1.1670 ResistanceHello traders! EURUSD is maintaining a bullish structure after rebounding from the Demand Zone at 1.1600–1.1610, where buyers consistently stepped in to defend support. This area also aligns with the Demand Line of the ascending channel, making it a key decision point for the current uptrend. Earlier, the pair formed a Rounding Top near the 1.1650–1.1670 Supply Zone, which triggered a downside breakout and a short-term correction. Once price reached the pivot point around 1.1530, buyers regained control and initiated a steady recovery, forming a clean ascending channel.
Currently, EURUSD is approaching the Supply Zone at 1.1650–1.1670, which also aligns with the Supply Line of the channel — creating a strong confluence resistance area. A breakout above this zone would confirm bullish continuation toward the next major liquidity cluster. As long as the pair holds above the Demand Line, the bullish structure remains intact. A minor pullback toward the 1.1610–1.1620 Demand Zone would be considered a healthy correction within the trend.
My scenario as long as EURUSD stays above 1.1600–1.1610, buyers remain in control and the bullish channel is valid. The primary upside target is 1.1670, which serves as both a Supply Zone and a key structural resistance. A confirmed breakout above 1.1670 would signal continuation toward higher levels and mark a shift into a stronger bullish phase. If the pair rejects the Supply Zone, a pullback toward 1.1620–1.1600 is likely, where buyers may re-enter. A break below 1.1600 would weaken the bullish outlook and open the path toward deeper correction. For now, the market favors buying pullbacks while holding above demand. Manage your risk!

EURUSD: Breakout Structure Supports Move Toward 1.1650Hello everyone, here is my breakdown of the current Euro setup.
Market Analysis
EURUSD is showing a clear bullish shift after breaking out of multiple downward structures and reclaiming higher support levels. The chart highlights several key phases: a prolonged decline inside two consecutive Downward Channels, followed by confirmed breakouts, each signaling weakening bearish momentum. After the second downward channel breakout, EURUSD established a stable bullish structure, forming an ascending move supported by the Triangle Support Line. Price has been consistently creating higher lows along this line, indicating strong buyer presence.
Currently, EURUSD retraced back toward the Triangle Support Line after being rejected from the major Resistance Area around 1.16500. This zone has acted as a key supply region multiple times, and it also aligns with the Triangle Resistance Line, making it a significant confluence area. As long as price remains above the ascending support, the bullish structure stays intact. The overall market behavior shows healthy correction patterns followed by breakouts, suggesting that buyers remain in control, with momentum gradually building toward the upper resistance once again.
My Scenario & Strategy
I expect price to rebound from the current correction zone and attempt another move toward the 1.16500 Resistance, which is the next major decision point. A successful breakout above 1.16500, followed by consolidation, would signal a bullish expansion and could open the path toward higher targets in the coming sessions.
However, if EURUSD breaks below the Triangle Support Line, the current bullish structure would weaken, and price may return to lower support areas before buyers attempt another recovery. For now, structure remains bullish, and pullback-based long entries continue to offer the best opportunity while price respects the rising support trendline.
That's the setup I'm tracking. Thank you for your attention, and always manage your risk.

XAUUSD Buyers Step In — Market Aiming for $4,140 RetestHello traders! Let’s take a look at XAUUSD (Gold). XAUUSD maintains a bullish structure after bouncing from the key $4,050–$4,060 support zone, where price also retested the ascending trendline. After breaking out of the descending channel, Gold formed a new accumulation zone and moved higher, approaching the strong $4,140 resistance level. The price is now trading between the ascending support and the local supply zone near $4,140, forming a tightening structure. A breakout above this level could open the way for further upside, while a rejection may trigger a correction back toward $4,060. As long as XAUUSD holds above $4,060 and the ascending trendline, a renewed move toward $4,140 remains likely, with potential for a breakout. Please share this idea with your friends and click Boost 🚀

BTCUSD Rebounds From Buyer Zone — Correction Toward $101KHello traders! Let’s take a look at BTCUSD (Bitcoin). After an extended bearish phase inside a broad descending channel, price consistently respected both the resistance and support lines, forming a clear series of lower highs. Each touch of the descending resistance line resulted in a Turned Around reaction, confirming strong seller control throughout the structure. Earlier, Bitcoin broke below its local support area, initiating a deeper correction toward the major Support Level near $96,000. This zone aligns with the lower boundary of the descending channel and historically served as a strong reaction area for buyers. Recently, BTCUSD reached the bottom of the structure and is now showing early signs of a potential pullback. Price is attempting to rebound from the Buyer Zone, aiming toward the nearest resistance cluster around $100,800–$101,600, which also forms the lower boundary of the Seller Zone. This level previously acted as support and is now expected to serve as a strong retest area. As long as price remains below the descending resistance line, the overall trend stays bearish. A short-term bullish correction toward TP1: $101,600 remains possible, especially if buyers maintain control above the $96,000 support. However, if BTC fails to break above the Seller Zone, sellers may step in again, potentially pushing the price back toward the major support and even extending the downtrend. A confirmed breakout above the descending resistance would invalidate the bearish scenario and open the door for a stronger recovery. Please share this idea with your friends and click Boost 🚀

XAUUSD Long: Ascending Channel Targets Retest of $4,230 SupplyHello traders! XAUUSD has recently shown a clear bullish recovery structure after forming a strong base within the Demand Zone around $4,120–$4,130, where price previously reacted multiple times. This area also aligns with the lower boundary of the Ascending Channel, confirming it as a key decision point for buyers. Earlier, Gold formed a Double Top pattern near the $4,230–$4,240 zone, which acted as a pivotal Supply Area and triggered a sharp correction. Following that, the market produced two notable fake breakouts below support — liquidity sweeps that failed to establish a bearish continuation. Each failed breakdown was followed by strong buying pressure, signaling active demand.
Currently, after touching the Fibonacci Pivot Point, price reversed and re-entered the Ascending Channel, where bulls regained control. The current movement shows Gold pulling back from the Supply Line near $4,200–$4,230, suggesting that sellers are defending this zone, but the overall structure still favors buyers as long as the price remains above the channel support. At the moment, XAUUSD is approaching the confluence area between the Supply Zone ($4,200–$4,230) and the Supply Line, which represents a major reaction level. A clean breakout above this region would confirm bullish continuation, while a rejection could trigger another correction back toward the Demand Zone.
My scenario as XAUUSD holds above the $4,120–$4,130 Demand Zone, the bullish structure remains intact. The next upside objective sits around $4,200–$4,230, where both the Supply Line and key resistance meet. A successful breakout and close above $4,230 would confirm bullish continuation, opening the door for a move toward $4,260–$4,280 in the short term. However, if price rejects the supply area, a pullback toward $4,150–$4,130 is possible — an area where buyers may re-enter. A break below $4,120 would invalidate the bullish scenario and signal deeper correction toward $4,080–$4,060. For now, the structure favors buying pullbacks within the ascending channel, as long as price remains above key demand. Manage your risk!

EURUSD Breaks Channel Resistance — Rally Toward 1.1660 in FocusHello traders! Let’s analyze the current EURUSD market structure. After an extended downtrend within a descending channel, the pair has recently shown the first signs of potential bullish reversal. Throughout the decline, price consistently respected the resistance line of the channel, making lower highs and lower lows. However, buyers have now stepped in strongly near the 1.1500–1.1530 Buyer Zone, which coincides with both the horizontal Support Level and the lower boundary of the previous structure — confirming it as a major demand area. Following a fake breakout below this support, EURUSD quickly recovered, forming a turnaround pattern and breaking above the descending resistance line. This move indicates that sellers are losing control while bullish momentum is gradually building. The pair has now established a short-term ascending structure, where price is developing higher highs and higher lows. Currently, EURUSD is retesting the breakout zone near 1.1580, which acts as dynamic support inside the new bullish channel. As long as the pair holds above this level, the outlook remains constructive, and buyers could push the price higher toward TP1 at 1.1660, which represents a key Resistance Level and former Seller Zone. A confirmed breakout above 1.1660 would reinforce the bullish bias and open the door toward the next resistance area near 1.1720. On the other hand, a rejection from this level might trigger a temporary pullback back to the 1.1580–1.1550 Buyer Zone before a new upward wave emerges. Overall, the structure has shifted from bearish to bullish, with the ascending Support Line now serving as a key level for maintaining the positive outlook. Please share this idea with your friends and click Boost 🚀

BTCUSD: Bulls Defend $102K Zone — Eyeing Breakout Toward $107KHello everyone, here is my breakdown of the current Bitcoin setup.
Market Analysis
BTCUSD is trading within a well-defined triangle formation after a period of volatile movements between $102,500 and $107,000. The chart shows that price recently rebounded from the Triangle Support Line, aligning with the $102,000–$103,000 Support Zone, where buyers have consistently stepped in to defend this level. This zone has acted as a strong accumulation area, confirmed by multiple bounces and rejection wicks signaling absorption of selling pressure.
Currently, after a fake breakout to the downside, BTCUSD quickly recovered, retesting the Resistance Zone near $105,000–$105,500, which also aligns with the Triangle Resistance Line. This confluence area represents the next key reaction point. A confirmed breakout above this resistance would indicate a potential continuation of the broader bullish trend, while a rejection here could lead to a short-term correction back toward the support base. The market behavior shows constructive consolidation, with higher lows forming along the support trend line — a sign that buyers are gradually regaining control. As long as BTCUSD remains above $102,000, the short-term structure favors further upside movement within the triangle, aiming toward the $106,500–$107,000 resistance area.
My Scenario & Strategy
As long as Bitcoin holds above the $102,000–$103,000 Support Zone, the bullish outlook remains valid. The first upside objective (TP1) is the $106,500–$107,000 Resistance Area, where traders should watch for potential rejection or breakout signals. A confirmed breakout and close above $107,000 could trigger an extension toward $109,000–$110,000, aligning with the upper boundary of the triangle and the previous reaction zone.
However, if BTCUSD fails to hold above $102,000, this would invalidate the bullish scenario and open the way for a deeper pullback toward $100,000–$99,000, where fresh buying interest may emerge. For now, the structure supports buying pullbacks while price remains above the ascending Triangle Support Line, as momentum continues to favor the bulls.
That's the setup I'm tracking. Thank you for your attention, and always manage your risk.

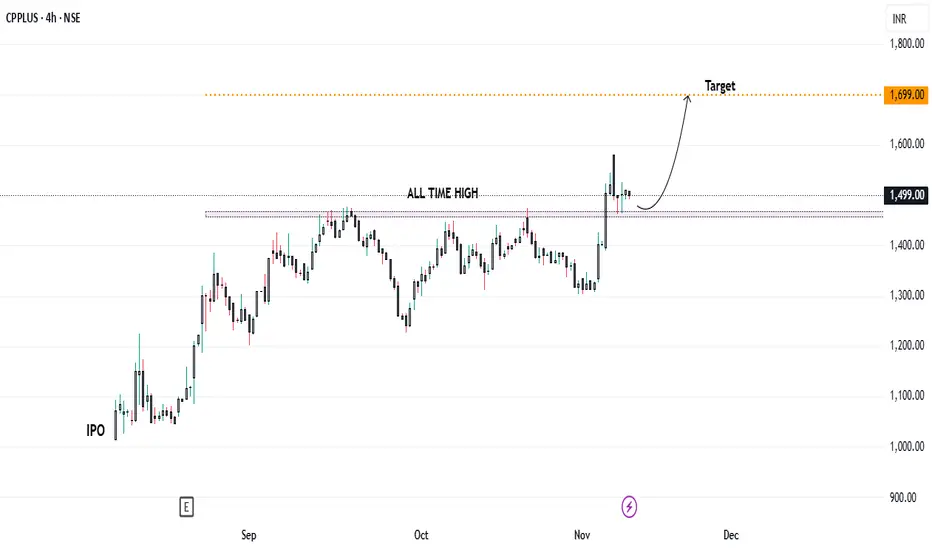
Aditya Infotech: Breakout Retest in Action — Next Stop ₹1700...?Aditya Infotech, one of the newly listed stocks, has delivered an impressive breakout above its all-time high, showcasing strong bullish momentum and renewed investor interest. After this sharp rally, the stock is now retesting the ₹1470 zone, which earlier acted as a key resistance level and could now flip into a strong support area.
If Aditya Infotech sustains above ₹1470 for a day, it would signal a successful breakout retest, potentially setting the stage for the next leg of the rally towards ₹1700.
📈 Trading Setup:
* Buy Zone: Above ₹1470 (post-sustainability confirmation)
* Target: ₹1700
* Stop-Loss: ₹1390–₹1395
The structure remains bullish, and a bounce from the current level could attract fresh momentum traders. A strong close above ₹1470 would further validate the breakout and indicate that the bulls are firmly in control.
XAUUSD Retests Resistance — Pullback Toward $4,060 SupportHello traders! Let’s take a look at XAUUSD (Gold). After a prolonged bullish movement within a well-defined ascending channel, price reached a significant Resistance Level near $4,200, where sellers stepped in to regain control. This resistance coincides with the upper boundary of a descending resistance line, confirming its importance as a reaction area. Following this rejection, Gold experienced a sharp correction, forming a Range structure near the top before breaking below it — marking a shift in short-term sentiment. The breakout from this range confirmed the beginning of a downward phase, where price continued to move inside a new descending pattern. Currently, XAUUSD is testing the resistance line once again after a breakout retest from below. This area aligns with a former pivot zone where several reversals occurred in the past. The overall structure suggests that buyers are losing momentum, while sellers are preparing to defend this key zone. As long as price remains below the $4,160–$4,200 resistance, a corrective pullback toward the $4,060 Support Level (TP1) looks likely. This area also aligns with the ascending support line, which may act as the next major decision point. A clean break below $4,060 could extend the decline toward the $3,950–$3,970 zone, while a confirmed breakout above $4,200 would invalidate the short scenario and potentially trigger another bullish continuation phase. Please share this idea with your friends and click Boost 🚀

USDCAD WEDGE BREAKOUT|LONG|
✅USDCAD broke out of a bullish wedge, signaling a potential continuation toward higher imbalance zones above 1.4050$. Liquidity resting above equal highs could be targeted next. Time Frame 4H.
LONG🚀
✅Like and subscribe to never miss a new idea!✅

EURUSD Long: Bullish Momentum Targets $1.1610 Supply ZoneHello traders! EURUSD is currently showing signs of sustained bullish momentum after rebounding from the key 1.1550 Demand Zone, which has previously acted as a strong support area. Earlier, the pair formed a Double Bottom pattern, indicating exhaustion of selling pressure and the beginning of accumulation. This bullish structure was later confirmed by a breakout above neckline resistance, suggesting a potential reversal in trend. Following a series of breakouts and a fake breakout, EURUSD established an Ascending Channel, showing consistent higher highs and higher lows — a clear signal of an emerging bullish trend. The recent pivot point around 1.1540 served as a solid foundation for price recovery, where buyers regained control.
Currently, EURUSD is heading toward the 1.1610 Supply Zone, which coincides with a previous reaction level and marks the next key resistance to watch. A confirmed breakout and close above 1.1610 could open the path for further movement toward the 1.1660–1.1680 region, extending the bullish structure.
I expect, as long as price holds above 1.1550, the bullish scenario remains intact. However, a decisive breakdown below this support zone could invalidate the upward momentum and trigger a deeper retracement toward the previous demand levels. Manage your risk!

XAUUSD Short: Rejection From Supply Targets $4,070 Demand LineHello traders! Gold (XAUUSD) is showing signs of a potential corrective move after a strong bullish rally from the $3,950–$3,970 Demand Zone, where multiple fake breakouts confirmed the presence of strong buyers. This area coincides with the ascending Demand Line, which has provided consistent support for price growth. Each touch on this line has led to notable bullish impulses, signaling accumulation and strengthening buyer momentum.
Currently, the price approached the $4,140–$4,160 Supply Zone, which aligns with both a Supply Line and the neckline of a previous Double Top pattern. This confluence area represents a critical resistance zone where sellers have historically regained control. The current rejection from this level suggests that a short-term pullback could be underway as the market seeks to retest lower support.
I expect the first key area to watch is the $4,070 pivot level, which aligns with the Demand Line. This zone is expected to act as dynamic support for a potential rebound. If price holds above this level, the bullish structure remains valid, with a possible retest of the $4,150–$4,160 Supply Zone. However, a confirmed break below $4,070 could trigger a deeper correction toward the $3,950 Demand Zone, where fresh buying opportunities may emerge. Manage your risk!

CAD/JPY: Multiple Time Frame Analysis & PlanFollowing a breakthrough of a significant daily structural resistance yesterday.
📈CADJPY is currently consolidating within a horizontal range on an hourly timeframe.
For those seeking an intraday buying opportunity, a bullish breach of the range's resistance, specifically an hourly candle closing above 110.65, would provide a strong bullish confirmation.
A subsequent bullish continuation would then be anticipated, at least to the 111.00 level.

NZD/USD: Move UP is Expected!The 📈NZDUSD price formed an inverted head and shoulders pattern and violated its neckline after the London session opening on a 4H time frame.
With a high probability, the price will continue rising and reach the 0.5667 level soon.

EURUSD: Descending Channel Breakout Targets 1.1630 ResistanceHello everyone, here is my breakdown of the current Euro setup.
Market Analysis
EURUSD is showing early signs of a potential bullish reversal after a prolonged downtrend within a descending channel. The pair found strong buying interest near the 1.15300–1.15400 Support Zone, an area that previously acted as a key pivot level where price frequently rebounded. This zone aligns with the ascending Support Line, forming a solid confluence for a possible trend reversal setup. After several tests of the lower boundary, EURUSD successfully broke above the descending channel, indicating a potential shift in market sentiment from bearish to bullish. Price is now consolidating above the broken resistance line, showing accumulation and confirming buyer strength. The pair is approaching the 1.16100–1.16300 Resistance Area, which has acted as a major supply zone and a decision point for further upside continuation.
Currently, as long as the price holds above 1.15300 support, the bullish outlook remains valid. A successful breakout and sustained move above 1.16300 could confirm a structural reversal, opening the door for further growth toward 1.17000 in the medium term. Conversely, a bearish rejection from resistance may trigger a short-term pullback toward the Support Line before another attempt higher.
My Scenario & Strategy
From my perspective, as long as EURUSD trades above 1.15300, I remain bullish-biased. My near-term target (TP1) is set around the 1.16100–1.16300 zone, with a potential extension toward 1.17000 if momentum continues. I will be looking for pullback-based long entries near support or retests of the breakout level.
However, if EURUSD breaks back below 1.15300, this would invalidate the bullish scenario and suggest a continuation of the broader downtrend. For now, structure and price action support a bullish correction setup toward resistance.
That's the setup I'm tracking. Thank you for your attention, and always manage your risk.

BTCUSD Bulls Aim Higher: Buyers Eye Breakout Toward $107,500Hello traders! Let’s take a look at the current BTCUSD structure. After an extended corrective phase within a descending movement, the market found solid support near the $100,000–$100,200 Buyer Zone, which aligns with both the horizontal Support Level and the lower boundary of the broader structure. This zone has repeatedly triggered strong buying reactions in the past, confirming it as a key demand area. Recently, Bitcoin began forming a bullish correction channel, where price has been developing higher highs and higher lows, suggesting early signs of trend recovery. Within this structure, buyers successfully defended the Buyer Zone, followed by a steady rise toward the $107,000–$107,500 Resistance Level — a zone that previously acted as a Seller Zone during prior rejections. At the moment, BTCUSD is consolidating inside this ascending channel, trading slightly below resistance. The market may attempt another push toward TP1 at $107,500, which aligns with the upper resistance line and marks a potential short-term target. If price manages a confirmed breakout above this level, we could see further continuation toward the next resistance around $111,000. However, if the price faces rejection at the current resistance, a temporary pullback toward the Support Line or Buyer Zone ($100,200–$101,000) could occur before the next wave of growth. The structure remains bullish as long as Bitcoin stays above the ascending Support Line. Please share this idea with your friends and click Boost 🚀

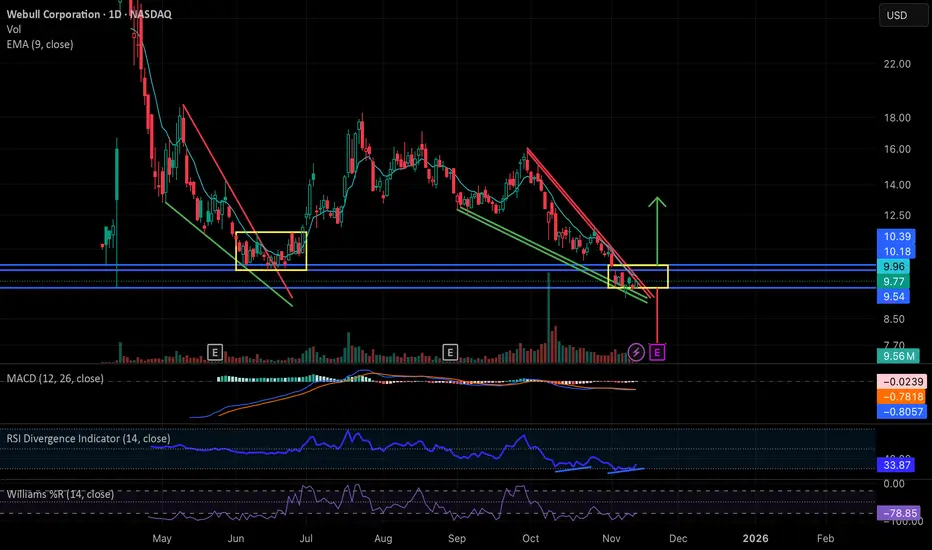
Webull: Falling Wedge Breakout ImminentNASDAQ:BULL has been in a steady decline essentially since the start of the government shutdown, forming a clean falling wedge structure very similar to the setup we saw in May and June. Back then, the wedge resolved with a brief breakout but ultimately moved into a sideways consolidation inside the yellow range before finally lifting in late June/early July.
Price is now sitting at the apex of a new wedge right as the government has officially reopened, almost to the day. With the president signing the bill, this may act as a macro green light for liquidity into year end, and BULL is positioned to potentially benefit from that.
Technically, the stock is deeply beaten down (roughly 40 percent from pre-shutdown levels), the MACD is starting to curl up, and there’s a clear daily RSI divergence. Together, these conditions make a relief move or breakout increasingly plausible.
If we don’t get a meaningful directional move between now and earnings on 11/20, then the most likely scenario is a replay of the May/June pattern: a period of sideways chop inside its current established support and resistance band zone around 9.54-10.18/10.39 while the market waits for the earnings catalyst. That report would then determine the next substantial move up or down.
In short: BULL is at a technical decision point, with momentum indicators improving, macro pressure easing, and earnings close enough that either a near-term wedge break or a consolidation-before-catalyst are both reasonable outcomes from here.
GBPUSD: Testing Daily HTLKey Observations
- On the D1 TF, price is in a downtrend; however, it's currently testing a key HTL
- If price is able to hold below this level, this is a good indication of keeping my bearish bias
- However, the bullish daily bars is not a great sign for downside strength
- ATL had to be drawn multiple times, which is signaling a weaker price action and a point of concern for the downtrend strength

NZD-USD Bearish Wedge! Sell!
Hello,Traders!
NZDUSD formed a bearish wedge structure and broke its lower boundary, hinting at bearish continuation toward the next liquidity level resting below. Time Frame 4H.
Sell!
Comment and subscribe to help us grow!
Check out other forecasts below too!
Disclosure: I am part of Trade Nation's Influencer program and receive a monthly fee for using their TradingView charts in my analysis.

GOLD STRONG BREAKOUT|LONG|
✅XAUUSD executed a clean market structure shift after accumulating below discount. With a strong displacement candle, bulls target premium inefficiency toward the next liquidity pocket. Time Frame 4H.
LONG🚀
✅Like and subscribe to never miss a new idea!✅
