3rd Time May Be The Charm For UJ BearsHere on FX:USDJPY price seems to be working into a Consolidation in the form of a Descending Triangle Pattern after making contact with a strong Resistance Level!
Since the High created on Nov. 20th @ 157.893, price has been falling into a Support Level creating Equal Lows with a Lower High formed on Dec. 10th @ 156.937.
This Lower High creates a Falling Resistance that price seems to be having a strong reaction to!
If price continues to rise from the Support level, we can expect a 3rd test of the Falling Resistance.
Fundamentally, with the Federal Reserve having made a 25 basis point Cut to Interest Rates going from 4% to 3.75% and the BOJ looking to potentially Hike Interest Rates from .5% to .75%, this could strengthen the Bearish scenario and the formation of the Descending Triangle.
Breakoutandretest

GA Forms Strong Bullish ReversalHere on OANDA:GBPAUD , price has formed an Inverse Head and Shoulders Pattern.
Price currently at time of publishing has completed the Right Shoulder and the 3rd touch of the Neckline or Confirmation of Pattern.
Once Price makes a Breakout of the Neckline, this will generate Long Opportunities a Breakout and Retest scenario to take price on this pair up to the next Resistance Level @ 2.0363 - 2.0394.

Is EG Ready To Drop A Shoulder??Here I have OANDA:EURGBP on a Multi-Timeframe Chart Analysis.
Chart Patterns that are clearly seen through multiple timeframes builds the validity of the scenario and the 4 Hr and Daily Charts seem to be forming a potential Bullish Reversal pattern, the Inverse Head and Shoulders!
Last week we can see on the Weekly Chart that price had come back down to the Previous Resistance Level that was broken out of in October and found Support.
On the 4Hr and Daily Charts we can see last week ended with a 2nd touch of the Neckline or Confirmation of Pattern.
Now if price is putting in a reversal pattern, we still need to see the Right Shoulder form. Pattern is Invalidated if price breaks below the Left Shoulder.
Pattern is Confirmed after price is supported at Left Shoulder level and makes 3rd Neckline touch.
Fundamentally this week will be very heavy for EUR and GBP so stay vigilant!!

Consolidation on GA ExpandsOANDA:GBPAUD has been forming an Expanding Range!
The Expanding Range is a Consolidation phase that consists of Rising Resistance and Falling Support.
At the time of publishing, the Bulls have made a Breakout of the Rising Resistance. If price retests the breakout and is supported, this will generate Long opportunities!
Wait for a Retest!!

Double Top Formed After 88.6% Retracement on AJHere on the Hourly chart, OANDA:AUDJPY has formed a Bearish Reversal Pattern, the Double Top.
Price attempted to make a Higher High but was cut short by the 88.6% Fibonacci level where we now see price dropped back down to the Confirmation or "Neckline" of the Pattern @ 103.836.
Once the Confirmation is broken, this will generate Short Opportunities to take price down to the next Support Level @ 103.344 - 103.198!

Somebody Order A EG Pennant Sandwich?!Here on the Hourly Chart for OANDA:EURGBP we can see price has made quite a Consolidation.
Since Thursday last week we can see price has been pinballing back and forth between a Horizontal Resistance @ .8748 - .8754 and Support @ .8724 - .8721
Currently price has been working into Lower Highs and Higher Lows forming a Pennant Pattern right in the middle of this Consolidation.
Once price breaks either the Falling Resistance or Rising Support, this will generate a Breakout and Retest opportunity!
Then prices next move will be to either the Overhead Resistance or Underlying Support!

EJ Bulls Break 4Hr PennantHere on OANDA:EURJPY price has formed a Pennant Pattern!
Pennants can break either Bullish or Bearish but today Bulls gave us a Breakout of the Falling Resistance.
This could generate Long Opportunities on the pair as a Breakout and Retest scenario!
If price is successfully rejected out of the pattern, we can expect price to make a retest of that break to then push price higher!

EU's Consolidation ExpandsHere on FX:EURUSD we can see that Price has been trading between a Rising Resistance and Falling Support or Higher Highs and Lower Lows.
This forms an Expanding Range!
Currently the range is between:
- High: 1.16232
- Low: 1.15912
Until we get a clear cut Breakout of either leg, this Price Action will remain in a battle of Tug-O-War between Bears and Bulls.
*The Breakout will need to be accompanied by a large amount of volume to verify!
Fundamentally, both EUR and USD have impactful news coming out this week with the ECB recently stating they could be at the end of their easing cycle with cuts and the Federal Reserve looking at an 87% chance of another Interest Rate Cut at the Dec. 10th meeting.
Stay vigilant!

"Heads Down" With Hopes Up For EUFX:EURUSD seems to have found Support at a Weekly Low formed earlier this month.
Now, since having visited this Support, you can notice that price has begun to form a Higher Low suggesting that price action is forming a strong bullish reversal pattern, the Inverse Head and Shoulders!
If price can continue pushing higher to the Neckline once more, this will complete the reversal pattern.
Once the pattern is complete, we will want to wait for a Breakout and Retest to generate potential long opportunities to take the price up to test the overhead resistance levels.

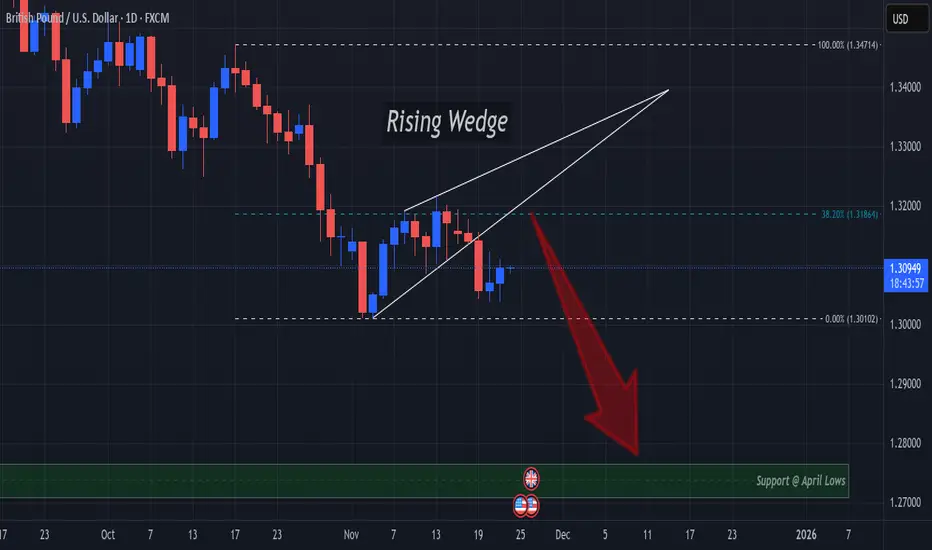
Rising Wedge Breakout Spells Decline Continuation For GUFX:GBPUSD delivered a Breakout of A Rising Wedge to end the week last week!
Next, we should suspect a Retest of this Breakout @ the 38.2% Retracement level around 1.31864.
This level proved to hold price below it through the formation of the pattern and would serve as a great area of opportunity to short the pair and ride Price down!
If the Retest of the Breakout is successful, Price would next find Support at the April Lows around the 1.28 - 1.27 area!
Fundamentally its a heavy week for USD with events for GBP littered throughout so keep a close eye on how the results end up affecting the markets!
GU Could Aim For Higher Prices After Strong Reversal FormsHere on FX:GBPUSD we can see Price on the 4Hr Chart has formed an Inverse Head and Shoulders Pattern!
This is a Bullish indication that Price could be looking to Reverse and start moving higher!
Now the Pattern has been formed and a Valid Breakout has been made, the only thing left is for a Proper Retest of the Breakout!
Currently Price is working down after making the Breakout and once a successful Retest is made in the 1.3140 - 1.3135 range, we should see Price start to work up.
If the Breakout and Retest is correct, I suspect Price will make a break for the next layer of Resistance shown at the next Swing High of 1.33969.

DXY Has 99 Problems, Getting Above 100 Is One!Here we have TVC:DXY on the Weekly Chart.
Now clearly outlined we can see there is a very valuable level here @ 99-100 that the USD:
- Used as Resistance from 2015 til the Bullish Breakout in April 2020
- Used as Support from 2023 til the Bearish Breakdown in April 2025
Fundamentally is a very sketchy scenario because with the Shutdown causing lack of important data needed, The Federal Reserve is making Interest Rate cuts. This weakens the Dollar because it makes it less favorable to Foreign Investing.
On the flip side, Consumers Dollars are able to stretch further allowing them to purchase more but unfortunately we still combat the inflated prices on goods. Companies have the ability to get there raw ingredients cheaper, resume hiring processes, etc.
The slow creeping rise in Inflation has the Federal Reserve in a position to want to be ready to potentially Hike Rates when the Inflation, they believe, from the Tariffs will hit but as of yet, the recent CPI numbers came out not as hot as they thought, possibly playing into the reason for making the latest cut.
Nevertheless, by the last FOMC meeting, it would seem that there is a chance that was the last cut this year that may be made, if:
- Inflation continues to rise
or
- Continued softening labor market

EURGBP Aiming For 2023 Highs Or 2024 Lows?!?Here on OANDA:EURGBP , Price has been ranging relatively closely for the past couple months which seems to have begun to form an Ascending Triangle underneath a potentially strong Resistance Zone that formed Fall of 2023!
Now Ascending Triangles, over time, continue to rise Price into an area of Resistance until which that zone can no longer hold the Buying Pressure building up underneath and leads to a Bullish Breakout of the Horizontal Resistance zone.
Once Validated, this Price Action can lead to Long Opportunities as a Breakout and Retest of that Resistance Zone to which traders will want to see if it turns Support!
Statistics also show that Triangle Patterns tend to fail 1/3 of the time, so we must also consider the possibility that the Selling Pressure that could be at the Horizontal Resistance Zone helping form the Ascending Triangle, could overcome Bulls, creating a False Breakout and push Price down using the Rising Support of the Ascending Triangle as a potential Shorting Opportunity.
Now both Scenarios have Price Targets at the next levels of Resistance or Support depending upon which way we get a Breakout!
**Waiting for a Valid Breakout of a pattern can raise the success rate immensely! Patience Pays.

UJ Long If Price Holds 152!FX:USDJPY has had an impressive rally since last weeks Low of 149.371 and that Low was supported by a touch of the 200 EMA with an immediate reaction that spells Bullish!
Currently, price is encountering some resistance from the Oct. 13 Highs in the 152.5 Area.
Now, If USD remains to be Bullish, we can expect Price to potentially drop from the Resistance Zone (if it is unable to break through) down to test the Break of Previous Structure in the 152 - 152.17 Area.
If Price finds Support there, it may deliver a Long Opportunity to take Price up into the 153.7 Area where Price will be expected to come in contact with Rising Resistance, seen on a Higher Time Frame! (Daily/Weekly)
Fundamentally, with CPI to be released on Friday with a forecast of higher inflation and the US Government shutdown with no real end in sight yet, could really impact what happens so stay vigilant!
* If USD loses strength, Price could fall below 152, changing the sentiment Bearish!

Potential Reversal Ready To Flip AU On Its "Head"Price on OANDA:AUDUSD is almost complete with forming the Right and final Shoulder of the potential Inverted Head and Shoulders Pattern!
Once Price has visited the Neckline of the Pattern, it will be Confirmed and will suggest that Price is looking to head higher!!
Once Confirmed, we will want to wait for a Valid Breakout and a Retest to generate potential Long Opportunities to take up to the next Resistance @ .6620!

USDCHF To Fall Further After Price Confirms Reversal @ .79797Price on OANDA:USDCHF has confirmed the Bearish Reversal @ .79797 and has formed a Lower Low!
Based from the Lower High @ .80577 to the Lower Low @ .79328, the 38.2% Fibonacci Retracement level finds itself right at the Confirmation which happens to be the next area that will be favorable for a Short Opportunity!
Once the 38.2% level is visited, we can expect Price will fall down to the next Support Level at the 1.618 Extension or Golden Ratio at .7902!

Got The GUTS For Stocks? Fractyl Health, Inc. Prints A Bull FlagNASDAQ:GUTS has printed a Bull Flag and with Price making a Retracement to the 50% Fibonacci Level @ $1.28, the Consolidation Phase of Price should be coming to and end!
This could mean its time to Buy Stock in Fractyl Health, Inc!
Once able to Breakout of the Descending Channel of the Flag, Price on Fractyl could keep pushing up!!
Currently the Analyst 1 Yr Price Target is set for $6.76, almost a 400% gain!
The company is also making great strides in weight loss study's and obesity gene therapy!

Triple Bottom At Rising Support Could Spell High Hopes For EJ!Here on OANDA:EURJPY we can see that Price was able to make a Breakout of the Rising Support to start the week last week and since, has made a Pullback to test the Breakout!
Price on Tuesday was able to make contact with the Rising Support in the 175.5 area and has formed a Triple Bottom Pattern suggesting this strong reversal pattern is aiming for higher prices!
Confirmation on the Triple Bottom Reversal Pattern will come when Price is able to Breakout of the current level holding Price @ 176.3.
Once the Breakout of the Triple Bottom is confirmed, this could generate a great Long opportunity from the 176.3 level to the next Resistance Zone @ 177.7 - 177.9

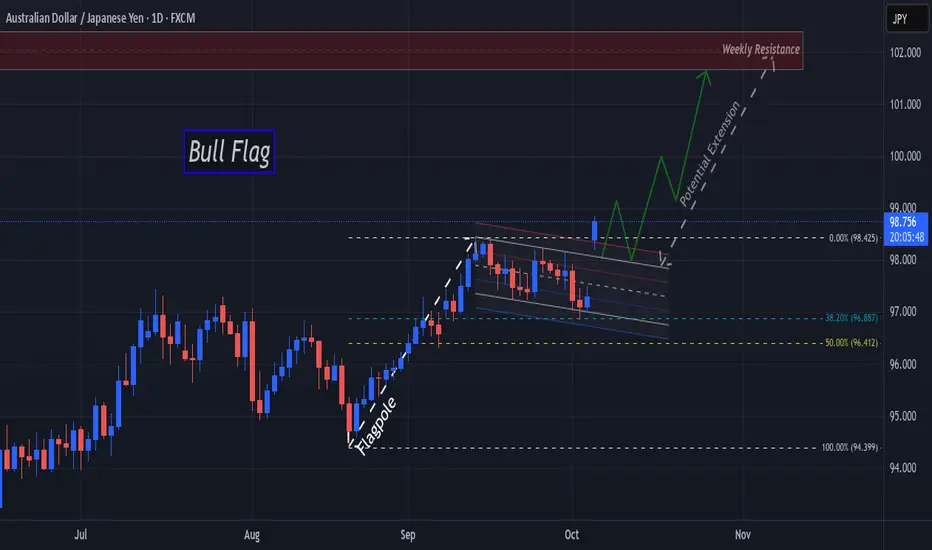
AJ Bulls Raise A Flag As They Gap Up To Start The Week!Price on OANDA:AUDJPY has been consolidating down a Descending Channel for the past 3 weeks and after making a 38.2% Retracement of the 98.425 High, to open this week, Bulls created a huge gap up, breaking out of the Descending Channel!
This Breakout confirms the Continuation Pattern, the Bull Flag!
If Bulls are able to secure a close higher than 98.425 during this Breakout and are successful in a Retest in the 98 - 97.8 range, this could deliver potential Long opportunities as a Bull Flag Breakout and Retest Set-Up!
Once we have a Valid Breakout and Successful Retest, the Price Target for the move will be into the Weekly Resistance that can be found in the 102 range from November Highs of 2024!
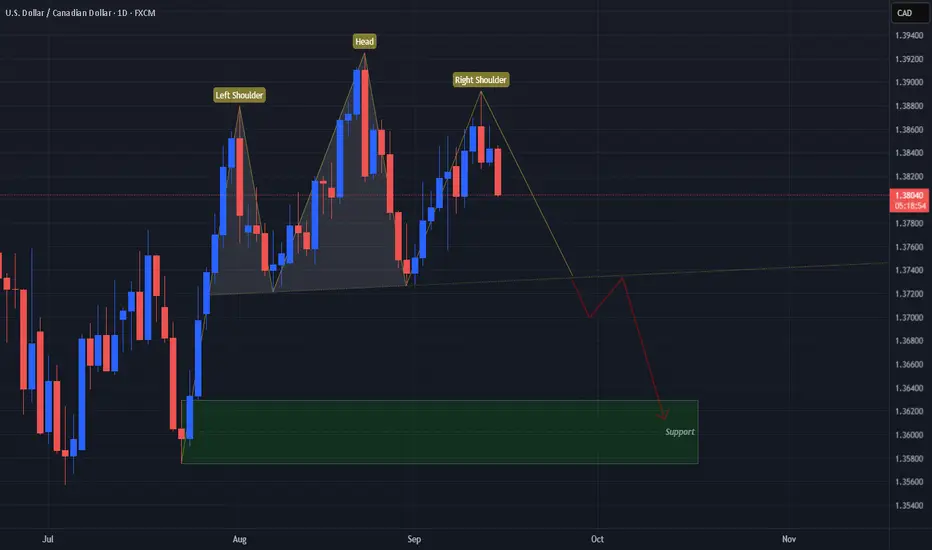
UCAD Dropping Signs of Potentially Strong ReversalOANDA:USDCAD has followed suit with last week so far with starting this week off continuing the decline in price from the Sept. 11th High beginning to form what looks to be a "Right Shoulder" or Lower High then the previous.
This strong triple Reversal Pattern is the Head and Shoulders!
Now the Right Shoulder was created but still has yet to form completely which will happen once price revisits the "Neckline" or Support Line price has been bouncing from to create the 3 peaks.
Once Price has Confirmed the Pattern, this should deliver potential Short Opportunities as a Head and Shoulders Breakout and Retest Scenario!
*The next suspected area Price will travel to if the Pattern is confirmed will be the Last Support Zone Price visited before beginning the formation of the Pattern.
Breakout of Head & Shoulders on AJOANDA:AUDJPY has completed a strong triple reversal pattern, the Head and Shoulders!
Price currently has broken through the Neckline or Support line and we will want to see price close underneath to validate the breakout!
Once price has closed underneath Support, we will want to wait to watch for a retest of that breakout around 96.75 with rejection to signal a successful retest!
This could deliver a great shorting opportunity!

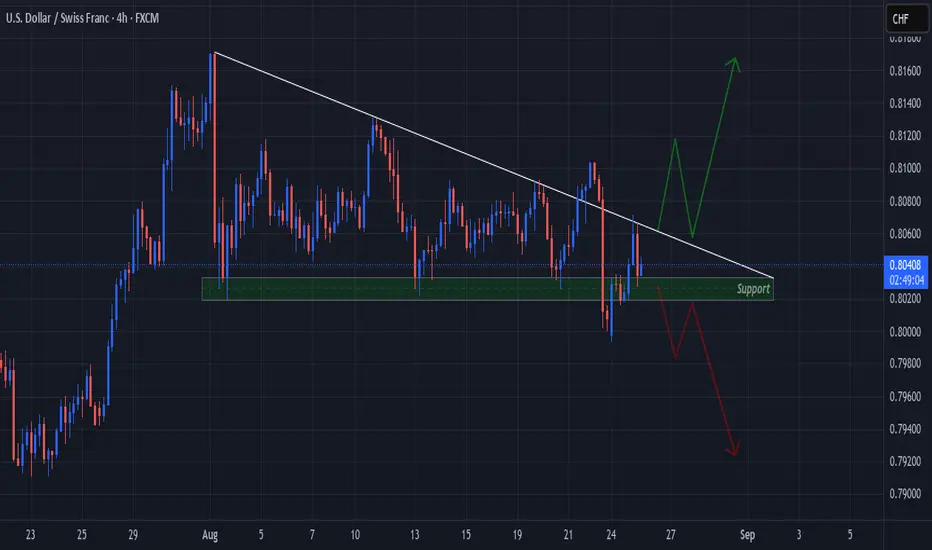
USDCHF "Descends" Into Multiple False Breakouts of the Triangle!Price on OANDA:USDCHF has been falling in a Descending Triangle Pattern shown here on the 4Hr Chart.
Price ending last week created 2 False Breakouts of both the Falling Resistance and Horizontal Support!
Price soon will be looking to make a Breakout with it consolidating tighter into the Apex of the Triangle.
Once a Breakout is validated, we will want to see a Retest!
Battle Of Wicks Confirms Pennant On EJ, Which Leg Will Break?!Here on OANDA:EURJPY we can see Price has been volleyed back and forth between a Falling Resistance and Rising Support at similar degrees forming a Pennant Pattern!
Currently we can see the Consolidation is getting tight and likely to breakout soon, the question is which leg will break?!
Fundamentally EUR and JPY have news events littered throughout this week that will give us some good insight into both currencies corresponding economies, like Tokyo Core CPI y/y on Thursday, Aug. 28th with a Bearish forecast of 2.6%, down from 2.9%!
For now, we must wait for Price to give us a Breakout and Retest!
