Swing trade opportunity in INOX WINDSwing trade opportunity in INOX WIND.
Entry - 150
Targets - 175 & 190
DISCLAIMER: I am not SEBI registered and the ideas posted are only for educational purpose. Always trade with proper STOP LOSS.
Breakouts

$crcl Big Base Breakout Forming at 155–156 ZoneBig Base Breakout Forming at 155–156 Zone
After months of grinding and rounding out a bottom, this name is setting up for a massive base breakout through the 155–156 level — a zone that’s acted as key resistance since the post-IPO selloff.
🔹 The Setup:
After its IPO, the stock dropped over 50%, washing out weak hands.
Since then, it’s spent months building a broad rounded base — classic bottoming behavior.
Now price is tightening right under the breakout zone (155–156), coiling up for a potential surge.
🔹 Sector Tailwind:
Crypto stocks are back in play, showing renewed momentum across the board.
When sector strength and technical structure align like this, these base breakouts can move fast.
🔹 My Trade Plan:
1️⃣ Entry: Watching for a clean breakout over 156 with strong volume.
2️⃣ Stop: Just below the breakout level — no reason to sit through a failed base.
3️⃣ Target: Measured move from the base projects significantly higher if it confirms.
Why I Like This Setup:
Long base = energy stored for a bigger move.
Sector strength adds confidence.
Defined breakout level, clear risk, and strong upside potential — exactly what I look for.

Buy $CAKE - HUGE NARRATIVE SHIFT CAME TO BNB - DONT WAITIn short Cake is close to breaking out of a 3 year range and the upside is huge.
The power driving this is a memecoin meta taking place on BNB.
Lots of inflow from solana coming in.
Four.meme is a launchpad that launches tokens on the pancakeswap liquidity pool.
The revenue its generating is 6X more then it was in the past so the token is criminally undervalued.
My buys may feel late but I think this can easily 5x from here.

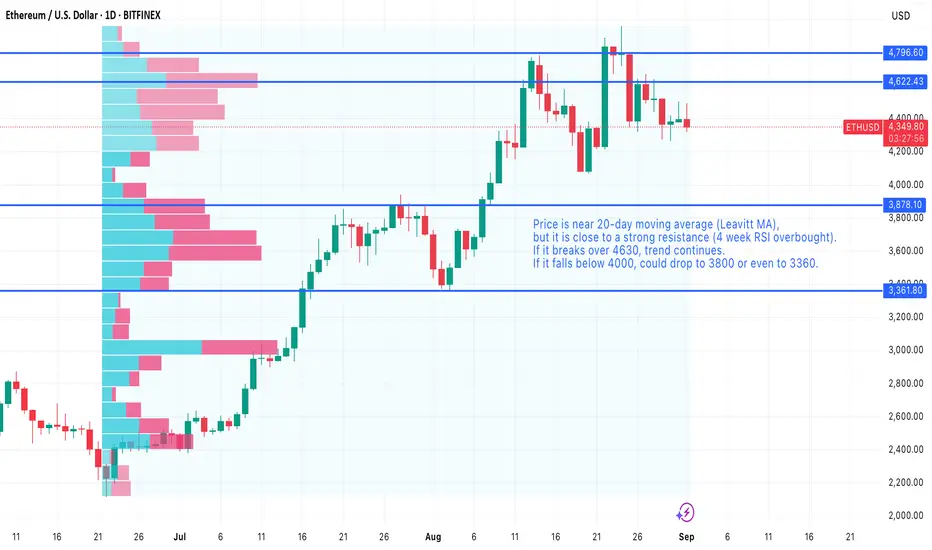
Break or Bust — ETH betwen Support vs. Overbought 4‑WeekETH sitting at the 20‑day Leavitt MA while hitting strong resistance — overbought of 4‑week RSI.
If price breaks and closes above $4,630, trend continuation is likely.
If price breaks below $4,000, expect a drop toward $3,800 and possibly $3,360.
Technical notes:
Use the 20‑day Leavitt MA as your short‑term trend anchor.
Watch for a confirmed daily close above $4,630 to signal continuation (entry on retest or momentum breakout).
A daily close below $4,000 invalidates the bullish case; targets: $3,800 then $3,360 (scale stops and size accordingly).
Manage risk with stops outside breakout levels and position sizing for potential volatility.
Heres a GOOG Breakout SETUP!! (1HR)Still in a wedge, but my bias leans towards bullish. Watching for a clean breakout above 247.64 for confirmation.
My Targets are 247.64 → 251.65 → 254.77
⚠️ This is not financial advice just my personal analysis. Always do your own research before trading or investing.

Amazing breakout on WEEKLY Timeframe - SAMMAANCAPCheckout an amazing breakout happened in the stock in Weekly timeframe, macroscopically seen in Daily timeframe. Having a great favor that the stock might be bullish expecting a staggering returns of minimum 25% TGT. IMPORTANT BREAKOUT LEVELS ARE ALWAYS RESPECTED!
NOTE for learners: Place the breakout levels as per the chart shared and track it yourself to get amazed!!
#No complicated chart patterns
#No big big indicators
#No Excel sheet or number magics
TRADE IDEA: WAIT FOR THE STOCK TO BREAKOUT IN WEEKLY TIMEFRAME ABOVE THIS LEVEL.
Checkout an amazing breakout happened in the stock in Weekly timeframe.
Breakouts happening in longer timeframe is way more powerful than the breakouts seen in Daily timeframe. You can blindly invest once the weekly candle closes above the breakout line and stay invested forever. Also these stocks breakouts are lifelong predictions, it means technically these breakouts happen giving more returns in the longer runs. Hence, even when the scrip makes a loss of 10% / 20% / 30% / 50%, the stock will regain and turn around. Once they again enter the same breakout level, they will flyyyyyyyyyyyy like a ROCKET if held in the portfolio in the longer run.
Time makes money, GREEDY & EGO will not make money.
Also, magically these breakouts tend to prove that the companies turn around and fundamentally becoming strong. Also the magic happens when more diversification is done in various sectors under various scripts with equal money invested in each N500 scripts.
The real deal is when to purchase and where to purchase the stock. That is where Breakout study comes into play.
LET'S PUMP IN SOME MONEY AND REVOLUTIONIZE THE NATION'S ECONOMY!

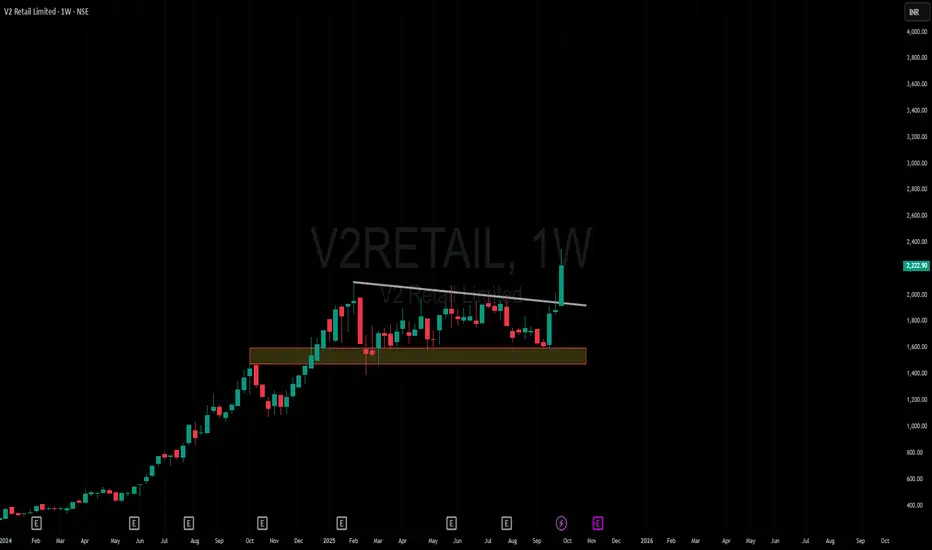
Amazing breakout on WEEKLY Timeframe - V2RETAILCheckout an amazing breakout happened in the stock in Weekly timeframe, macroscopically seen in Daily timeframe. Having a great favor that the stock might be bullish expecting a staggering returns of minimum 25% TGT. IMPORTANT BREAKOUT LEVELS ARE ALWAYS RESPECTED!
NOTE for learners: Place the breakout levels as per the chart shared and track it yourself to get amazed!!
#No complicated chart patterns
#No big big indicators
#No Excel sheet or number magics
TRADE IDEA: WAIT FOR THE STOCK TO BREAKOUT IN WEEKLY TIMEFRAME ABOVE THIS LEVEL.
Checkout an amazing breakout happened in the stock in Weekly timeframe.
Breakouts happening in longer timeframe is way more powerful than the breakouts seen in Daily timeframe. You can blindly invest once the weekly candle closes above the breakout line and stay invested forever. Also these stocks breakouts are lifelong predictions, it means technically these breakouts happen giving more returns in the longer runs. Hence, even when the scrip makes a loss of 10% / 20% / 30% / 50%, the stock will regain and turn around. Once they again enter the same breakout level, they will flyyyyyyyyyyyy like a ROCKET if held in the portfolio in the longer run.
Time makes money, GREEDY & EGO will not make money.
Also, magically these breakouts tend to prove that the companies turn around and fundamentally becoming strong. Also the magic happens when more diversification is done in various sectors under various scripts with equal money invested in each N500 scripts.
The real deal is when to purchase and where to purchase the stock. That is where Breakout study comes into play.
LET'S PUMP IN SOME MONEY AND REVOLUTIONIZE THE NATION'S ECONOMY!
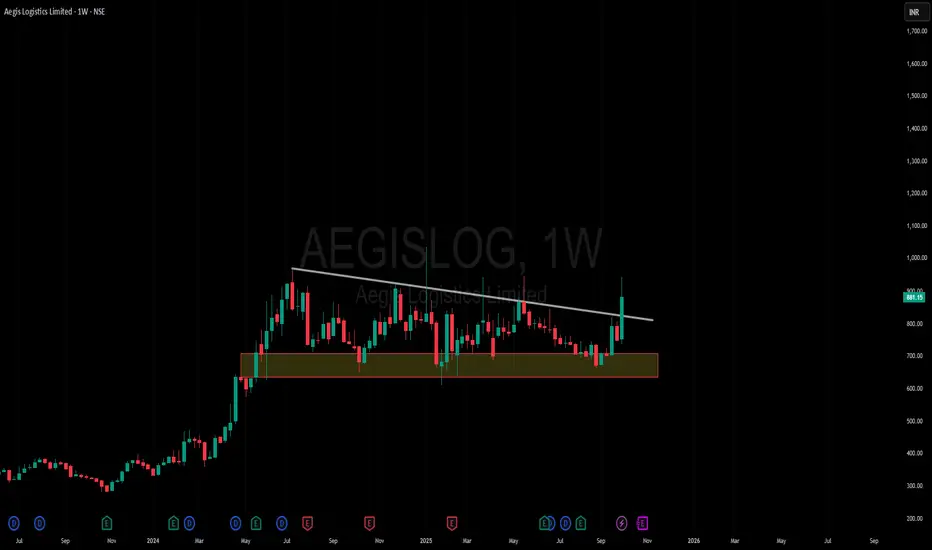
Amazing breakout on WEEKLY Timeframe - AEGISLOGCheckout an amazing breakout happened in the stock in Weekly timeframe, macroscopically seen in Daily timeframe. Having a great favor that the stock might be bullish expecting a staggering returns of minimum 25% TGT. IMPORTANT BREAKOUT LEVELS ARE ALWAYS RESPECTED!
NOTE for learners: Place the breakout levels as per the chart shared and track it yourself to get amazed!!
#No complicated chart patterns
#No big big indicators
#No Excel sheet or number magics
TRADE IDEA: WAIT FOR THE STOCK TO BREAKOUT IN WEEKLY TIMEFRAME ABOVE THIS LEVEL.
Checkout an amazing breakout happened in the stock in Weekly timeframe.
Breakouts happening in longer timeframe is way more powerful than the breakouts seen in Daily timeframe. You can blindly invest once the weekly candle closes above the breakout line and stay invested forever. Also these stocks breakouts are lifelong predictions, it means technically these breakouts happen giving more returns in the longer runs. Hence, even when the scrip makes a loss of 10% / 20% / 30% / 50%, the stock will regain and turn around. Once they again enter the same breakout level, they will flyyyyyyyyyyyy like a ROCKET if held in the portfolio in the longer run.
Time makes money, GREEDY & EGO will not make money.
Also, magically these breakouts tend to prove that the companies turn around and fundamentally becoming strong. Also the magic happens when more diversification is done in various sectors under various scripts with equal money invested in each N500 scripts.
The real deal is when to purchase and where to purchase the stock. That is where Breakout study comes into play.
LET'S PUMP IN SOME MONEY AND REVOLUTIONIZE THE NATION'S ECONOMY!
Amazing breakout on WEEKLY Timeframe - MOLDTECHCheckout an amazing breakout happened in the stock in Weekly timeframe, macroscopically seen in Daily timeframe. Having a great favor that the stock might be bullish expecting a staggering returns of minimum 25% TGT. IMPORTANT BREAKOUT LEVELS ARE ALWAYS RESPECTED!
NOTE for learners: Place the breakout levels as per the chart shared and track it yourself to get amazed!!
#No complicated chart patterns
#No big big indicators
#No Excel sheet or number magics
TRADE IDEA: WAIT FOR THE STOCK TO BREAKOUT IN WEEKLY TIMEFRAME ABOVE THIS LEVEL.
Checkout an amazing breakout happened in the stock in Weekly timeframe.
Breakouts happening in longer timeframe is way more powerful than the breakouts seen in Daily timeframe. You can blindly invest once the weekly candle closes above the breakout line and stay invested forever. Also these stocks breakouts are lifelong predictions, it means technically these breakouts happen giving more returns in the longer runs. Hence, even when the scrip makes a loss of 10% / 20% / 30% / 50%, the stock will regain and turn around. Once they again enter the same breakout level, they will flyyyyyyyyyyyy like a ROCKET if held in the portfolio in the longer run.
Time makes money, GREEDY & EGO will not make money.
Also, magically these breakouts tend to prove that the companies turn around and fundamentally becoming strong. Also the magic happens when more diversification is done in various sectors under various scripts with equal money invested in each N500 scripts.
The real deal is when to purchase and where to purchase the stock. That is where Breakout study comes into play.
LET'S PUMP IN SOME MONEY AND REVOLUTIONIZE THE NATION'S ECONOMY!

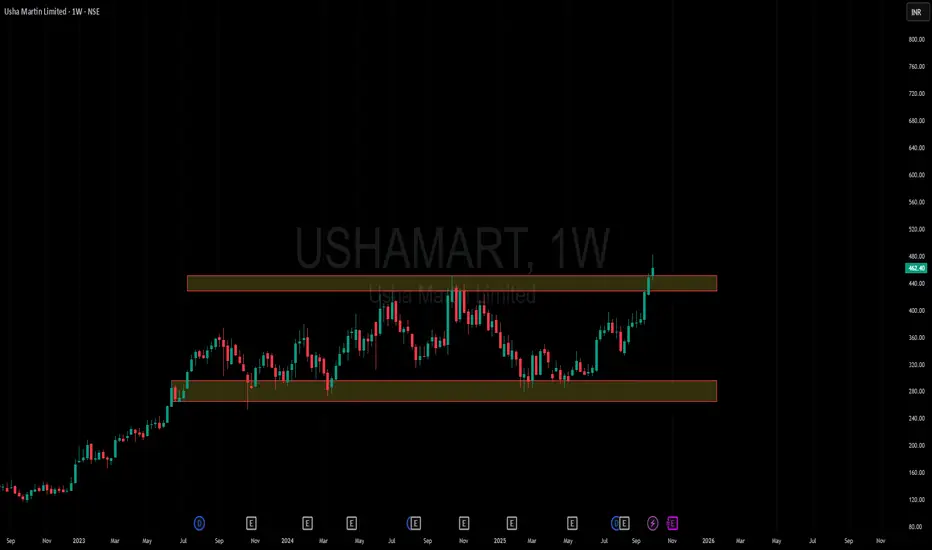
Amazing breakout on WEEKLY Timeframe - USHAMARTINCheckout an amazing breakout happened in the stock in Weekly timeframe, macroscopically seen in Daily timeframe. Having a great favor that the stock might be bullish expecting a staggering returns of minimum 25% TGT. IMPORTANT BREAKOUT LEVELS ARE ALWAYS RESPECTED!
NOTE for learners: Place the breakout levels as per the chart shared and track it yourself to get amazed!!
#No complicated chart patterns
#No big big indicators
#No Excel sheet or number magics
TRADE IDEA: WAIT FOR THE STOCK TO BREAKOUT IN WEEKLY TIMEFRAME ABOVE THIS LEVEL.
Checkout an amazing breakout happened in the stock in Weekly timeframe.
Breakouts happening in longer timeframe is way more powerful than the breakouts seen in Daily timeframe. You can blindly invest once the weekly candle closes above the breakout line and stay invested forever. Also these stocks breakouts are lifelong predictions, it means technically these breakouts happen giving more returns in the longer runs. Hence, even when the scrip makes a loss of 10% / 20% / 30% / 50%, the stock will regain and turn around. Once they again enter the same breakout level, they will flyyyyyyyyyyyy like a ROCKET if held in the portfolio in the longer run.
Time makes money, GREEDY & EGO will not make money.
Also, magically these breakouts tend to prove that the companies turn around and fundamentally becoming strong. Also the magic happens when more diversification is done in various sectors under various scripts with equal money invested in each N500 scripts.
The real deal is when to purchase and where to purchase the stock. That is where Breakout study comes into play.
LET'S PUMP IN SOME MONEY AND REVOLUTIONIZE THE NATION'S ECONOMY!
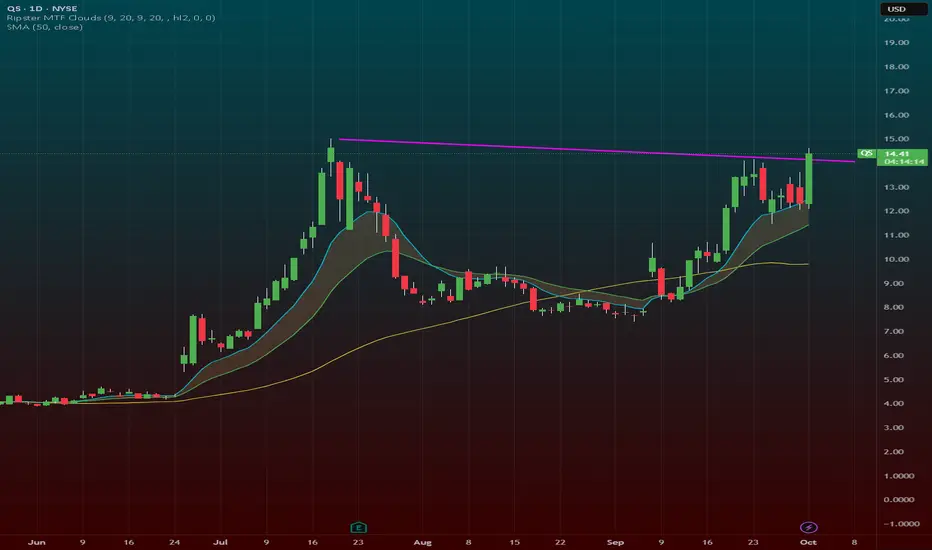
$QS – Flat Top Breakout with Dual ThemesNYSE:QS – Flat Top Breakout at $14.50–$15 Zone
QuantumScape ( NYSE:QS ) is setting up for a flat top breakout right in the $14.50–$15 range, and the chart plus themes behind it make this one worth watching closely.
🔹 The Setup:
Multi-week base pressing into the $14.50–$15 resistance zone.
Price action is tightening with volume contraction — a classic pre-breakout signal.
A clean move through $15 could trigger a momentum run.
🔹 The Themes Driving It:
1️⃣ Battery / Alt Energy Trade – The whole sector is catching momentum as the AI data center buildout pushes energy themes higher.
2️⃣ Quantum Hype Tailwinds – Even though NYSE:QS doesn’t actually do quantum computing, the “Quantum” name attracts speculative flows whenever that theme gets hot.
🔹 My Trade Plan:
1️⃣ Entry: Starter near $14.50–$15 with anticipation.
2️⃣ Add: Full size on breakout through $15 with strong volume.
3️⃣ Stop: Below recent base lows — keep it tight.
Why I Like This Setup:
Flat top structures at round numbers = explosive potential.
Sector tailwinds + speculative narrative = extra juice.
Tight risk with clear invalidation makes this a high R/R setup.
Amazing breakout on WEEKLY Timeframe - SBINCheckout an amazing breakout happened in the stock in Weekly timeframe, macroscopically seen in Daily timeframe. Having a great favor that the stock might be bullish expecting a staggering returns of minimum 25% TGT. IMPORTANT BREAKOUT LEVELS ARE ALWAYS RESPECTED!
NOTE for learners: Place the breakout levels as per the chart shared and track it yourself to get amazed!!
#No complicated chart patterns
#No big big indicators
#No Excel sheet or number magics
TRADE IDEA: WAIT FOR THE STOCK TO BREAKOUT IN WEEKLY TIMEFRAME ABOVE THIS LEVEL.
Checkout an amazing breakout happened in the stock in Weekly timeframe.
Breakouts happening in longer timeframe is way more powerful than the breakouts seen in Daily timeframe. You can blindly invest once the weekly candle closes above the breakout line and stay invested forever. Also these stocks breakouts are lifelong predictions, it means technically these breakouts happen giving more returns in the longer runs. Hence, even when the scrip makes a loss of 10% / 20% / 30% / 50%, the stock will regain and turn around. Once they again enter the same breakout level, they will flyyyyyyyyyyyy like a ROCKET if held in the portfolio in the longer run.
Time makes money, GREEDY & EGO will not make money.
Also, magically these breakouts tend to prove that the companies turn around and fundamentally becoming strong. Also the magic happens when more diversification is done in various sectors under various scripts with equal money invested in each N500 scripts.
The real deal is when to purchase and where to purchase the stock. That is where Breakout study comes into play.
LET'S PUMP IN SOME MONEY AND REVOLUTIONIZE THE NATION'S ECONOMY!

XAUUSD Long: Bullish Momentum to ContinueHello, traders! The price auction for XAUUSD has been in a strong bullish phase, confirmed by the establishment of a well-defined ascending channel. This uptrend was initiated after a breakout from lower levels and has shown significant strength by pushing through multiple prior resistance areas, including the 3470 DEMAND 2 and 3675 DEMAND levels, turning them into new support.
Currently, the price action is continuing its ascent within the upper portion of this ascending channel, indicating that the bullish initiative remains firmly in control. The market is in a clear expansion phase, with very little sign of significant selling pressure, suggesting that any pullbacks are likely to be minor and short-lived.
My scenario for the development of events is a direct continuation of the current bullish momentum. I believe that the price will only make a shallow correction from the current levels before the next impulsive wave higher begins. In my opinion, the underlying trend is strong enough to carry the price to a new high within the channel. The take-profit is therefore set at 3835 points, targeting the upper resistance line of the channel. Manage your risk.

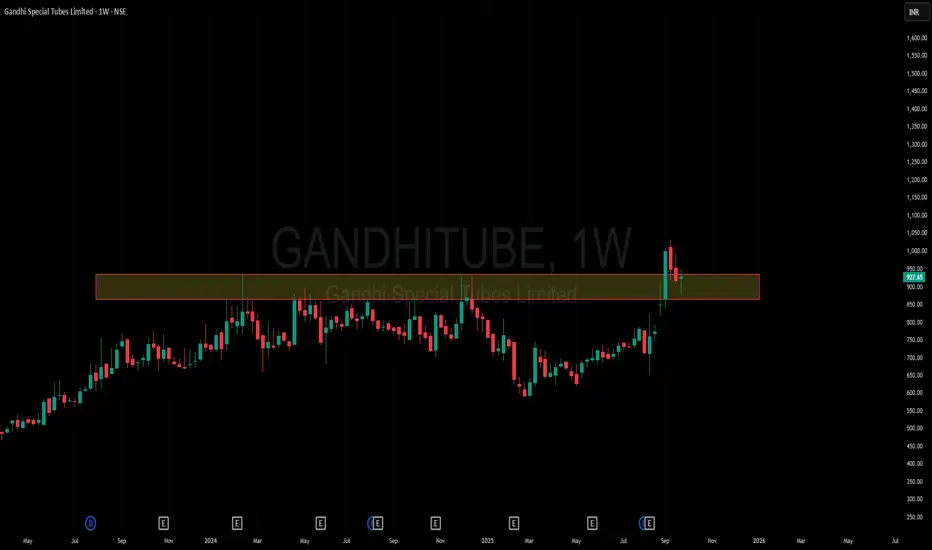
Amazing breakout on WEEKLY Timeframe - GANDHITUBECheckout an amazing breakout happened in the stock in Weekly timeframe, macroscopically seen in Daily timeframe. Having a great favor that the stock might be bullish expecting a staggering returns of minimum 25% TGT. IMPORTANT BREAKOUT LEVELS ARE ALWAYS RESPECTED!
NOTE for learners: Place the breakout levels as per the chart shared and track it yourself to get amazed!!
#No complicated chart patterns
#No big big indicators
#No Excel sheet or number magics
TRADE IDEA: WAIT FOR THE STOCK TO BREAKOUT IN WEEKLY TIMEFRAME ABOVE THIS LEVEL.
Checkout an amazing breakout happened in the stock in Weekly timeframe.
Breakouts happening in longer timeframe is way more powerful than the breakouts seen in Daily timeframe. You can blindly invest once the weekly candle closes above the breakout line and stay invested forever. Also these stocks breakouts are lifelong predictions, it means technically these breakouts happen giving more returns in the longer runs. Hence, even when the scrip makes a loss of 10% / 20% / 30% / 50%, the stock will regain and turn around. Once they again enter the same breakout level, they will flyyyyyyyyyyyy like a ROCKET if held in the portfolio in the longer run.
Time makes money, GREEDY & EGO will not make money.
Also, magically these breakouts tend to prove that the companies turn around and fundamentally becoming strong. Also the magic happens when more diversification is done in various sectors under various scripts with equal money invested in each N500 scripts.
The real deal is when to purchase and where to purchase the stock. That is where Breakout study comes into play.
LET'S PUMP IN SOME MONEY AND REVOLUTIONIZE THE NATION'S ECONOMY!
Amazing breakout on WEEKLY Timeframe - CHEMCONCheckout an amazing breakout happened in the stock in Weekly timeframe, macroscopically seen in Daily timeframe. Having a great favor that the stock might be bullish expecting a staggering returns of minimum 25% TGT. IMPORTANT BREAKOUT LEVELS ARE ALWAYS RESPECTED!
NOTE for learners: Place the breakout levels as per the chart shared and track it yourself to get amazed!!
#No complicated chart patterns
#No big big indicators
#No Excel sheet or number magics
TRADE IDEA: WAIT FOR THE STOCK TO BREAKOUT IN WEEKLY TIMEFRAME ABOVE THIS LEVEL.
Checkout an amazing breakout happened in the stock in Weekly timeframe.
Breakouts happening in longer timeframe is way more powerful than the breakouts seen in Daily timeframe. You can blindly invest once the weekly candle closes above the breakout line and stay invested forever. Also these stocks breakouts are lifelong predictions, it means technically these breakouts happen giving more returns in the longer runs. Hence, even when the scrip makes a loss of 10% / 20% / 30% / 50%, the stock will regain and turn around. Once they again enter the same breakout level, they will flyyyyyyyyyyyy like a ROCKET if held in the portfolio in the longer run.
Time makes money, GREEDY & EGO will not make money.
Also, magically these breakouts tend to prove that the companies turn around and fundamentally becoming strong. Also the magic happens when more diversification is done in various sectors under various scripts with equal money invested in each N500 scripts.
The real deal is when to purchase and where to purchase the stock. That is where Breakout study comes into play.
LET'S PUMP IN SOME MONEY AND REVOLUTIONIZE THE NATION'S ECONOMY!

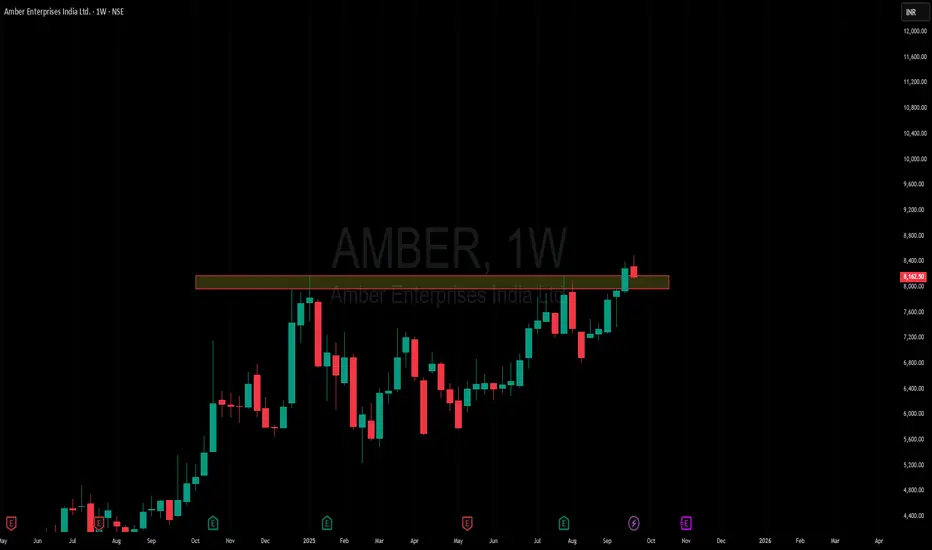
Amazing breakout on WEEKLY Timeframe - AMBERCheckout an amazing breakout happened in the stock in Weekly timeframe, macroscopically seen in Daily timeframe. Having a great favor that the stock might be bullish expecting a staggering returns of minimum 25% TGT. IMPORTANT BREAKOUT LEVELS ARE ALWAYS RESPECTED!
NOTE for learners: Place the breakout levels as per the chart shared and track it yourself to get amazed!!
#No complicated chart patterns
#No big big indicators
#No Excel sheet or number magics
TRADE IDEA: WAIT FOR THE STOCK TO BREAKOUT IN WEEKLY TIMEFRAME ABOVE THIS LEVEL.
Checkout an amazing breakout happened in the stock in Weekly timeframe.
Breakouts happening in longer timeframe is way more powerful than the breakouts seen in Daily timeframe. You can blindly invest once the weekly candle closes above the breakout line and stay invested forever. Also these stocks breakouts are lifelong predictions, it means technically these breakouts happen giving more returns in the longer runs. Hence, even when the scrip makes a loss of 10% / 20% / 30% / 50%, the stock will regain and turn around. Once they again enter the same breakout level, they will flyyyyyyyyyyyy like a ROCKET if held in the portfolio in the longer run.
Time makes money, GREEDY & EGO will not make money.
Also, magically these breakouts tend to prove that the companies turn around and fundamentally becoming strong. Also the magic happens when more diversification is done in various sectors under various scripts with equal money invested in each N500 scripts.
The real deal is when to purchase and where to purchase the stock. That is where Breakout study comes into play.
LET'S PUMP IN SOME MONEY AND REVOLUTIONIZE THE NATION'S ECONOMY!
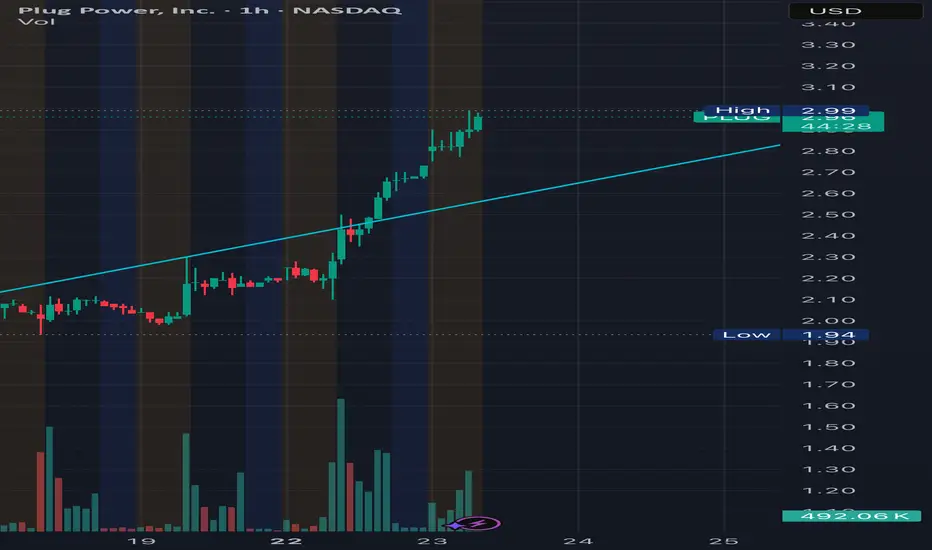
$PLUG - Plug Power - $3.49 PTNASDAQ:PLUG broke out from $1.41 and currently projecting a $3.40 PT after announcing it will be offering over 185 million shares at a $2.00 exercise price, will remain valid until March 2028.
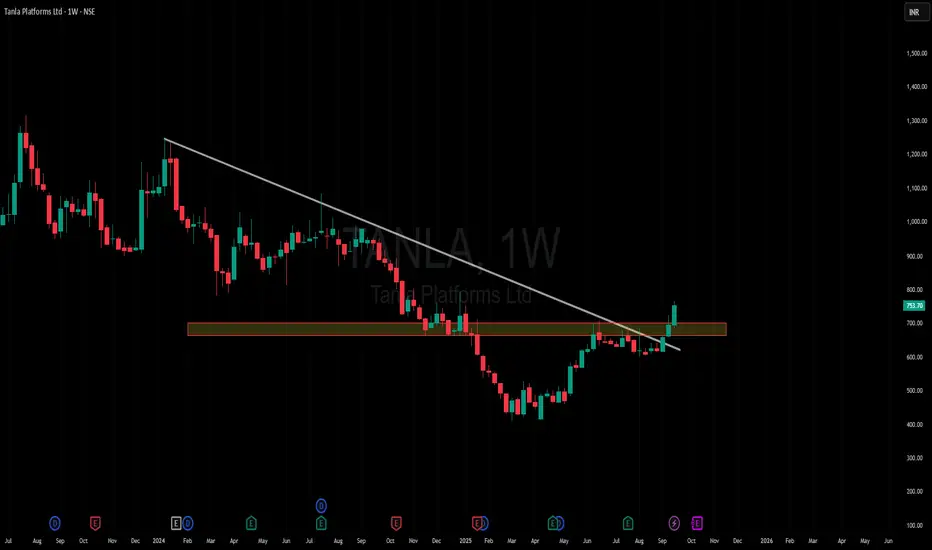
Amazing breakout on WEEKLY Timeframe - TANLACheckout an amazing breakout happened in the stock in Weekly timeframe, macroscopically seen in Daily timeframe. Having a great favor that the stock might be bullish expecting a staggering returns of minimum 25% TGT. IMPORTANT BREAKOUT LEVELS ARE ALWAYS RESPECTED!
NOTE for learners: Place the breakout levels as per the chart shared and track it yourself to get amazed!!
#No complicated chart patterns
#No big big indicators
#No Excel sheet or number magics
TRADE IDEA: WAIT FOR THE STOCK TO BREAKOUT IN WEEKLY TIMEFRAME ABOVE THIS LEVEL.
Checkout an amazing breakout happened in the stock in Weekly timeframe.
Breakouts happening in longer timeframe is way more powerful than the breakouts seen in Daily timeframe. You can blindly invest once the weekly candle closes above the breakout line and stay invested forever. Also these stocks breakouts are lifelong predictions, it means technically these breakouts happen giving more returns in the longer runs. Hence, even when the scrip makes a loss of 10% / 20% / 30% / 50%, the stock will regain and turn around. Once they again enter the same breakout level, they will flyyyyyyyyyyyy like a ROCKET if held in the portfolio in the longer run.
Time makes money, GREEDY & EGO will not make money.
Also, magically these breakouts tend to prove that the companies turn around and fundamentally becoming strong. Also the magic happens when more diversification is done in various sectors under various scripts with equal money invested in each N500 scripts.
The real deal is when to purchase and where to purchase the stock. That is where Breakout study comes into play.
LET'S PUMP IN SOME MONEY AND REVOLUTIONIZE THE NATION'S ECONOMY!
Amazing breakout on WEEKLY Timeframe - SBINCheckout an amazing breakout happened in the stock in Weekly timeframe, macroscopically seen in Daily timeframe. Having a great favor that the stock might be bullish expecting a staggering returns of minimum 25% TGT. IMPORTANT BREAKOUT LEVELS ARE ALWAYS RESPECTED!
NOTE for learners: Place the breakout levels as per the chart shared and track it yourself to get amazed!!
#No complicated chart patterns
#No big big indicators
#No Excel sheet or number magics
TRADE IDEA: WAIT FOR THE STOCK TO BREAKOUT IN WEEKLY TIMEFRAME ABOVE THIS LEVEL.
Checkout an amazing breakout happened in the stock in Weekly timeframe.
Breakouts happening in longer timeframe is way more powerful than the breakouts seen in Daily timeframe. You can blindly invest once the weekly candle closes above the breakout line and stay invested forever. Also these stocks breakouts are lifelong predictions, it means technically these breakouts happen giving more returns in the longer runs. Hence, even when the scrip makes a loss of 10% / 20% / 30% / 50%, the stock will regain and turn around. Once they again enter the same breakout level, they will flyyyyyyyyyyyy like a ROCKET if held in the portfolio in the longer run.
Time makes money, GREEDY & EGO will not make money.
Also, magically these breakouts tend to prove that the companies turn around and fundamentally becoming strong. Also the magic happens when more diversification is done in various sectors under various scripts with equal money invested in each N500 scripts.
The real deal is when to purchase and where to purchase the stock. That is where Breakout study comes into play.
LET'S PUMP IN SOME MONEY AND REVOLUTIONIZE THE NATION'S ECONOMY!

Amazing breakout on WEEKLY Timeframe - ANANTRAJCheckout an amazing breakout happened in the stock in Weekly timeframe, macroscopically seen in Daily timeframe. Having a great favor that the stock might be bullish expecting a staggering returns of minimum 25% TGT. IMPORTANT BREAKOUT LEVELS ARE ALWAYS RESPECTED!
NOTE for learners: Place the breakout levels as per the chart shared and track it yourself to get amazed!!
#No complicated chart patterns
#No big big indicators
#No Excel sheet or number magics
TRADE IDEA: WAIT FOR THE STOCK TO BREAKOUT IN WEEKLY TIMEFRAME ABOVE THIS LEVEL.
Checkout an amazing breakout happened in the stock in Weekly timeframe.
Breakouts happening in longer timeframe is way more powerful than the breakouts seen in Daily timeframe. You can blindly invest once the weekly candle closes above the breakout line and stay invested forever. Also these stocks breakouts are lifelong predictions, it means technically these breakouts happen giving more returns in the longer runs. Hence, even when the scrip makes a loss of 10% / 20% / 30% / 50%, the stock will regain and turn around. Once they again enter the same breakout level, they will flyyyyyyyyyyyy like a ROCKET if held in the portfolio in the longer run.
Time makes money, GREEDY & EGO will not make money.
Also, magically these breakouts tend to prove that the companies turn around and fundamentally becoming strong. Also the magic happens when more diversification is done in various sectors under various scripts with equal money invested in each N500 scripts.
The real deal is when to purchase and where to purchase the stock. That is where Breakout study comes into play.
LET'S PUMP IN SOME MONEY AND REVOLUTIONIZE THE NATION'S ECONOMY!

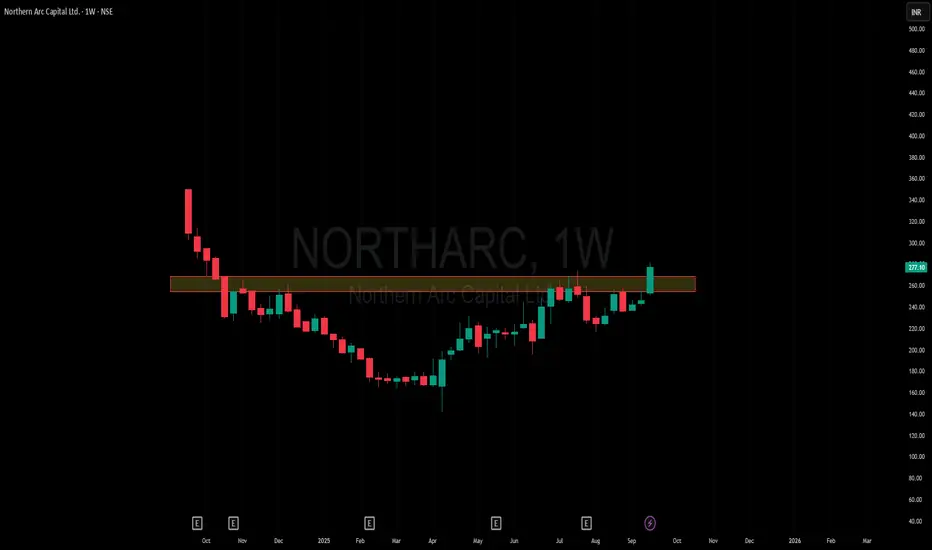
Amazing breakout on WEEKLY Timeframe - NORTHARCCheckout an amazing breakout happened in the stock in Weekly timeframe, macroscopically seen in Daily timeframe. Having a great favor that the stock might be bullish expecting a staggering returns of minimum 25% TGT. IMPORTANT BREAKOUT LEVELS ARE ALWAYS RESPECTED!
NOTE for learners: Place the breakout levels as per the chart shared and track it yourself to get amazed!!
#No complicated chart patterns
#No big big indicators
#No Excel sheet or number magics
TRADE IDEA: WAIT FOR THE STOCK TO BREAKOUT IN WEEKLY TIMEFRAME ABOVE THIS LEVEL.
Checkout an amazing breakout happened in the stock in Weekly timeframe.
Breakouts happening in longer timeframe is way more powerful than the breakouts seen in Daily timeframe. You can blindly invest once the weekly candle closes above the breakout line and stay invested forever. Also these stocks breakouts are lifelong predictions, it means technically these breakouts happen giving more returns in the longer runs. Hence, even when the scrip makes a loss of 10% / 20% / 30% / 50%, the stock will regain and turn around. Once they again enter the same breakout level, they will flyyyyyyyyyyyy like a ROCKET if held in the portfolio in the longer run.
Time makes money, GREEDY & EGO will not make money.
Also, magically these breakouts tend to prove that the companies turn around and fundamentally becoming strong. Also the magic happens when more diversification is done in various sectors under various scripts with equal money invested in each N500 scripts.
The real deal is when to purchase and where to purchase the stock. That is where Breakout study comes into play.
LET'S PUMP IN SOME MONEY AND REVOLUTIONIZE THE NATION'S ECONOMY!
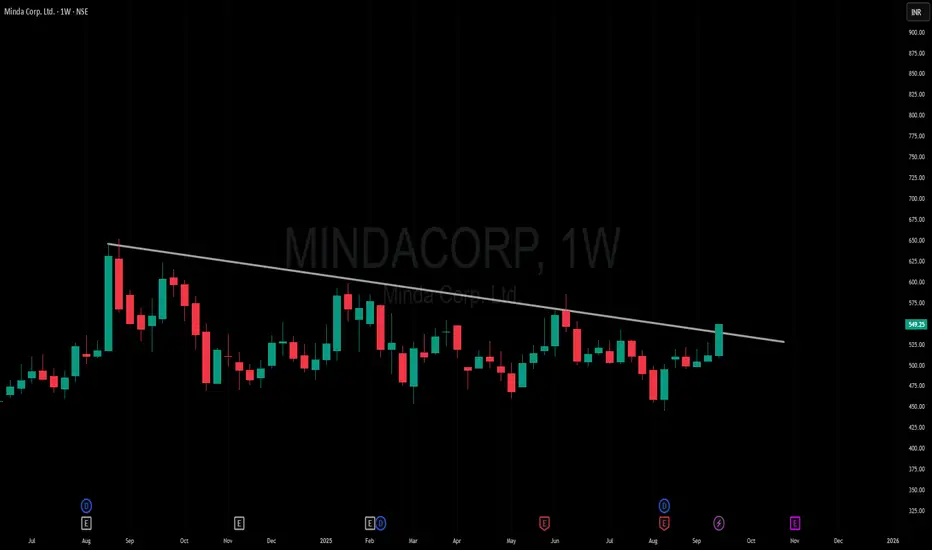
Amazing breakout on WEEKLY Timeframe - MINDACORPCheckout an amazing breakout happened in the stock in Weekly timeframe, macroscopically seen in Daily timeframe. Having a great favor that the stock might be bullish expecting a staggering returns of minimum 25% TGT. IMPORTANT BREAKOUT LEVELS ARE ALWAYS RESPECTED!
NOTE for learners: Place the breakout levels as per the chart shared and track it yourself to get amazed!!
#No complicated chart patterns
#No big big indicators
#No Excel sheet or number magics
TRADE IDEA: WAIT FOR THE STOCK TO BREAKOUT IN WEEKLY TIMEFRAME ABOVE THIS LEVEL.
Checkout an amazing breakout happened in the stock in Weekly timeframe.
Breakouts happening in longer timeframe is way more powerful than the breakouts seen in Daily timeframe. You can blindly invest once the weekly candle closes above the breakout line and stay invested forever. Also these stocks breakouts are lifelong predictions, it means technically these breakouts happen giving more returns in the longer runs. Hence, even when the scrip makes a loss of 10% / 20% / 30% / 50%, the stock will regain and turn around. Once they again enter the same breakout level, they will flyyyyyyyyyyyy like a ROCKET if held in the portfolio in the longer run.
Time makes money, GREEDY & EGO will not make money.
Also, magically these breakouts tend to prove that the companies turn around and fundamentally becoming strong. Also the magic happens when more diversification is done in various sectors under various scripts with equal money invested in each N500 scripts.
The real deal is when to purchase and where to purchase the stock. That is where Breakout study comes into play.
LET'S PUMP IN SOME MONEY AND REVOLUTIONIZE THE NATION'S ECONOMY!
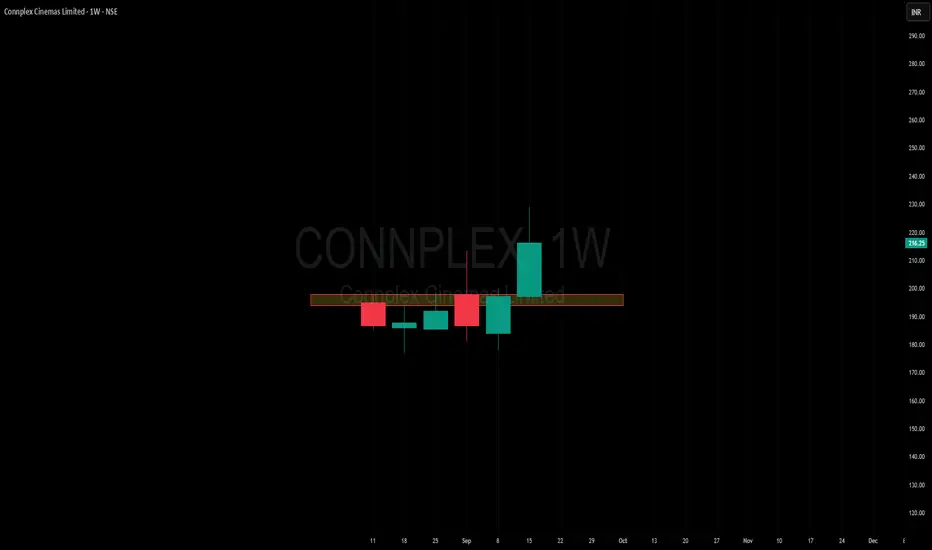
Amazing breakout on WEEKLY Timeframe - CONNPLEXCheckout an amazing breakout happened in the stock in Weekly timeframe, macroscopically seen in Daily timeframe. Having a great favor that the stock might be bullish expecting a staggering returns of minimum 25% TGT. IMPORTANT BREAKOUT LEVELS ARE ALWAYS RESPECTED!
NOTE for learners: Place the breakout levels as per the chart shared and track it yourself to get amazed!!
#No complicated chart patterns
#No big big indicators
#No Excel sheet or number magics
TRADE IDEA: WAIT FOR THE STOCK TO BREAKOUT IN WEEKLY TIMEFRAME ABOVE THIS LEVEL.
Checkout an amazing breakout happened in the stock in Weekly timeframe.
Breakouts happening in longer timeframe is way more powerful than the breakouts seen in Daily timeframe. You can blindly invest once the weekly candle closes above the breakout line and stay invested forever. Also these stocks breakouts are lifelong predictions, it means technically these breakouts happen giving more returns in the longer runs. Hence, even when the scrip makes a loss of 10% / 20% / 30% / 50%, the stock will regain and turn around. Once they again enter the same breakout level, they will flyyyyyyyyyyyy like a ROCKET if held in the portfolio in the longer run.
Time makes money, GREEDY & EGO will not make money.
Also, magically these breakouts tend to prove that the companies turn around and fundamentally becoming strong. Also the magic happens when more diversification is done in various sectors under various scripts with equal money invested in each N500 scripts.
The real deal is when to purchase and where to purchase the stock. That is where Breakout study comes into play.
LET'S PUMP IN SOME MONEY AND REVOLUTIONIZE THE NATION'S ECONOMY!