Breakout Trading: How Low Win-Rate Systems Beat the Market█ Breakout Trading: How Low Win-Rate Systems Beat the Market
Most traders misunderstand breakout strategies. They expect high win-rates, smooth equity curves, and clean continuation.
But real breakout systems operate differently:
Low win-rate
Many small losses
Occasional massive winners
And long periods of nothing
A breakout strategy is not about predicting direction. It is about exploiting asymmetry, volatility expansion, and structural price imbalances. It is not about being right often; it is about being paid well when you are right.
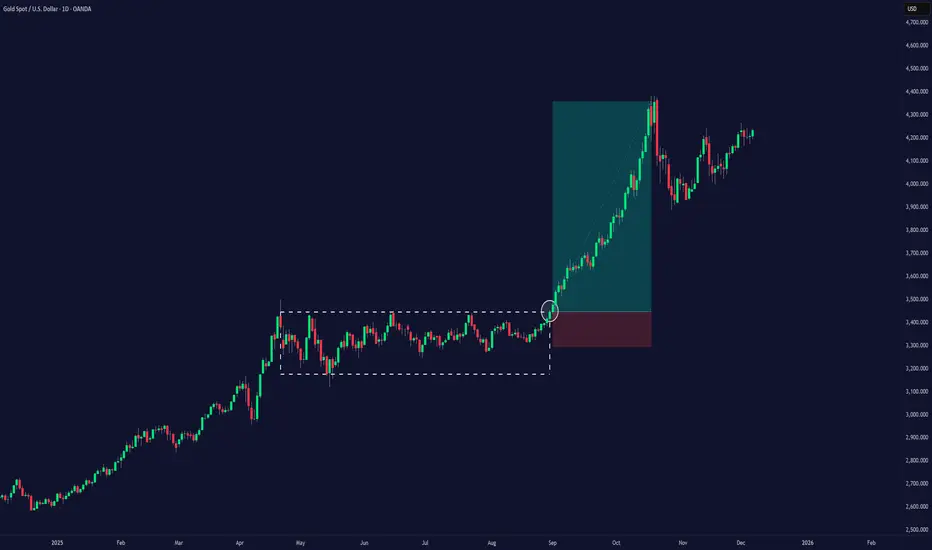
█ What a Breakout Really Is
A breakout occurs when the price finally moves out of a range or breaks through a key level. It is not magic, and it is not random. It is mechanics, liquidity, and pressure.
Inside a range or right at a major level:
Liquidity builds on both sides
Stops accumulate above resistance and below support
Traders wait for confirmation
Algorithms sit idle during volatility contraction
When price pushes through a key level, it triggers a chain reaction:
stop orders → breakout entries → momentum algos → forced exits. This cascade is what creates the explosive leg everyone tries to catch.
In simple terms , a breakout happens when the price moves outside a well-defined support or resistance zone with strong momentum. This surge often marks the beginning of a new trend, a volatility expansion, or a major shift in market sentiment.
Breakouts appear in every asset class: stocks, futures, crypto, forex, and commodities, and on every timeframe from minutes to weeks. They are popular because when they succeed, they can deliver large, rapid moves and outsized profits.
But here is the part most traders ignore:
Most breakouts do not follow through. False breaks are common, and markets have become more efficient over time. Only breakouts with the right conditions, such as momentum, liquidity imbalance, and volatility expansion, have a high probability of running.
█ The Truth Most Traders Don’t Want to Hear
Most breakouts fail. Even strong breakout systems may only win 20 to 40 percent of the time.
Why does this happen?
Many breakout levels are weak
Liquidity is thin around obvious highs and lows
Algorithms hunt stop clusters before the real move
Price often snaps back into the range before expanding
But here is the part that actually matters:
Breakouts do not need a high win rate.
They need high asymmetry.
Small, controlled losses.
Occasional large, runaway winners.
This is the core structure behind every profitable breakout strategy.
⚪ Win-Rate and Risk/Reward: What Traders Should Actually Expect
The simple overview above is backed by decades of quantitative research. Breakout systems consistently show low win-rates but high R-multiple payoffs, and this is not an opinion. It is a measurable statistical pattern across markets and timeframes.
1. Low Win-Rate Is Normal and Expected
Across studies, breakout strategies typically win between 20 and 40 percent of the time.
Research by Bulkowski, academic momentum studies, and intraday ORB tests all show the same thing:
Breakouts frequently fail
Modern markets generate more false breaks than in the past
Algorithms exploit obvious levels and stop clusters
Short-term price action is dominated by mean reversion
A low hit rate is not a flaw. It is the natural behavior of breakout mechanics.
2. The Edge Comes From Asymmetric Payoff Distribution
A breakout strategy becomes profitable not by winning often, but by winning big relative to the risk taken.
Historical performance shows:
Losers: usually −1R
Winners: often +3R, +5R, +10R and beyond
When a system captures even a few of these extended moves, it more than pays for the many small stop-outs.
3. Breakout Systems Exploit Fat Tails and Volatility Expansions
Financial returns are not normal. They are fat-tailed. Breakouts are designed to capture these rare, outsized price moves.
The return distribution typically looks like:
Many small losses from failed breaks
A few large wins during volatility expansion
Long flat periods during range-bound conditions
Occasional massive trends that define the entire year
This right-skewed distribution is well-documented in momentum and trend-following research.
4. Academic and Quant Research Confirms the Pattern
Multiple studies validate the same expectations:
Zarattini, Barbon & Aziz (2024): ORB strategy on “stocks in play” produced over 1,600 percent return with modest win-rates
Moskowitz, Ooi & Pedersen: Trend-following (a breakout variant) shows positive expectancy across a century of data
Bulkowski: Breakout failure rates increase over time, confirming the need for filters and asymmetry
CTA/Managed Futures: Long-term breakout systems show strong convexity; a few big winners generate the majority of returns
The conclusion is clear:
Breakout strategies work when they harness asymmetry, not prediction.
█ Example: Breakout System 1
Win-rate: 20.28%
Breakout System Gain: +274%
Buy & Hold Gain: +96%
Explanation of the chart:
Flat periods → range markets
Dips → false breaks and stop-outs
Explosive steps upward → successful breakouts that trend hard
This step-like equity curve is the fingerprint of all trend-and-breakout systems.
█ Example: Breakout System 2
This system shows the same profile:
Many trades fail, but losses stay small
Occasionally a breakout runs far enough to cover dozens of losses
The equity curve’s “zig-zag then spike” pattern is normal behavior
The system wins big because the winners are massive R-multiples, not because it’s right often
This is the signature of low win-rate, high reward asymmetry.
█ The Real Mechanics Behind a Successful Breakout
A real breakout is powered by multiple forces hitting at once:
New longs entering / new shorts entering (initiative flow)
Stops being triggered (forced participation)
Short covering or long liquidation (fuel)
Algos joining the momentum (acceleration)
Volatility expansion is making moves larger
⚪ Read more about what makes prices move up and down:
█ What Makes Breakout Strategies Hard for Humans
Breakout trading is psychologically painful because:
You lose often
You sit through boring periods
Most trades look like “nothing happens”
Only a few trades create 80–90% of the long-term profits
To succeed, you need:
Patience
Small, consistent risk
The discipline to let winners run
The acceptance that many trades will fail
Breakout success = emotional resilience + asymmetry, not prediction.
█ The Takeaway
Breakout strategies are simple in theory and brutal in practice:
Low win-rate
High reward
Long quiet periods
Occasional massive expansions
Step-like equity curves
Outperformance through asymmetry
In the end:
You don’t trade breakouts to be right often — you trade breakouts to get paid big when the market finally moves.
-----------------
Disclaimer
The content provided in my scripts, indicators, ideas, algorithms, and systems is for educational and informational purposes only. It does not constitute financial advice, investment recommendations, or a solicitation to buy or sell any financial instruments. I will not accept liability for any loss or damage, including without limitation any loss of profit, which may arise directly or indirectly from the use of or reliance on such information.
All investments involve risk, and the past performance of a security, industry, sector, market, financial product, trading strategy, backtest, or individual's trading does not guarantee future results or returns. Investors are fully responsible for any investment decisions they make. Such decisions should be based solely on an evaluation of their financial circumstances, investment objectives, risk tolerance, and liquidity needs.
Breakoutsignals
FVRR - In-Depth Chart Analysis and Why I'm ExcitedVery predictable patters on this chart and clear signal of teal being in control on HTF which can lead to an easy long play at least shorter term to teal resistance above.
Obviously we have to prove more for a higher time frame confirmation and trade such as strong buying continuation and further buy side and sell side tapering.
But I like this Risk/Reward opportunity for my portfolio with some buying continuation or longer term with further tapering
Happy Trading :)

BTC Last Support we holding a critical support above the 18k$, which we tested many times, however we still holding above it , we need to accumulate and hold in order to retest the 23600$ first sign of bullish strength for BTC if we broke it , and then going to the most important level for this year which is the 30k$.
breaking the 18k$ and closing 1D candle red below it , will make us go to the bottom price for BTC above the 13$+.

$QOMUSDT next entry PTs 0.0000000279-0.0000000310-0.00000003369 QOM Price Today
Shiba Predator price today is $0.000000039504 with a 24-hour trading volume of $1,127,896. QOM price is down -6.5% in the last 24 hours. It has a circulating supply of 600 Trillion QOM coins and a total supply of 600 Trillion. If you are looking to buy or sell Shiba Predator, LBank is currently the most active exchange.
What was the highest price for Shiba Predator?
Shiba Predator hit an all time high of $0.000000380671 on Apr 03, 2022 (5 months).
What was the lowest price for Shiba Predator?
Shiba Predator had an all time low of $0.000000028138 on Jun 14, 2022 (3 months).
What was the 24 hour trading volume of Shiba Predator?
The 24 hour trading volume of Shiba Predator is $1,127,896.
Where can Shiba Predator be traded?
You can trade Shiba Predator on LBank, Uniswap (v2), and BKEX. Popular trading pairs for Shiba Predator in the market includes QOM/USD, QOM/CAD, QOM/AUD, QOM/GBP, QOM/INR, and QOM/PHP.
QOM is the Shiba Predator, it is a community token whose function is to flip the Shiba Market cap.

#near $NEAR with a HUGE breakout todayNEAR is closing a huge 4h breakout candle outside of the 3.6 resistance level
we just need a succesful retest of the one to enter a long position now
if the scenario gets confirmed, these are the levels I'm watching:
TP: 4.18
SL: 3.5
let me know if you found this idea helpful and if you are going to enter the trade!
also dont forget to follow me, leave a like, and if you want to request a technical analysis , just comment the ticker of the cryptocurrency you want me to analyse down here!

Dogecoin 14-15 cents target once this happens!🚀Traders,
Just thought I'd throw out a quick chart here. Looks like we've got an inverse Head and Shoulders pattern appearing on the 4 hr chart. Target shows as 14 cents. This would be the first. Above that you have the 100 day moving average at around 15 cents and descending. This would be the second target.
Entry signal:
You want to wait for confirmation on the 4 hour chart. Confirmation #1 is a move above the 200 candle (descending red line). Confirmation #2 is a move above our level of resistance at 12.46 cents. You want to see a candle close above this. For those with a lower risk tolerance, you might want an additional candle to open and close above this resistance threshold.
Some of you may want to watch the video I did on this showing you how I found our targets and more (see "Link to Related Ideas" below)
Happy trading my friends!

DENT/USDT Moving UpDENT in 30 min chart is now on way to move forward. Look for group message to see targets. This can reach as high as 0.008000 in short term. Momentum is bullish.


BLOK/USDT LongBlok Usdt looks to challenge previous highs. Sentiment on this token is strong. It could deliver some profits. Make sure to check us out for targets and updates.

RMRK/USDT Breakout IncomingWe are at a mega support in a trending up channel here for RMRK. We can see huge upside potential, follow channel for signal and analysis! Follow like, enjoy profits!
