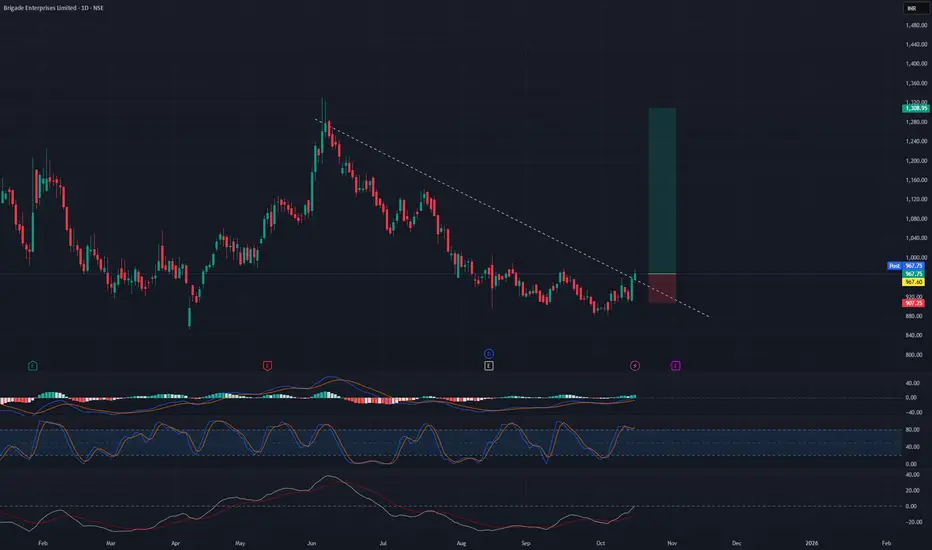
Breakout trading in BRIGADESwing trading opportunity in BRIGADE.
Entry - 970
Targets - 1130 & 1300
SL - 904
DISCLAIMER: I am not SEBI registered and the ideas posted are only for educational purpose. Do a proper analysis and always trade with STOP LOSS.
Breakouttrading
US100: Breakout signals a strong second bullish leg🧩 Market Context
On the 30-minute chart, SKILLING:US100 index shows renewed bullish momentum after a phase of sideways consolidation. Following a deep correction, price action has started forming higher highs and higher lows, suggesting that buyers are gradually regaining control.
🔍 Price Structure and Breakout
Price has recently broken out above a short-term consolidation zone and a rising trendline.
This breakout reinforces the short-term bullish bias and could mark the start of a second upward leg in the current recovery.
Statistically, when a breakout happens after tight accumulation, the next bullish leg often becomes equal to or larger than the previous one, as momentum builds and buyers gain confidence.
📈 Key Price Levels
• Resistance 1: 24,914 – prior rejection zone in the last upward move.
• Resistance 2: 25,074 – distribution area before the previous drop.
• Support: 24,700 – 24,750 (former resistance now acting as potential support).
⚙️ Trading Scenarios (for observation only)
• After the breakout, price may retest the previous resistance zone (around 24,700–24,750) before continuing higher.
• If buyers defend this level, the second bullish leg could extend toward 24,914 and possibly 25,074.
• Conversely, a close back below 24,700 may trigger a deeper pullback before any continuation attempt.
🧠 Summary
The technical structure on US100 favors a short-term bullish outlook. A successful retest of the breakout zone could pave the way for a second upward leg, potentially matching or exceeding the size of the previous rally.
______________________________________
📌 This analysis is for educational and technical purposes only. It does not constitute financial advice or a recommendation to buy or sell any asset.
Please like and comment below to support our traders. Your reactions will motivate us to do more analysis in the future 🙏✨
Harry Andrew @ ZuperView

Nzd/Usd - Breakout SetupMarked in red, located around the 0.57300 area. Price has tested this zone multiple times but failed to break above — indicating strong selling pressure.
Support Zone (S):
Marked in blue, around the 0.57100–0.57150 range. This zone has acted as a strong bounce area where buyers stepped in.
Scenarios:
Bullish Scenario:
If price holds above the Support (S) zone and breaks through the Resistance (R) zone with strong volume or bullish momentum...
Target: A move toward the next higher structure (likely around 0.57400+), as indicated by the top-right upward arrow.
Bearish Scenario:
If price fails to maintain above the Support (S) zone and breaks below it with strong bearish candles...
Target: A move downward to the next key demand area (likely around 0.56800), indicated by the bottom-right downward arrow and U.S. economic icon.
Trade Plan Considerations:
Wait for confirmation breakout of either the support or resistance zone.
Use volume or candlestick confirmation for entry.
Risk management: Place stop-loss just outside the zone boundaries (above R or below S).
Be cautious of news impact, as suggested by the U.S. economic icon — upcoming USD-related data could cause volatility.

Xau/Usd- Technical Outlook Range Bound with Breakout PotentialCurrent Price Movement:
The price is fluctuating just above the Support zone (marked in gray) and near the Resistance zone (marked in green). It’s oscillating between these two zones, suggesting a consolidation phase or a potential breakout.
Resistance and Support Levels:
Resistance is indicated by the green area, where price has previously faced upward rejection. If the price breaks this resistance level, it could signify further bullish movement.
Support is marked by the gray area, suggesting that if the price drops to this level, it has historically found buying interest, preventing further downward movement.
Price Target:
The chart marks target points above and below the current price levels. The arrows indicate expected price movement. The top arrow suggests an upward target if the price breaks above resistance, while the bottom arrow indicates a downward target if the price falls through support.
Trend Indication:
There is a slight upward trend in the price, as seen in the shape of the moving averages. This could indicate bullish momentum, but the market remains in a range (bound by support and resistance).
Key Focus for Traders:
Traders should monitor if the price breaks through the resistance or support levels. A breakout from the range could lead to a sharp move in the direction of the breakout.
Depending on how the price reacts at the support and resistance levels. Keep an eye on the breakout direction to confirm the next move.
BTCUSD – Bullish Continuation Expected from Demand Zone BITSTAMP:BTCUSD
🟢
Market Overview
BTC has been consolidating within a corrective pattern after a sharp impulsive rise from the same demand zone.
The zone has held multiple times, confirming strong institutional interest.
As long as price respects this area, bullish momentum is expected to resume, targeting mid-range liquidity levels and previous structural highs.
Key Scenarios
✅ Bullish Case 🚀 → 🎯 Target 1 113 100 | 🎯 Target 2 114 500 | 🎯 Target 3 116 000
❌ Bearish Case 📉 → Break and close below 110 700 may open move toward 109 700 – 108 700 support
Current Levels to Watch
Resistance 🔴 113 100 – 114 500
Support 🟢 110 700 – 109 700
⚠️ Disclaimer: This analysis is for educational purposes only. Not financial advice.

The Bull’s Call: HFCL Joins the Uptrend League!HFCL Technical Update (1-Hour Timeframe)
HFCL is currently moving within a well-defined parallel channel. The stock has established a strong support zone around the ₹72–74 range on the shorter timeframe, while the key resistance is observed near ₹90.
At present, the stock is trading close to the Line of Polarity (LOP). A breakout above the mid-channel level could lead the price toward its upper resistance zone.
If the support zone holds, we may witness further upside momentum in HFCL in the coming sessions.
Thank you !!!!

Swing trade opportunity in INOX WINDSwing trade opportunity in INOX WIND.
Entry - 150
Targets - 175 & 190
DISCLAIMER: I am not SEBI registered and the ideas posted are only for educational purpose. Always trade with proper STOP LOSS.

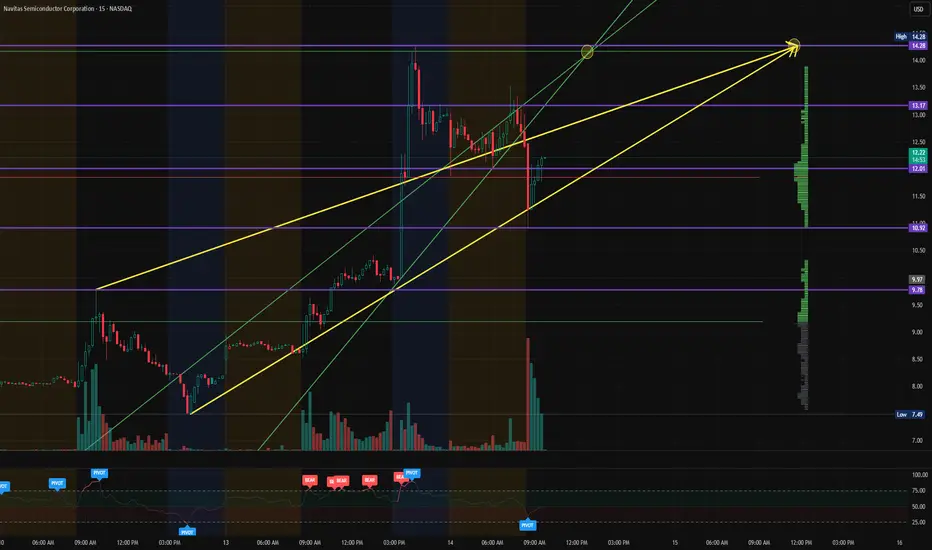
$NVTS - Navitas Semiconductor - $14.28 RetestNASDAQ:NVTS broke out on Friday to $5.78 before pushing up to $14.28 in yesterday's After-Hours. It consolidated to $10.92 before pushing back forward. We're looking for a Continuation to retest $14.28.
$DFLI - Dragonfly Energy - $2.26Entered NASDAQ:DFLI at $1.53 after seeing Volume Spikes and Push to break the $1.58 Price Levels. We are looking to the reaction at $1.64 with a $2.26 PT

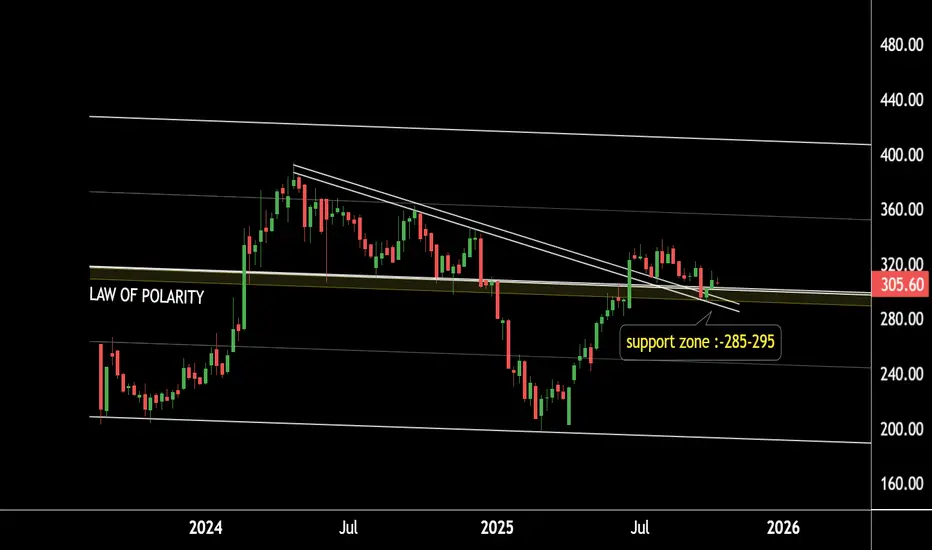
All Set for the Next Move — JIOFIN Ready to Fly High!JIOFIN Weekly Chart Analysis
JIO Financial is showing strong price action on the weekly timeframe.
The stock is currently holding above a key law of polarity support zone around the ₹285–₹295 range.
It is also sustaining above its breakout level, with the retesting zone aligning near ₹285–₹300.
If this zone continues to hold, we may witness higher levels in JIOFIN in the coming sessions.
Conclusion:
Holding above 285–300 could trigger the next bullish leg.
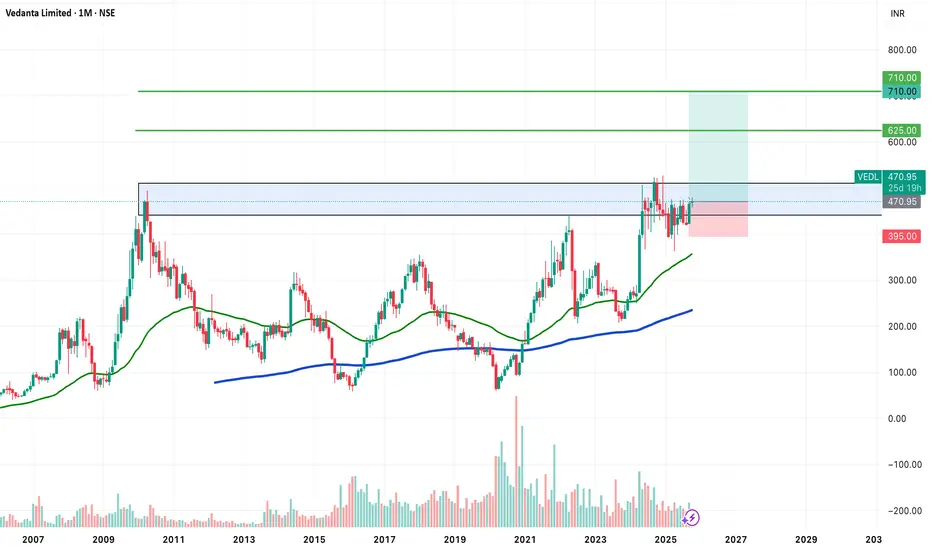
POSITIONAL IDEA - VEDANTA (VEDL)Vedanta Ltd , one of India’s leading diversified natural resources companies, is showing a strong long-term breakout setup supported by powerful technical signals.
Reasons are listed below :
Attempting a multi-year breakout after nearly 14 years of consolidation
Potential VCP (Volatility Contraction Pattern) breakout forming
Bullish engulfing candle on the monthly timeframe
Consolidating near all-time highs, showing strength in price structure
Trading above 50 & 200 EMA on both weekly and monthly charts
Maintaining a clear higher-high, higher-low trend structure
Target - 625 // 710
Stoploss - monthly close below 395
DISCLAIMER -
Decisions to buy, sell, hold or trade in securities, commodities and other investments involve risk and are best made based on the advice of qualified financial professionals. Any trading in securities or other investments involves a risk of substantial losses. The practice of "Day Trading" involves particularly high risks and can cause you to lose substantial sums of money. Before undertaking any trading program, you should consult a qualified financial professional. Please consider carefully whether such trading is suitable for you in light of your financial condition and ability to bear financial risks. Under no circumstances shall we be liable for any loss or damage you or anyone else incurs as a result of any trading or investment activity that you or anyone else engages in based on any information or material you receive through TradingView or our services.
@visionary.growth.insights
City Union Bank on Retest of Breakout Zone — Momentum Ahead?City Union Bank (CUB) – 4-Hour Chart Analysis
CUB is moving within a well-defined falling channel. Recently, it successfully broke out above the resistance zone at ₹210 and has retested this level, confirming it as support.
The stock is also respecting the Supertrend support on every pullback, continuing to make new highs. Currently, CUB is holding the Supertrend support and is likely to test the channel resistance around ₹240–250.
If the support zone between ₹200–210 holds, we can anticipate further upside in CUB.
Thank You !!

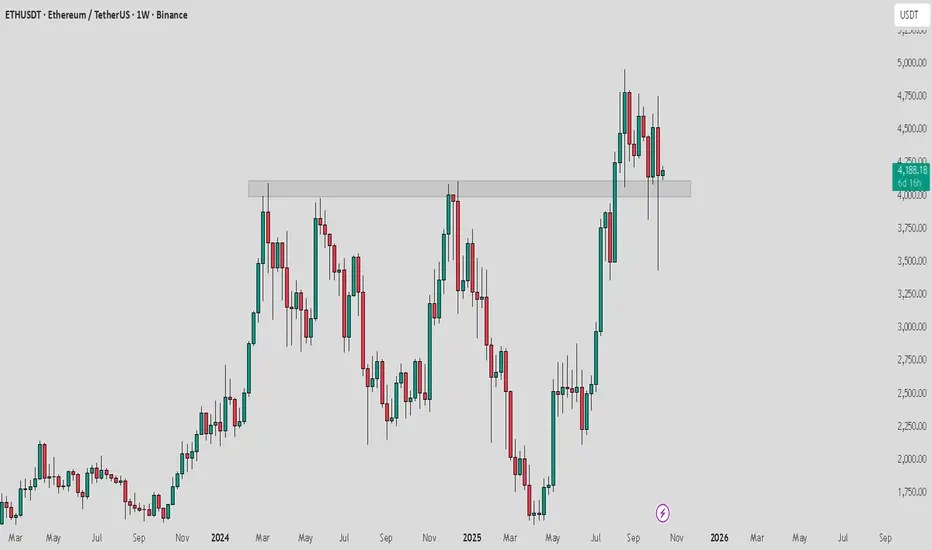
Ethereum is looking strong to bounce back from supportETH is bouncing back from key support and still showing potential for a bullish rally towards $5,000 in the coming days.
Momentum looks constructive — manage risk wisely and monitor key levels closely.
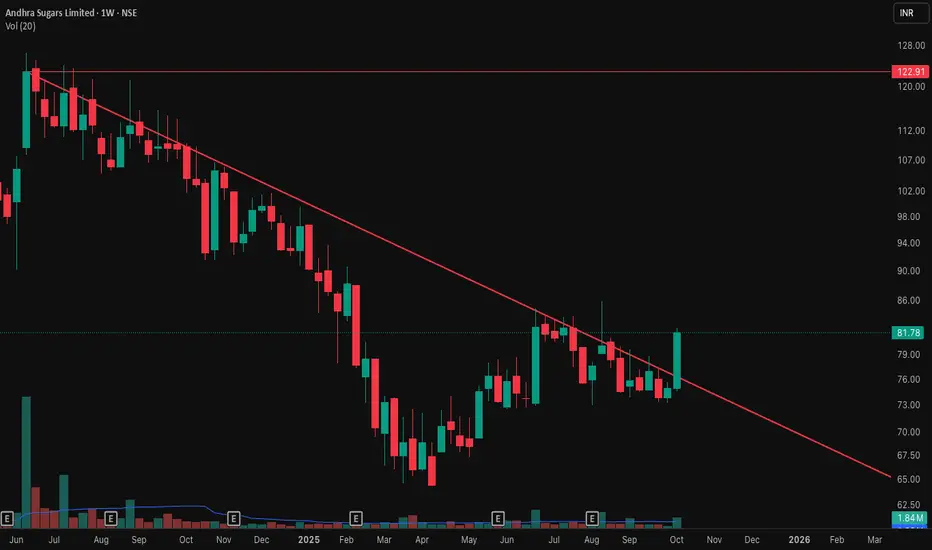
Andhra Sugars Ltd - Weekly Chart📊 Andhra Sugars Ltd – Trendline Breakout on Weekly Chart 🚀
📅 Chart Date: October 12, 2025 | Timeframe: Weekly
📈 CMP: ₹81.78 (+9.01%)
📍 Symbol: NSE:ANDHRSUGAR
🔍 Technical Analysis
📉 Downtrend Line Broken After Months of Consolidation
The stock had been trading under a strong falling trendline since mid-2024.
This week’s bullish candle successfully closed above the trendline, indicating a potential reversal from the long-term downtrend.
💥 Volume Confirmation
Noticeable rise in weekly volume (1.84M) compared to the recent average of 1.06M, showing buying interest emerging from the support zones.
🟡 Key Resistance Level: ₹122.91 (previous swing high from June 2024).\
A breakout and weekly close above ₹123 could confirm a major trend reversal and open up higher targets.
📌 Key Levels
Immediate Support (Breakout Retest Zone): ₹75–₹77
Resistance Zone: ₹122.91
Next Targets: ₹95 / ₹110 / ₹123
Stoploss (Weekly Close Basis): ₹70
⚠️ Disclaimer
This analysis is for educational and charting purposes only. Not financial advice. Please do your own research before making any investment decisions.
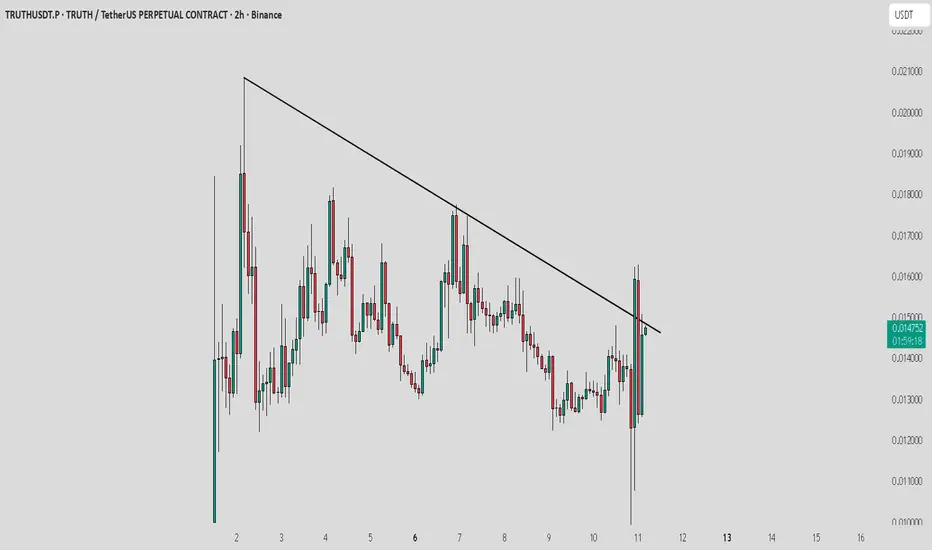
TRUTH / USDT : Showing strength after huge market dumpTRUTH / USDT is showing strength after yesterday’s pullback. If the next candle takes support from the trend line resistance, it could confirm continuation and offer a good profit opportunity.
Keep a close watch and trade with proper risk management.
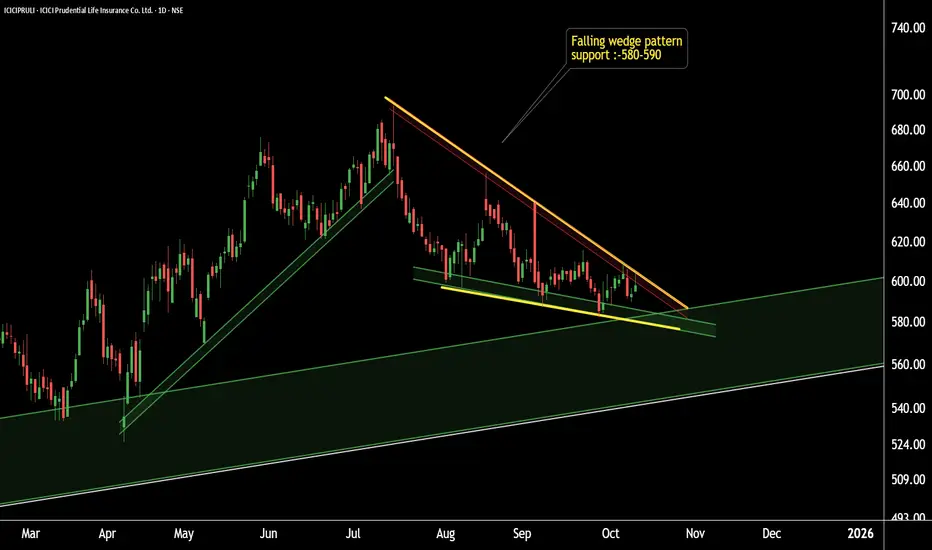
ICICIPRULI – Hidden Pattern Unlocked! Reversal or Continuation?ICICIPRULI Pattern Reveal
This is the daily timeframe chart of ICICIPRULI.
The stock is forming a falling wedge pattern, which is a bullish reversal setup.
Currently, ICICIPRULI is holding strong support near the 580–590 zone based on pattern structure.
If this level sustains, we may see higher prices in the coming sessions.
Thank You !!
US100: Imbalance rejection – Bears back in control
🧠 SKILLING:US100 Technical Analysis
🧱 Resistance Zone (Imbalance)
• The 24,900 – 24,950 area acts as a strong resistance, overlapping with a supply/imbalance zone.
• Price has reacted bearish from this level, showing clear selling pressure.
• This is a potential area to look for short (Sell) setups.
________________________________________
📉 Current Market Structure
• After a sharp bullish retracement, price formed a rising channel 🔵.
• However, inside the highlighted circle, price has broken down from the channel — indicating weakening bullish momentum.
• This breakdown supports a short bias in the short term.
________________________________________
💡 Trade Plan
• Bias: Look for Sell setups near the resistance zone.
• Confirmation: Wait for a small pullback and a new lower high before entering short.
• Target (TP): Toward the Support zone 24,740 – 24,868 (previous bottom).
• Stop Loss (SL): Above resistance at around 24,950 – 25,000.
________________________________________
🟢 Support Zone
• The 24,740 – 24,780 area is the previous bottom, where price previously bounced strongly.
• This level might attract profit-taking from sellers or temporary buying interest.
________________________________________
⚠️ Risk Notes
• If price closes above 25,000 (H1 candle), the bearish scenario becomes invalid.
• Manage position sizing carefully and wait for clear confirmation before entering a trade.
________________________________________
🧭 Summary
• Short-term Trend: 🔻 Bearish correction
• Mid-term Trend: 🔄 Sideways – waiting for a breakout of either 24,740 or 25,000.
• Current Opportunity: Sell from resistance → Target support zone
Please like and comment below to support our traders. Your reactions will motivate us to do more analysis in the future 🙏✨
Harry Andrew @ ZuperView

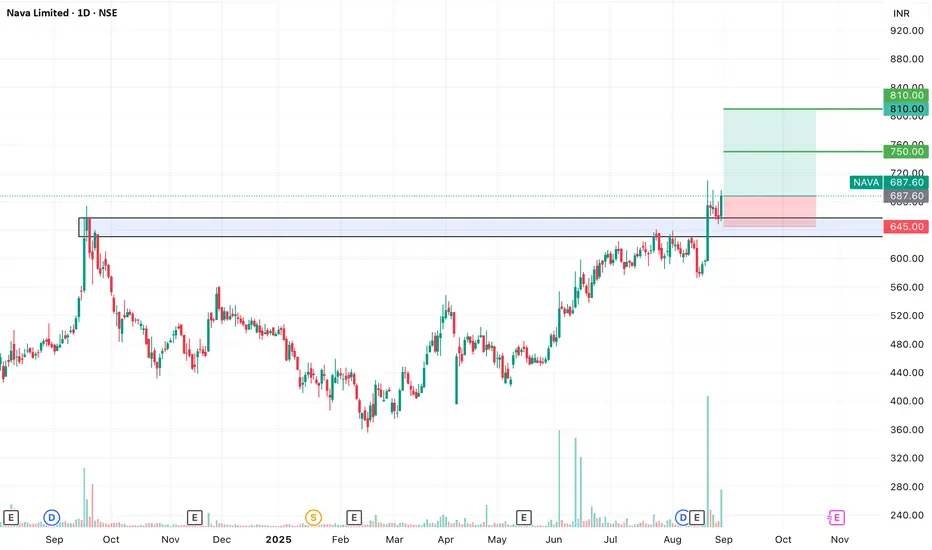
SWING IDEA - NAVA Nava Ltd , a diversified natural resources and energy company, is showing a promising swing opportunity with a breakout backed by strong technical signals.
Reasons are listed below :
Cup and Handle breakout, a strong bullish continuation pattern
Confirmed bullish price action post breakout
Bullish engulfing candle on the daily timeframe
Volume spike, confirming breakout strength
Trading near its 52-week high, showing momentum
Sustaining above 50 & 200 EMA on the daily chart
Target - 750 // 810
Stop loss - daily close below 645
DISCLAIMER -
Decisions to buy, sell, hold or trade in securities, commodities and other investments involve risk and are best made based on the advice of qualified financial professionals. Any trading in securities or other investments involves a risk of substantial losses. The practice of "Day Trading" involves particularly high risks and can cause you to lose substantial sums of money. Before undertaking any trading program, you should consult a qualified financial professional. Please consider carefully whether such trading is suitable for you in light of your financial condition and ability to bear financial risks. Under no circumstances shall we be liable for any loss or damage you or anyone else incurs as a result of any trading or investment activity that you or anyone else engages in based on any information or material you receive through TradingView or our services.
@visionary.growth.insights
S / USDT : Momentum looking strong..Strong rally aheadS is breaking out from trend line resistance with strong potential. Momentum looks solid, and if the breakout sustains, we can expect a bullish rally towards $0.34 – $0.38 – $0.42 in the short term.
Wait for confirmation and manage risk wisely

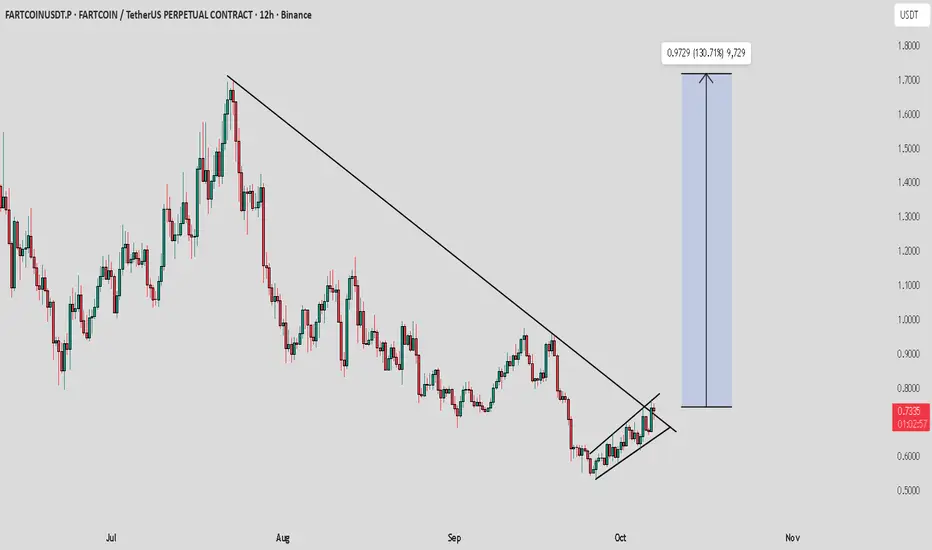
FARTCOIN / USDT : Breaking out with good momentumFARTCOIN is breaking out from trend line resistance and showing improving momentum. If this breakout holds, we can expect a bullish rally towards $1.0 – $1.3 – $1.5 in the short term.
Always wait for confirmation and manage risk wisely.
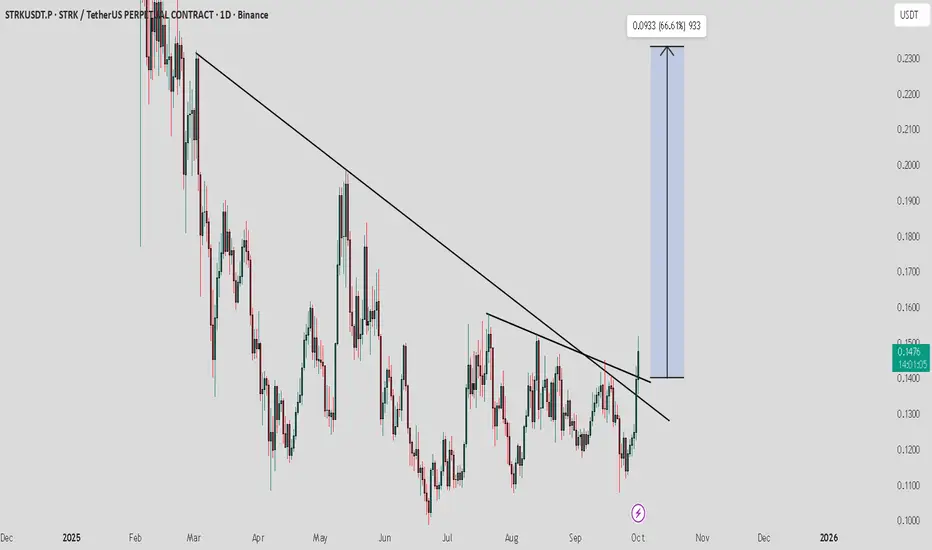
STRK / USDT : Showing strong moemtum for a bullish rallySTRK/USDT Analysis
STRK is showing strong momentum and has confirmed its breakout. If this move holds, a bullish rally towards $0.20 – $0.25 is likely in the short term.
Always manage risk wisely and avoid chasing entries without proper confirmation.
$RR - Richtech Robotics - $7.25 RetestNASDAQ:RR (Richtech Robotics) continues its breakout trend, now holding above $6.50 after reclaiming key $5.70 support.
Momentum volume is accelerating as automation and AI robotics names heat up again.
Channel projections show room toward $7.25–$7.60 in the near term if bulls hold trend support.
#RichtechRobotics #RR #AIStocks #Automation #NASDAQ #MomentumTrading #MyMIWallet

$DVLT - #DataVault #AI - $2.68 PTNASDAQ:DVLT has officially broken out above $2.00 after multiple retests of the $1.10–$1.40 range last week. Momentum remains strong following its IBM partnership news, and price action is respecting an ascending channel projecting toward $2.50–$2.80.
A clean hold above $1.74 could confirm continuation — eyes on the next leg up.
#DatavaultAI #DVLT #AI #AIStocks #MomentumTrading #NASDAQ #StockMarket
