BTR LIVE TRADE SETUP | BSE LTD | 20 JAN 2026📈 BTR LIVE TRADE SETUP | BSE LTD | 20 JAN 2026
BTR Price Action Indicator triggered a clean BUY signal on BSE LTD 🔥
This is a live market setup, not a post-market update.
🔹 Buy Entry: 2705
🎯 Target 1 (Intraday): 2743
🎯 Target 2 (Swing): 2794
⏰ Intraday Exit Time: 3:20 PM (if targets not achieved)
📌 Intraday traders: Book profits at T1 or time-based exit
📌 Swing traders: Hold for Target 2 with BTR discipline
No prediction.
No emotion.
Just pure price action + BTR structure.
If you are confused → don’t trade.
If you trust rules → follow BTR.
📊 Instrument: BSE LTD
🧠 Indicator Used: BTR Price Action
⚡ Mode: Live Trading Setup
NSE:BSE
BSE

31 Dec 2025 — Last Trading Day of the Year (Wining +15 Points)🚀 Thank You Traders!
Wishing everyone a powerful & profitable journey in 2026 with the BTR Price Action Indicator.
2025 was just the beginning…
BTR Price Action launched in Dec 2025 — and even with just one month of live testing, we saw consistent clarity, clean entries, and multiple winning trades.
📌 Today’s Trade — BSE LTD
Timeframe: 15M
Signal: Long (Buy)
Entry: 2620
Exit: 2635
Profit: +15 Points in Intraday 💥
➡️ Market conditions didn’t matter.
➡️ No noise, No confusion.
➡️ Just follow BTR.
🔄 What Happened
BTR Price Action generated a fresh long signal
Entry Activated at 2620
Target Reached → Exit at 2635
Another Winning Trade to close the year 🎯
🔥 2026 Vision
2026 = Full Year of Trading with BTR
📈 More setups
📈 More confidence
📈 More rule-based entries
📈 More discipline
📈 More success stories
I’ll share a complete recap of all December 2025 trades soon.
Stay tuned!
💡 Want to Start with BTR?
📌 Go to my TradingView Profile → Scripts Section
📌 Add BTR Price Action Indicator
📌 Start trading with clarity, not chaos.
🚀 Happy New Year in Advance 🥳
Follow BTR. Follow Discipline.
Let’s Win 2026 Together. 💙📊

BTR Update | 29 Dec 2025 |No Trade Day in BSE LTD|No Trade Day in BSE LTD
Because BTR Indicator did NOT generate any new signal today.
We respect the system → No Signal = No Trade ✔
🕮 Market Context
📌 The Bearish Signal from 24 Dec 2025 is still active
➡️ No exit signal yet for investors / swing traders
➡️ Intraday traders stay flat until a fresh signal appears
This is why trading with BTR becomes easy:
We don’t predict, we follow.
We wait for the system.
📍Key Takeaways
Don’t force trades
Protect capital on silent days
Follow signals, not emotions
System consistency beats guessing
👇 Want to Trade with BTR?
📌 Find the BTR Indicator in my TradingView Profile → Scripts Section
📌 Add to chart & start learning the entries/exits
📌 No noise. No confusion. Just clarity.
Follow BTR. Follow Process.
Market rewards patience. 🚀

BSE Intraday Trade — 17 Dec 2025 | Trend Bullish Win (+50Market Bearish, System Bullish — Discipline Delivered Again
Today the overall market sentiment was bearish, yet the BTR Auto Buy/Sell Indicator generated a clear bullish signal in BSE Ltd.
By trusting the system instead of market bias, this trade delivered a clean intraday profit.
📊 Trade Execution
🟢 Entry: 2617
— Buy triggered when BTR generated a bullish signal near demand
🎯 Target-1 Hit: 2670
— +50 Points Booked
🔴 Alternative Exit (System-Based): 2635
— If target was not booked, BTR generated an exit signal, still locking profit
🔍 Trade Context
• Stock: BSE Ltd
• Timeframe: 15-Minute
• Market Bias: Bearish
• Trade Type: Counter-trend BUY
• Confirmation: Strong Demand Zone
BTR focuses on price behavior and structure, not emotions or opinions.
📈 Result:
✔ Best case: +50 points
✔ Worst case: +18 points
✔ Both outcomes profitable
🧠 Why This Trade Worked
✔ Entry aligned with demand zone
✔ Strong impulsive move after signal
✔ Partial or full profit booking possible
✔ System-defined exit removed greed
This is the power of having both targets and exit rules.
📌 Key Lesson for Intraday Traders
You don’t need to predict the market direction.
You need:
• A rule-based entry
• A defined profit plan
• A system exit to protect gains
BTR gives structure first, profit second.
📍 Final Note
Whether you booked:
• 50 points at target, or
• Exited at BTR signal,
👉 the trade stayed profitable and disciplined.
📌 Follow for daily intraday trade setups
💬 Private Message for BTR Indicator & usage rules
Trust the signal. Manage the trade. Stay consistent. 📊🔥

My BSE Intraday Trade Setup 05 Dec 2025For All Intraday Lovers – Follow for Live Trade Setups & DM for Strategy Details
Today I explored a clean intraday opportunity in BSE Ltd using my BTR Auto Buy/Sell Signal System.
Here’s the complete breakdown of why this setup worked beautifully:
📌 Why I Chose BSE Today
✔ Perfect Intraday Volatility – Smooth swings, no wild spikes
✔ High-quality structure around demand & supply zones
✔ Works amazingly with algorithmic signals
⏱ Timeframe Used
➡️ 15-Minute Chart – My preferred timeframe for intraday traders
Stable… Reliable… Noise-free…
📊 Indicator Used
🚀 BTR Auto Buy/Sell Trend System
✔ Proven 70% win rate
✔ Generates clean Buy/Sell signals
✔ Non-repaint logic for stable intraday entries
🎯 Entry Logic
🔹 Enter ONLY when BTR generates a fresh Buy/Sell signal
🔹 Align with demand/supply zones for best accuracy
🔹 Today’s Buy came perfectly from the Demand Zone
🔹 Captured a smooth +30 points intraday move
🏁 Exit Strategy
🎯 Targets: 25 / 50 / 75 / 100 points
🛡 Stop Loss: Day Swing Low/High
(Keeping SL outside noise ensures high reliability)
📈 Today’s Live Example: BSE Trade – 15 Min Chart (05/12/2025)
✔ Demand Zone created
✔ BTR gave a clean Bullish Signal
✔ Entry triggered
✔ Smooth intraday uptrend
✔ Exit achieved with 30 points profit
Chart attached for full transparency.
⚡ Want More Live Intraday Setups?
💬 DM Me for BTR System access
📌 Follow for real-time setups & intraday guidance
Trade smart. Trade disciplined. Trade BTR.

IIFLIIFL FINANCE LTD has breakout hand and shoulder pattern TGT up to ATH resistance level, and this is just for educational purpose not any buy and sell recommendation

MAHINDRA & MAHINDRA FINM&M FINANCIAL SERVICES LTD has breakout 7 years long resistance so TGT are mation in chart, and this is just for educational purpose not any buy and sell recommendation

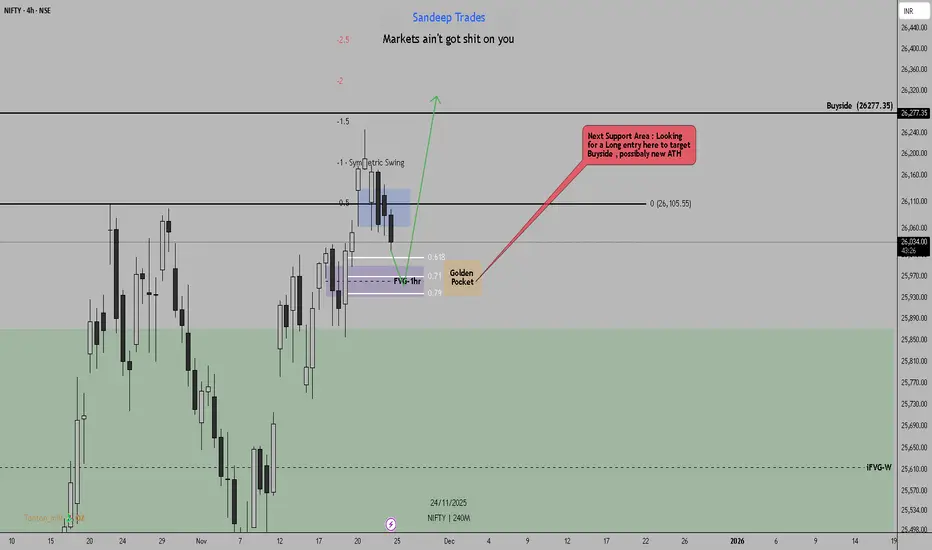
Nifty50 4hr Chart Analysis-Nov 30, 2025Nifty50 4hr Chart Analysis-Nov 30, 2025
Case1:
*Expecting 4hr to drop to Daily Support Level (iFVG-D), which almost 50% of current range.
Case2:
*If nifty goes for a deeper retracement then expecting 0.79 which is also a 4hour Support level (+OB-4hr)

Nifty50 4Hour Chart Analysis: Setup Longs Nifty50 4Hour Chart Analysis: Setup Longs
*4hr iFVG(Purple rectangle) which is also Golden Pocket area on Fib retracements.
*Will be looking for a long setup there to target Buyside(previous ATH)
How I frame my Bias on Stocks? Part 1. Showing multiple examples of stock delivery and how you can do the same on a 5min timeframe

NIFTY 50 Bullish Scenario: Weekly ChartNIFTY 50 Bullish Scenario: Weekly Chart
* Expected next couple of weeks Bullish and upside target is 26277.
* We might get a retracement day when we hit previous short term high (27107.10) which will be a good opportunity to add longs for
*Area market with green rectangle is SR flip/Support , price recently showed are strong upside reaction from this are.

BSE Ltd: Breaking 6-Month Downtrend | Major Reversal SetupSTRONG BUY Setup 📈
Entry: ₹2,678-2,690 (Current Level)
Target 1: ₹2,720-2,740
Target 2: ₹2,777-2,800
Target 3: ₹2,826-2,850
Target 4: ₹2,875-2,900+ (Extended)
Stop Loss: ₹2,636
Technical Rationale:
MASSIVE BREAKOUT from 6-month falling wedge/channel (blue shaded area)
Explosive +9.07% surge with exceptional volume spike (20.3M - highlighted in cyan)
Breaking above descending trendline resistance decisively
Breaking out of "Breakout Zone" (2,500-2,636) marked on chart
Trading well above EMA (2,452.55) - strong bullish reversal
RSI at 69.05 - strong momentum with room before overbought
Price reclaiming all key moving averages
Financial services stock benefiting from market rallies
Volume is highest in months - institutional accumulation
Multiple resistance levels mapped: 2,720, 2,777, 2,826, 2,875
Clear support at breakout zone 2,636-2,650
Classic falling wedge breakout - one of most reliable bullish patterns
Risk-Reward: Excellent 1:5+ ratio for extended targets
Pattern: Falling Wedge Breakout on Daily Chart - extremely bullish reversal pattern after months of consolidation
Strategy: Medium-term swing to positional (weeks)
Book 20% at T1 (2,730), 20% at T2 (2,790), 20% at T3 (2,840), trail remaining 40% with SL at 2,700 after T1
This could be start of major uptrend
Key Levels:
Breakout Zone: 2,636-2,650 (critical support now)
Strong Resistance: 2,720, 2,777, 2,826, 2,875
Major Support: 2,636, 2,600
Timeframe: Daily chart - suitable for swing/positional traders
Volume Analysis: Exceptional volume spike (20.3M) - highest since May/June - confirms breakout authenticity and institutional buying
Sector: Financial Services/Exchange - benefits from market activity and volumes
Historical Pattern: Orange circles show previous resistance zones that were tested - now breaking out decisively
Measured Move: From wedge height, target extends to 2,900-3,000 zone
Disclaimer: For educational purposes only. Not SEBI registered.

India Triad. Nifty, Banknifty and SensexExpecting the next day model of the MMXM trader. One sided expansion towards the buyside.

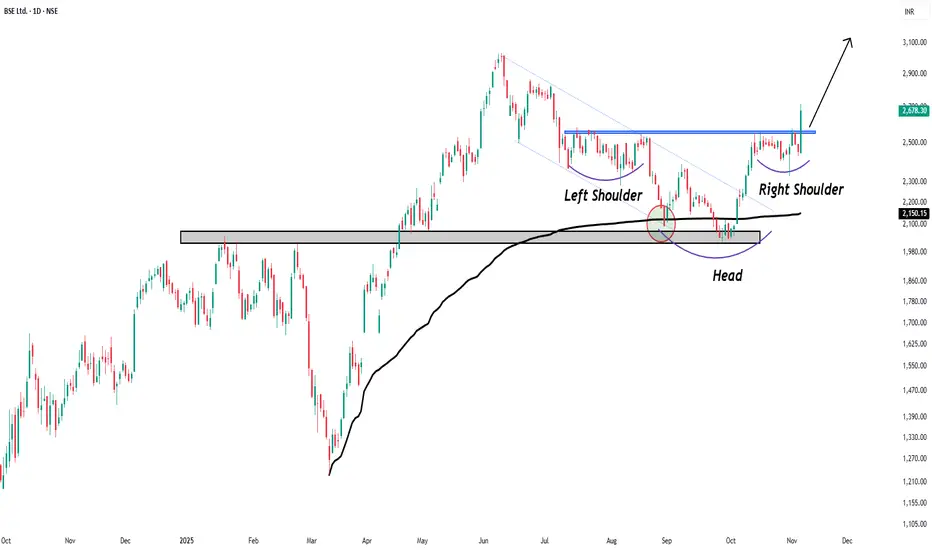
Inverse head & shoulder chart pattern BreakoutInverse head & shoulder chart pattern Breakout in Daily .High probability this stock price outperform in near future .
India Index Triad. Nifty, Bank Nifty and SensexNSE:NIFTY
NSE:BANKNIFTY
BSE:SENSEX
Covering the Draw on Nifty and the thought process behind that draw. Go ahead check it out and let me know

MADHUCON PROJECTS LTD FOR 2000% - LONG TERM BUYBUY FOR LONG TERM 5-7 YEARS FOR 2000% RETURN EXPECTED
MADHUCON PROJECTS - CMP = 7.50, TGT = 180
THIS IS LOSS MAKING COMING BUT I FEEL FUNDAMENTAL WILL SHIFT TOWARDS PROFIT MAKING IN COMING YEARS. SO I BELIEVE THIS WILL GIVE BEST RIDE AFTER MY TANLA PLATFORMS LTD ( before it was Tanla Solutions Ltd when i entered) ANALYSIS WHICH I SHARED IN MY CLOSED GROUP FOR 70 RS TO 1600 RS.
** This Post Is For Educational Purpose Only, Please Concern Your Advisor Before Investing In Market Related Instruments**
- AB_INV

SKYGOLDLooks good on Chart.
Breakout Visible.
Above all key EMA.
Good for Short Term.
Target 410,500.
Do Like ,Comment , Follow for regular Updates...
Keep Learning ,Keep Earning...
Disclaimer : This is not a Buy or Sell recommendation. I am not SEBI Registered. Please consult your financial advisor before making any investments . This is for Educational purpose only.

Cybertech - long term investment idea - latest update Cybertech - long term investment idea - latest update. More details on the chart.

Huge round of applause to those who are still bullish in BSEI have a bearish outlook on BSE as per the wave count highlighted.
I know a lot many are bullish because they got married to this stock.
Anyways do your own due diligence before taking any action.
Peace!!

AJMERAThis stock has breakout small resistance level so further up move will come up to all time high
and this is just for educational purpose

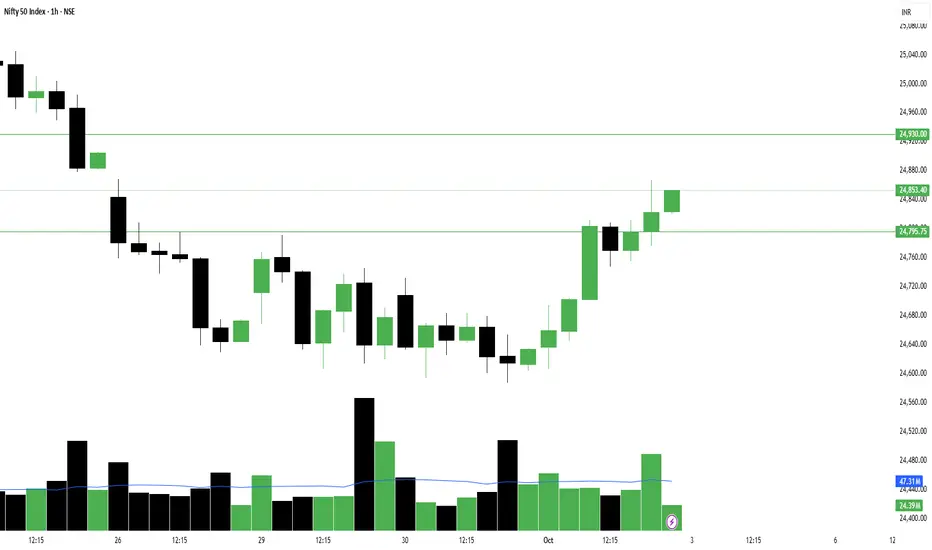
Volume turnaround seen in Nifty on daily chart but...So as we’ve been studying for the past 3 days – NSE:NIFTY ’s candle kept closing red but the volume was with buyers. Yesterday, that clearly reflected with the index jumping +225 points in a sharp, clean move.
Cheers to those who trusted the commentary and took early entries! I did too.
The idea now is simple – hold on to that position until we see sellers’ volume with a green candle.
Now, let’s check the data for tomorrow:
– Pivot has moved up to 24770
– PP is wide, which signals a sideways to trending day with bullish tone intact
– Support for tomorrow is 24800
– Resistance for the day is 24930. Only if this level is breached and sustained for at least 1 hour can we expect a sharp move.
Any dip from here remains a buy opportunity as long as the index stays above the pivot at 24770, because the current candle is backed by buyers’ volume.
But keep this in mind – the net volume of the market is still in red. That means it’s not yet the time to open long-term portfolio positions. Wait for net volume to give a turnaround before building long-term stock holdings. Remember, we are still under the correction zone that began in September 2024.
On the sector front, rotation is being seen in Defence and Media, while Finance and NBFC continue in high momentum for the short term.
FnO stocks with buyers’ volume up are:
NSE:BHARATFORG and NSE:BSE
You can look for intraday opportunities here. But for options trading, be mindful of pivotal entries and IVP. Sometimes these stocks take more than a day to move, so don’t be disheartened if they don’t react immediately. Keep them on watch and plan your entry to manage risk.
That’s all for the day. Take care and have a profitable tomorrow.
I truly hope you learn and earn a lot with me!
---
📊 Levels at a glance:
Pivot: 24770
Support: 24800
Resistance: 24930 (sustain 1 hour = sharp move)
Pivot Percentile: Wide (sideways to trending)
Bias: Bullish as long as index holds above pivot, buy dips backed by volume
Sectors to watch: NSE:NIFTY_IND_DEFENCE , NSE:CNXMEDIA , NSE:CNXFINANCE , NBFC
FnO Focus: #BHARATFORGE, #BSE
Going back to covid lows? This bull market has reached its top. Things are not looking good geopolitically for India. This should be it or max 90k. if it looses 80k, then the game is over. See you at covid lows in an 12-18 months. Good luck.
Not a financial advise.
