This Isn’t a Reversal — It’s Only Phase Two. $BTC>65k Thank you for your attention! This is exactly what you've been hearing since September 2025. Next, we'll form the bottom, and reaccumulate until October.
A smart person told me to stop posting publicly. Make everything private, but I continue to publish my thoughts for you.
There are no entry points for positions here; my positions are elsewhere.
I accidentally made a private post yesterday
Right now, it’s still too early to talk about any meaningful reversal. We’re not in a recovery phase - we’re in phase two of the market cycle, and this phase tends to last longer than most expect. The structure is forming exactly as it should: slowly, unevenly, with pockets of stress that haven’t fully played out yet.
Bitcoin is dropping, but for me there’s nothing surprising in this move.
If you’ve been following my posts for a while, you know this scenario was not only possible
— it was highly probable. We’ve already reached the first target zones I highlighted earlier, and the market is now moving toward the deeper structural points that complete this segment of the cycle.
There are still shocks ahead, and the system hasn’t finished recalibrating.
This is not a trend market — this is a regime market. And regime markets demand patience, discipline, and the ability to read liquidity, not headlines.
2026: A Year of Market Regimes
2026 feels like a year defined by regimes, not direction.
This is a market that punishes overconfidence and rewards discipline: managing leverage, staying patient, and understanding liquidity matter more than any narrative.
Liquidity today behaves like a system of pipes. Sometimes the taps look wide open, yet the internal pressure shifts so fast that trends break long before the crowd can explain the move with headlines.
In these phases, Bitcoin behaves not like a “legend”, but like the most liquid proxy for risk:
under stress, it’s the first asset sold because reducing exposure through BTC is the easiest and fastest way.
This leads to a key insight:
Even during superficially “risk-on” news cycles, BTC can underperform when several forces align:
- rising demand for USD (dollar squeeze)
- carry trades unwinding
- capital rotating into leading sectors (metals, indices)
- portfolios cutting risk and closing leverage
Three Structural Scenarios for 2026
I avoid guessing levels; instead, I work with structural patterns. For 2026, I see three core possibilities:
1) Capitulation → Base Formation
A sharp washout, volatility climax, then a broad range and gradual base building.
2) Rallies Within a Larger Downtrend
Strong upside moves that turn into distribution.
The market gives hope — and takes it back on retests.
3) Macro Shock
An event in FX, rates, or liquidity triggers fast deleveraging.
Moves overshoot, correlations spike, and a violent mean reversion follows.
This is why my approach now is very simple:
fewer trades, higher quality.
I’m deliberately reducing the number of positions and focusing only on moments where structure provides a clear edge — because in years like this, capital is preserved not by activity, but by the right pauses.
About the Academy
In parallel, I’m updating my Academy in real time: weekly materials, market structure breakdowns, liquidity updates, USD dynamics, and risk indicators.
The access is open and free — anyone can stay aligned with the current regime without noise.
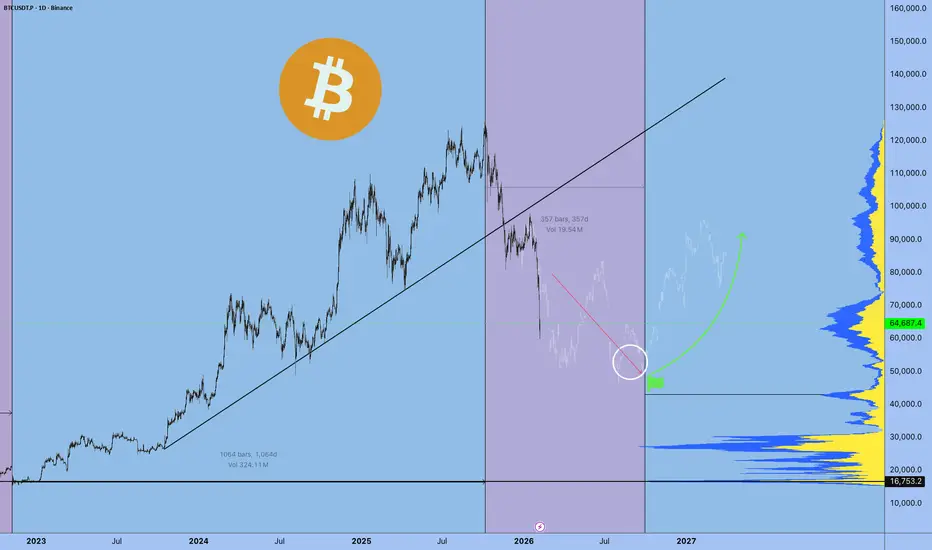
Current Market Structure
Looking at today’s structure, the market is forming precisely the segment I expected.
The key volume level ahead remains intact, and with high probability, price will break through it. Only after that expansion may we see the formation of the first real leg of the next cycle.
The conservative zones I mentioned earlier remain valid. More negative scenarios exist, yes — but the underlying logic does not change:
Accumulate gradually — on fear, liquidations, and liquidity distortions.
The main zone is very close, and that is where, in my view, the most interesting continuation setup will appear.
Best regards EXCAVO
Btc-bitcoin
Bitcoin Breaks Major Support — Extreme Fear or Another Leg Down?Bitcoin ( BINANCE:BTCUSDT ), as I highlighted in my previous weekly idea , started its decline. The drop came with higher momentum than expected, surprising many, and it successfully broke the heavy support zone($78,260-$64,850).
Now, here are the fundamental reasons for Bitcoin’s movement in the last 24-48 hours, as well as the general context:
•Global Risk-Off Sentiment: Investors moved away from high-risk assets as global equity markets—especially tech stocks—came under heavy selling pressure.
•Lack of Strong Spot Demand: There was no meaningful inflow of fresh capital to absorb selling pressure at key support levels.
•Institutional Pressure & Unrealized Losses: Large BTC holders and public companies with Bitcoin on their balance sheets reported increased unrealized losses, weakening market confidence.
•Correlation With Traditional Markets: Bitcoin continued to trade as a risk asset, following the downside momentum of global financial markets.
•Forced Liquidations: High leverage across the market led to cascading liquidations, accelerating the downside move.
Bitcoin Fear & Greed Index is currently at 9 — marked as “Extreme Fear”.
This is the lowest reading since June 2022, when the market sentiment collapsed following major events like the Terra crash.
Historically, when the Fear & Greed Index dropped this low, Bitcoin experienced prolonged selling pressure and volatility, followed by eventual stabilization as fear subsided. Extreme Fear readings often coincide with market bottoms or oversold conditions, but they do not guarantee an immediate price reversal.
In short: Extreme fear can signal that market participants are overly pessimistic — possibly a contrarian buying environment — but confirmation from price action and other indicators is crucial before assuming a trend reversal.
Now, let’s take a quick look at Bitcoin’s 4-hour chart to assess the current situation.
It appears that Bitcoin, given its momentum, has successfully broken the heavy support zone($78,260-$64,850) and is currently pulling back toward that zone.
From an Elliott Wave perspective, it seems we are in the final stages of the main wave 4. After this pullback near Fibonacci levels, we anticipate another decline. Since the drop’s momentum has been strong, wave 5 could potentially be truncated.
I expect Bitcoin to resume its drop from one of the Fibonacci levels or Cumulative Short Liquidation Leverage($68,900-$67,200), targeting at least $64,123.
First Target: $64,123
Second Target: $62,103
Stop Loss(SL): $72,033
Points may shift as the market evolves
Cumulative Long Liquidation Leverage: $60,000-$58,000
CME Gap: $84,560-$79,660
CME Gap: $54,545-$52,980
💡 Please respect each other's opinions and express agreement or disagreement politely.
📌Bitcoin Analysis (BTCUSDT), 4-hour time frame.
🛑 Always set a Stop Loss(SL) for every position you open.
✅ This is just my idea; I’d love to see your thoughts too!
🔥 If you find it helpful, please BOOST this post and share it with your friends.

Bitcoin Weekly Roadmap: 50_SMA(Weekly) Lost — $70K Break Next?Let’s start with my previous weekly analysis on Bitcoin from Jul 11, 2025 , which showed that when higher timeframe technical analysis is done right, it can be impactful and help capture key trends. Back then, we identified the All-Time High(ATH=$126,199) and the subsequent correction accurately.
Now, let’s explore what the next weekly move might be—stay with me!
Bitcoin, after losing its uptrend lines and the weekly 50_SMA(Weekly), has shown weakness in its bullish structure. Historically, on Bitcoin’s weekly chart, the 50_SMA(Weekly) has been a critical support. Each time it’s lost, Bitcoin has extended its correction. We’ve seen two similar moves on the weekly chart: Bitcoin pulled back to the 50_SMA(Weekly) and then dropped again. Right now, that pullback is complete, and we can anticipate a fresh decline.
While many analysts expect a bullish “head and shoulders” pattern to push upward, I see that as unlikely:
The S&P 500( SP:SPX ) is near its all-time highs and is more likely due for a correction. Given its correlation with Bitcoin, an S&P drop could pull Bitcoin down, especially with sharp moves.
Also, USDT.D% ( CRYPTOCAP:USDT.D ) has broken past a heavy resistance zone and may continue rising—this could add more pressure on crypto, including Bitcoin.
Additionally, the US 10-Year Government Bond Yield ( TVC:US10 ) is breaking resistance lines, which signals risk-off sentiment—another factor that could lead to declines in assets like Bitcoin and gold( OANDA:XAUUSD ).
Looking at Bitcoin’s weekly chart: Bitcoin is in a heavy support zone($76,600-$64,850) and there’s a CME Gap($84,560-$79,660) above.
From an Elliott Wave perspective, Bitcoin has completed its main 5-wave impulse. Signs include the loss of uptrend lines and the 50_SMA(Weekly).
I expect Bitcoin to break the heavy support zone($76,600-$64,850). It may bounce near $68,000, but if negative news increases, we could see a drop to the $58,000–$59,000 range in the coming weeks.
Note: Increased Middle East tensions could accelerate reaching these targets faster. Let’s stay vigilant!
What do you think? Can Bitcoin fall below $70,000, or should we wait for the price of Bitcoin to rise again?
💡 Please respect each other's opinions and express agreement or disagreement politely.
📌Bitcoin Analysis (BTCUSDT), Weekly time frame.
🛑 Always set a Stop Loss(SL) for every position you open.
✅ This is just my idea; I’d love to see your thoughts too!
🔥 If you find it helpful, please BOOST this post and share it with your friends.

$BTC WEEKLY GOD CANDLE FORMING200WMA up next.
$50k you back the truck up.
WHO'S READY FOR VALHALLA !? 👼

CIFR triangle in wave B has completed, per previousNASDAQ:CIFR has completed the triangle in wave B of 4 with thrust down in wave C, characteristic behaviour of wave Cs.
Triangle are patterns found before a terminal move suggesting we are nearing a bottom at the daily 200EMA, 0.236 Fibonacci retracement.
Safe trading

BTC highs in, new lows coming soon?~$122.5k was the top of the range. Now we'll need to go test the lows before we can continue higher.
Alts are clearly not confirming a trend change .
Many still bearish on HTFs (including ETH), I think the reason is because Bitcoin goes lower before we see a continued run and that will drag down alts with it. I think people holding alts here with hopes for new highs (in the near future) are about to have their hopes crushed, that also goes for people long crypto miners.
I don't think the real run starts until end of 2025 or 2026.
Time will tell.
FACT CHECK: The "$8k MicroStrategy Liquidation" is a Lie.Stop panic-selling your Bitcoin because of a rumor.
Everywhere on the timeline, I see the same copy-paste FUD: "If Bitcoin hits $8,000, Saylor gets liquidated and BTC goes to zero."
I just finished a forensic audit of Strategy Inc.'s Q4 2025 filings.
Here is the Institutional Reality vs. The Retail Myth.
__________________________________________________________________________________
1. THE MYTH: "Saylor has a Liquidation Price at $8k." 🧟♂️
THE TRUTH: This number is Rhetorical, not Contractual .
* Origin: This figure came from a "Stress Test" comment by the CEO, illustrating where Assets would equal Liabilities. It is NOT a loan trigger.
* The Structure: MSTR retired their secured loans (Silvergate) years ago. Their current debt is Unsecured Convertible Notes (due 2027-2032).
* The Key Difference: Unsecured notes have NO Liquidation Trigger . They cannot be margin called based on price price.
2. THE SAFETY NET ($2.25 Billion Firewall) 🛡️
Even if Bitcoin goes to $20k, MSTR does not have to sell a single Satoshi.
* Cash Reserve: They hold $2.25 Billion USD in cash.
* Runway: This covers all interest payments through mid-2028 .
* Conclusion: They can survive a multi-year Crypto Winter without forced selling.
__________________________________________________________________________________
3. THE REAL "PAIN POINT" (It's not $8k) ⚠️
The real risk is not Liquidation; it is Stagnation .
* MSTR Avg Cost: $76,052
* Current Price: ~$70,000
* Status: UNDERWATER.
The risk isn't that they *sell*; it's that they can't *buy* anymore. The "Infinite Money Glitch" (issuing stock to buy BTC) breaks when the stock trades below NAV. This removes the biggest buyer from the market.
4. THE ODDS OF $8K? (<1%) 📉
We analyzed the Dec 2026 Derivatives Market .
* Smart Money Positioning: Massive "Put Wall" (Hedging) at $50,000 .
* The Void: There is near-zero open interest below $30k.
* Implied Probability: The market prices a drop to $10k at <1% .
__________________________________________________________________________________
🎯 THE VERDICT
The "$8k Liquidation" is a ghost story from 2022.
* Risk of Liquidation: 0% (Structure is Unsecured).
* Risk of Stagnation: High (Until we reclaim $76k).
* Major Support: The 200-Month Moving Average is at $58,000 . That is the real floor.
Don't trade the FUD. Trade the Structure.
Which side are you on?
A) Believing the FUD (Target $8k) 🐻
B) Buying the Value (Target $58k) 🐂

Bitcoin Entry- When BTC was $500, it was “a Scam”.
- When BTC was $20k, it was " too dangerous".
- When BTC was $100k+. it was "too expensive".
- The problem today is simple: big hands are positioned ahead of you, with a professional strategy.
- You already have some tools for DCA entries : Fib levels, volume profiles, MA200 and key historical points of interest.
- Everything is priced in graphic, lower numbers would be very lucky.
Remember. Everyone gets BTC at the price they deserve.
Happy Tr4Ding !

LINK – Retracement into Key Support | Long Spot SetupChainlink has retraced into a major support zone, offering a potential opportunity for a long spot position. This area ($8.50–$9.50) has held well in the past and could act as a base for the next leg up, especially if broader market sentiment improves.
🛠 Strategy Setup:
Entry (Ladder In): $8.50 – $9.50
Take Profit Targets:
TP1: $11.00 – $12.00
TP2: $13.00 – $14.00
Stop Loss: Below $8.00 (to manage downside risk)
The idea here is to accumulate gradually (laddering) within the support zone, not all at once. This helps manage timing risk and smooths out entry price. If bulls return, we could see a push toward key resistance clusters around $11–$14.

Bitwise Bitcoin ETF | BITB | Long at $37.08Back in AMEX:BITB at $37.08. Crypto is wild beast of speculation, but Bitcoin COINBASE:BTCUSD is the king. I'll leave further analysis to the crypto bros...
More downside may be ahead ("crash" Bitcoin is around $40,000 right now), but even your grandma has heard of Bitcoin / Bitcorn at this point. It's not going anywhere.
Targets into 2029
$44.00 (+18.7%)
$58.00 (+56.4%)

ONDO – Swing Trade Setup from Key Support ZoneONDO has now pulled back into a major support area between $0.25 and $0.29, a level that previously held as a strong demand zone. This presents a solid opportunity to ladder into a long swing trade, anticipating a potential move back toward higher resistance levels.
📈 Trade Plan:
Entry Zone: $0.25 – $0.29 (ladder entries)
Take Profit Targets:
TP1: $0.35 – $0.45
TP2: $0.55 – $0.68
Stop Loss: Just below $0.24
We're watching for confirmation from price action and volume at this zone. If momentum builds, ONDO could push back toward those higher resistance levels. A gradual scale-in approach helps manage risk while positioning for potential upside.

Great spot to buy btcWe should most likely get a relief rally from these areas and possibly a wick down to 58k so playing it safe

BTC triple major supportSET:BTS has arrived at the weekly 200EMA, S1 weekly pivot and major High Volume Node on weekly RSI oversold. Weekly bearish divergence has now played out. Price could go lower but this s High probability major bottom area. Wave 4 is likely to finish around the .382 Fibopnacci retracement form the 2022 bottom to 125k.
This has only ever happened 3 times with a 500%+ rally afterwards.
Sentiment is the worst it ever been for the longest at extreme fear, 11.
Safe trading

BTC vs SaaS and Tech Software Sector CorrelationBitcoin is currently showing its strongest correlation with the SaaS and Tech-Software sector.
This signals a clear shift: BTC is behaving like a high beta tech asset, driven by liquidity, growth expectations, and valuation cycles within the software market.
This is how smart capital truly sees Bitcoin.
That also means the AI sector has direct points of conflict with Bitcoin, something very few are talking about.
Alphractal

IS BITCOIN ENTERING BULL MARKET NOW?!!!! (buy now?) Yello Paradisers! Enjoy the video!
And Paradisers! Keep in mind to trade only with a proper professional trading strategy. Wait for confirmations. Play with tactics. This is the only way you can be long-term profitable.
Remember, don’t trade without confirmations. Wait for them before creating a trade. Be disciplined, patient, and emotionally controlled. Only trade the highest probability setups with the greatest risk to reward ratio. This will ensure that you become a long-term profitable professional trader.
Don't be a gambler. Don't try to get rich quick. Make sure that your trading is professionally based on proper strategies and trade tactics.

Bitcoin - Pullback LevelsOn the larger timeframe, Wave 3 of the decline has been completed.
Locally, within this third wave, the fifth subwave has been completed.
We are currently in an upward corrective move. Let’s define the main targets.
Key targets:
75,000 - local correction
82,000
85,000
The potential move from the current level is 15-30% .
There is also an unfinished sub-division around 55,000 , but it appears unlikely.
---
Subscribe and leave a comment.
You’ll get new ideas faster than anyone else.
---

BITCOIN Very strong zonesThese zones represent strong structural support. Should Bitcoin trade into these areas, they offer high-probability long opportunities.
BINANCE:BTCUSDT CME:BTC1! BYBIT:BTCUSDT

Bitcoin, Bitcoin, Bitcoin....Price has broken down hard from the weekly structure and is now trading well below the key moving averages. Momentum has shifted firmly bearish and volatility is expanding to the downside.
Key observations:
Clear loss of bullish market structure on the weekly
Strong impulsive sell-off with little demand stepping in so far
Price sitting below major moving averages, which now act as overhead resistance
Volume profile shows heavy interest lower, meaning price can still explore before real balance is found
Momentum remains weak and has not shown a meaningful shift yet
What matters from here:
This is not a chase zone
Higher probability comes from patience, not prediction
Bulls need to reclaim structure and hold it
Until that happens, rallies are reactions, not trend reversals
Game plan:
Wait for structure.
Let price prove acceptance before taking risk.
The market always gives another opportunity.
Stay disciplined.

BTC Outlook / Breakdown and Retest SetupBitcoin saw an impulsive breakdown after failing to hold the prior consolidation range. Once acceptance was established below the mid-range, downside momentum expanded quickly, leaving price stretched relative to recent structure.
The yellow and green levels above represent prior support and value areas where price previously spent time consolidating. These zones are now likely candidates for a retest from below, should relief or short-covering occur.
From a structural perspective, a move back into those levels would not invalidate the current bearish leg. Instead, it would be consistent with a breakdown and retest scenario, where former support acts as resistance.
As long as price remains below those zones, the broader bias stays to the downside. Any upside reaction into that area should be evaluated on acceptance and follow-through, not assumed strength.
For now, momentum favors continuation, while the yellow and green zones define the most important areas to watch for a potential reaction or rejection.

Bitcoin Weekly – Bearish Continuation Thesis (Higher Time Frame)Note / Preface:
This publication focuses on higher-timeframe (weekly) structure and macro justification. Additional Fibonacci levels, minor supply/demand zones, and other references mentioned in the text but not shown on the chart exist on lower timeframes and are intentionally omitted to preserve clarity. The chart displays only the most pertinent macro levels used to frame the higher-timeframe thesis and potential decision areas.
Thesis:
This thesis is based on higher-timeframe structure, trend, and auction behavior using the weekly chart.
Following the ATH, BTC rejected the golden pocket (≈107–110k), overlapping a major supply zone, and formed a weak corrective channel that resolves as a bear flag. The retracement failed near the 0.5 level, with repeated rejection from supply at 90–93k. No weekly candles accepted above the channel midpoint, suggesting persistent seller control rather than accumulation.
Momentum confirms the structure. Weekly RSI remains in a bear regime (below the EMA and the 50 midpoint), and rallies continue to behave as corrective rather than impulsive.
The measured move from the bear flag pole (thick vertical yellow lines) projects toward ~62k, aligning with a large multi-cycle supply/demand zone (≈53–63k), the rising 200-week SMA (yellow dotted line), and the 0.382 retracement of the Nov 2022 low to ATH (~57.7k). Notably, the anchored VWAP (brown/orange line) from the 2022 low currently sits near the top of this zone (~63k), making it a likely area for long-duration participant defense and a potential reaction.
A bullish Cypher harmonic is tracking toward completion near this region. Harmonic completion is expected to produce a reaction, not necessarily a reversal—either a short-covering bounce followed by a back-test, or a deeper liquidity sweep within the zone. MACD histogram divergence supports the potential for a counter-trend reaction but does not override bearish structure without acceptance and regime change.
From a trend-following perspective, moving-average behavior is consistent with a late Stage 3 / Stage 4 environment under Stan Weinstein’s framework, reinforcing a bearish-until-invalidated bias.
The bearish thesis remains intact unless BTC reclaims 90–93k with acceptance and exits the RSI bear regime. The 53–63k zone is viewed as a high-probability reaction and reassessment area, not a hard target.

Bitcoin Roadmap=>End of RallyBitcoin ( BINANCE:BTCUSDT ) has gained nearly +10% in the recent weekly candle so far. The question is where this rally could end up. So to get to that zone, let’s go to the weekly timeframe .
Before we start this analysis, let’s take a look at my last analysis on the weekly timeframe , which was well into the Potential Reversal Zone(PRZ) . ( Analysis time: 9 JUN 2025 )
Bitcoin has now entered the Potential Reversal Zone(PRZ) and Time Reversal Zone(TRZ=June 23 to August 4) , and these zones could be the zones where this Bitcoin rally will end. Do you agree with me?
In terms of Elliott Wave theory , Bitcoin appears to be completing a main wave 5 , as the main wave 3 was an extended wave . The main wave 5 could end at the Potential Reversal Zone(PRZ) .
I expect Bitcoin to start a main correction from the Potential Reversal Zone(PRZ) and could continue to support lines and near the $105(at least) .
What do you think about the end of the Bitcoin rally?
Note: Sell orders near $120,000 are very heavy.
Note: Cumulative Long Liquidation Leverage attractive volume for liquidation.
Note: If Bitcoin goes above $130,000, it can continue to rise to the Resistance lines (near $150,000).
Please respect each other's ideas and express them politely if you agree or disagree.
Bitcoin Analyze (BTCUSDT), weekly time frame.
Be sure to follow the updated ideas.
Do not forget to put a Stop loss for your positions (For every position you want to open).
Please follow your strategy and updates; this is just my Idea, and I will gladly see your ideas in this post.
Please do not forget the ✅' like '✅ button 🙏😊 & Share it with your friends; thanks, and Trade safe.

BITCOIN PREDICTION – GAME PLAN📊 Market Sentiment
Market sentiment is currently extremely bearish. We continue to see consistent outflows from Bitcoin ETFs. In addition, the Fear & Greed Index is sitting at 22 (Fear zone) and has remained there for some time.
Bitcoin has largely decoupled from the S&P 500 (US markets), and capital does not appear to be flowing into crypto at the moment. Unless a new and strong narrative emerges, I do not expect the market direction to change.
Today’s CPI data came in at 2.7% versus a 3.1% expectation, which could act as a positive catalyst for risk assets. We saw this effect clearly in U.S. equities; however, Bitcoin and the broader crypto market remained unresponsive. This further confirms my view that sentiment remains aggressively bearish.
📈 Technical Analysis
Price has been in a clear downtrend for some time. Over the past month, Bitcoin has been consolidating within a tight range.
In my opinion, this consolidation is more likely to resolve to the downside. While risk assets such as US100 continue to push higher, Bitcoin’s inability to follow reflects clear relative weakness.
📌 Game Plan – Prediction
I am monitoring two main scenarios:
Scenario 1 (Red Line – More Likely)
I expect price to decline toward $80,500, where we may see a short term bounce. However, I believe this bounce will fade, with the primary downside target at $74,500.
After price runs $74,500, I will be looking for potential long/buy opportunities.
Scenario 2 (Black Line)
Price first moves up toward $96,000, gets rejected from that level, and then closes back below it. From there, I expect continuation to the downside toward $80,500 and potentially $74,500.
💬 For deeper sentiment and strategy insights, subscribe to my Substack free access available.
This analysis is for educational purposes only and does not constitute financial advice. Always conduct your own research before trading or investing.

BTCUSD – 1H Technical, Supply–Demand & Market LogicBitcoin is still trading inside a clean, well respected descending channel, and nothing in the current price action suggests trend exhaustion. What looks like a bounce is structurally a corrective pullback into supply, not the start of a new bullish leg.
Technical Structure
- Trend: Clearly bearish consistent lower highs and lower lows
- Channel: Price is reacting perfectly to the upper and lower boundaries of the descending channel
- EMA (dynamic resistance): Every rally into the EMA has been rejected, confirming sellers remain in control
The recent move from the demand zone near 74,800–75,200 is a technical reaction, not accumulation. That demand has already been tested and partially consumed. Price is now pushing back into a supply zone around 78,500–79,500, aligned with:
- Channel resistance
- EMA resistance
- Prior breakdown structure
This confluence makes the area high-probability sell-side liquidity.
Supply–Demand & Liquidity
- The green demand zone below has weak hands, not strong absorption
- The current upside move is best interpreted as stop-hunting and short-term relief
- The dotted projection shows the classic bearish path:
bounce → rejection → continuation lower
If price fails to reclaim and hold above the supply zone, the next move favors a breakdown through the demand zone, opening the path toward the major liquidity target near 71,900.
Macro Context
Risk assets remain under pressure as:
- Financial conditions stay tight
- Volatility picks up
- Speculative positioning continues to unwind
In this environment, Bitcoin behaves like a risk asset in distribution, not a safe haven.
Key Takeaway
As long as BTC remains inside this descending channel, every rally should be treated as a selling opportunity, not a breakout. A real trend shift requires acceptance above channel resistance until then, downside continuation remains the dominant scenario.
This is not panic selling / This is controlled markdown.
