BTC 1H Analysis – Key Triggers Ahead | Day 14💀 Hey , how's it going ? Come over here — Satoshi got something for you !
⏰ We’re analyzing BTC on the 1-hour timeframe timeframe , we can see that Bitcoin is building a range above the $117,000 support level while trading with reduced volume.
👀 After breaking through the $118,000 zone (which acted as the midline of the range), Bitcoin has formed a consolidation just above $117,000. At the moment, it is ranging with a slight upward bias in the short term.
🕯 Trading volume and the number of transactions have decreased due to the weekend/holidays.
⚙️ On the RSI, the key resistance zone is 65.63. A breakout above this level could increase the probability of moving into overbought territory. On the other hand, losing the support zone around 37.82 could trigger selling pressure and push RSI into oversold territory.
🔔 Our alarm zones are set at $119,000 and $117,000. Breaking either of these levels could provide a trading signal. Monitoring price action around these zones will give clearer entries.
💵 Looking at USDT.D , we can see a 1-hour box range structure. It recently broke down from the bottom of the box. Now, the question is whether this decline will continue or if it will return inside the range.
🖥 Summary: Bitcoin is currently consolidating in a range with a slightly upward slope. However, due to the weekend, trading volume has dropped significantly, so any breakout needs confirmation with stronger liquidity.
❤️ Disclaimer : This analysis is purely based on my personal opinion and I only trade if the stated triggers are activated .
Btc-bitcoin

BTC Weekly Recap & Game Plan 17.08.2025BTC Weekly Recap & Game Plan 17.08.2025
📊 Market Sentiment
Overall sentiment remains bullish, supported by expectations of a 0.25% rate cut in the upcoming FOMC meeting. A weakening USD and increasing global risk appetite are creating favorable conditions for further upside in crypto assets.
📈 Technical Analysis
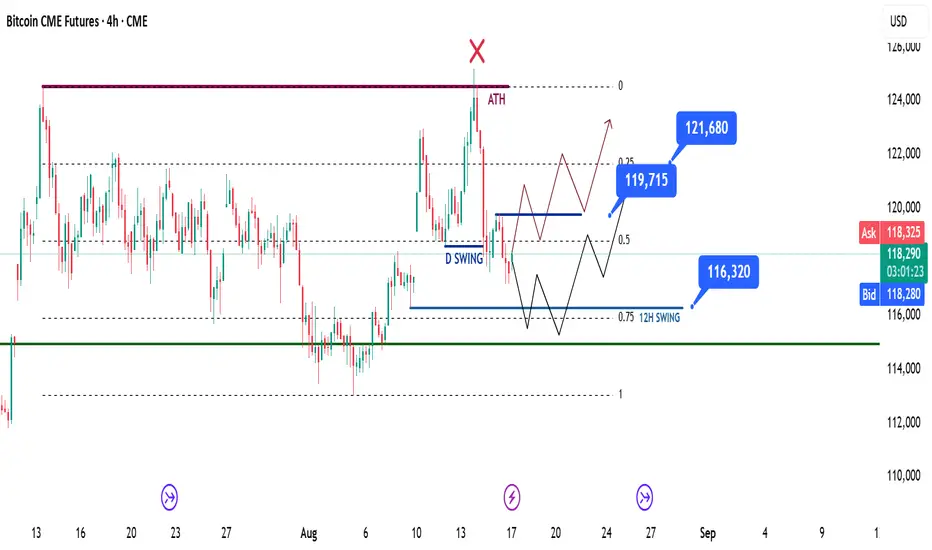
Price ran the daily swing liquidity but couldn’t close above it.
Additionally, price has tapped into the equilibrium level, which makes this a discount zone in my view.
📌 Game Plan
There are two possible scenarios to watch:
First scenario (red):
→ Price closes above 119,725$, then I’ll be looking for entries around 118,750$.
Second scenario (black):
→ Price may retrace further to 116,310$, marked by 12H swing liquidity.
→ This level also aligns with the 0.75 Fibonacci retracement, which is my max discount zone.
🎯 Setup Trigger
I’ll be watching for a 4H–1H break of structure (BOS) to initiate entries.
📋 Trade Management
Stoploss: 4H–1H swing low confirming the BOS
Targets:
TP1: 121,680$
TP2: 124,500$
💬 Like, follow, and comment if you find this setup valuable!
⚠️ Disclaimer: This content is for informational and educational purposes only and does not constitute financial, investment, or trading advice. Always do your own research before making any financial decisions.
Bitcoin : Decision point here: trendline bounce vs. breakdownBTC/USD – Daily
Price is testing the rising trendline support after a sharp rejection from recent highs. Currently sitting right on the line (circled), showing whether bulls can defend this level or if we risk a deeper pullback.
🔑 Key Levels:
Support: $111,950 – $112,000
Resistance: $127,000
Rising trendline (watch closely for confirmation or breakdown).
Momentum is slowing, and we’ve got regular bearish divergence on the histogram—suggesting caution. If this support holds, continuation higher is likely. If it breaks, expect retest of lower demand zones.

This Ethereum SeasonThis Ethereum Season
Ethereum Dominance / Bitcoin Dominance
CRYPTOCAP:ETH.D / CRYPTOCAP:BTC.D

ETH Daily Recap & Game Plan – 15.08.2025ETH Daily Recap & Game Plan – 15.08.2025
📊 Market Sentiment
Overall sentiment remains bullish, supported by expectations of a 0.25% rate cut in the upcoming FOMC meeting. A weakening USD and increasing global risk appetite are creating favorable conditions for further upside in crypto assets.
Ethereum is approaching all-time highs, fueled by a $1B single-day ETF inflow. Additionally, rumors of potential SEC approval for Ethereum staking policy could directly boost ETH’s utility — strengthening the long bias.
📈 Technical Analysis
Price has started a retracement move after Bitcoin reached new all-time highs.
Currently, ETH is testing the daily demand zone (blue box) — a level where we may see a reaction. For confirmation, I want to see a 4H break of structure before initiating any trades.
Since it’s the weekend, I expect some choppy price action and possibly a deeper retracement. I’m watching two potential scenarios (Blue vs. Red).
📌 Game Plan
Scenario 1 (Blue)
→ Price sweeps 4H swing liquidity at 4255$, then rejects.
Scenario 2 (Red)
→ Price dips deeper, tapping the untested swing high at 4112$ and possibly into the equilibrium discount zone (0.5 Fibonacci), before rejecting.
🎯 Setup Trigger
Waiting for a 4H break of structure before entering any position.
📋 Trade Management
Stoploss: 4H swing low confirming the BOS
Target: Run directly toward all-time highs at 4867$
💬 Like, follow, and comment if you find this setup valuable!
Disclaimer: This content is for informational and educational purposes only and does not constitute financial, investment, or trading advice. Always do your own research before making any financial decisions.

ETH Long Idea - Daily Recap - 14.08.2025📊 Market Sentiment
Overall sentiment remains bullish, supported by expectations of a 0.25% rate cut in the upcoming FOMC meeting. A weakening USD and increasing global risk appetite are creating favorable conditions for further upside in crypto assets.
Ethereum is approaching all-time highs, fueled by a $1B single-day ETF inflow. Additionally, rumors of potential SEC approval for Ethereum staking policy could directly boost ETH’s utility — strengthening the long bias.
📈 Technical Analysis
Price has pulled back to the daily fair value gap. HTF fair value gaps are historically strong zones for potential bounces.
📌 Game Plan
I expect possible expansion toward all-time highs here, as we have broken the LTF market structure.
📋 Trade Management
Entry: 4602$
SL: 4455$
TP: All-time highs at 4867$
💬 Like, follow, and comment if you find this setup valuable!
Disclaimer: This content is for informational and educational purposes only and does not constitute financial, investment, or trading advice. Always do your own research before making any financial decisions.

BITCOIN PREDICTION: CRITICAL UPDATE (warning) Yello Paradisers! In this video, we are going through high-timeframe, medium-timeframe, and lower-timeframe analysis. This multi-timeframe analysis is important for us to understand the whole context of the market, and that is how we are able to make the best trading decisions as professional traders.
I'm explaining to you that we are on the high-timeframe chart, trading inside of a channel ABC zigzag formation. From an Elliott Wave perspective, we are currently in the C wave, which is a motive wave, and we are creating the smaller secondary wave. We can see a bullish divergence confirmed, and we are waiting for RSI to have a successful bullish reclaim.
I'm updating you about the 0.61 Fibonacci retracement level and all of the confluences at around $116,000 and $117,000. From a medium-timeframe perspective, we are updating the Elliott Wave price action development count. I'm sharing with you the contracting triangle. The deviation that happened during the E wave, the confluence of the $116,000 and $117,000, and truly sharing with you how important this demand zone area really is.
Then we are moving our attention to low time frame analysis where I share with you the most probable price action development in the upcoming days, weeks, and months.
Paradisers! Keep in mind to trade only with a proper professional trading strategy. Wait for confirmations. Play with tactics. This is the only way you can be long-term profitable.
Remember, don’t trade without confirmations. Wait for them before creating a trade. Be disciplined, patient, and emotionally controlled. Only trade the highest probability setups with the greatest risk to reward ratio. This will ensure that you become a long-term profitable professional trader.
Don't be a gambler. Don't try to get rich quick. Make sure that your trading is professionally based on proper strategies and trade tactics.

BTC Daily Recap & Game Plan – 15.08.2025BTC Daily Recap & Game Plan – 15.08.2025
📊 Market Sentiment
Overall sentiment remains bullish, supported by expectations of a 0.25% rate cut in the upcoming FOMC meeting. A weakening USD and increasing global risk appetite are creating favorable conditions for further upside in crypto assets.
📈 Technical Analysis
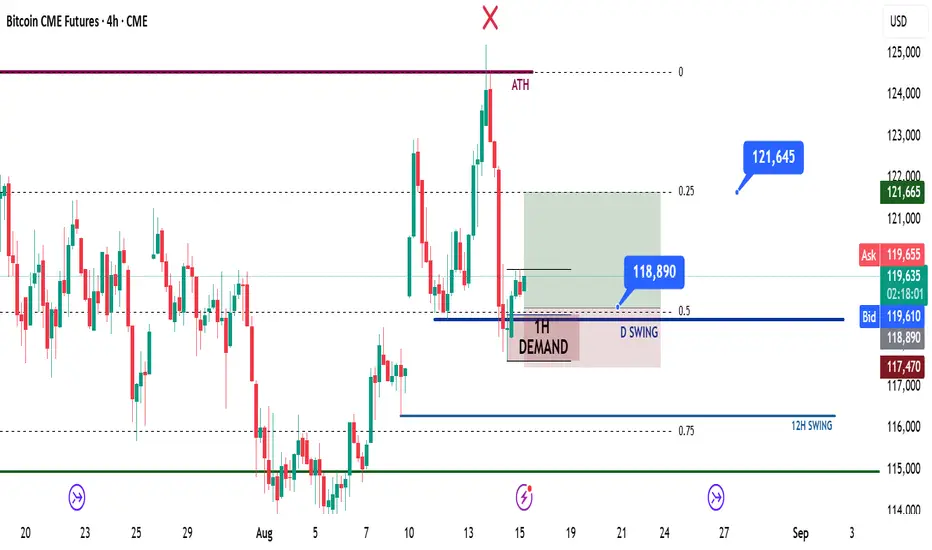
Price has started retracing into the daily swing level and the 0.5 Fibonacci zone, as anticipated in my previous Bitcoin daily update post (linked in the attachment, please check).
We have now seen a 1H break of structure following liquidity grabs.
📌 Game Plan
I will be looking for an entry around the $118,800 level, as there is a 1H demand zone that could support a move higher.
📋 Trade Management
Entry: $118,800
SL: $117,000
TP: $121,600
💬 Like, follow, and comment if you find this setup valuable!
Disclaimer: This content is for informational and educational purposes only and does not constitute financial, investment, or trading advice. Always do your own research before making any financial decisions.
Correction or just a bullish dip?Bitcoin dumped all the way to Daily 20-sma and found temporary support there. Day candle formed bearish engulfing. Strong downside move often cause a dead cat bounce first, but dump momentum may take price lower on the following swing.
🎯 Key Levels to Watch:
• Above: 120066 / 120900 / 122092
• Below: 117940 / 117400 / 116630
🔥 BTC Liquidation Heatmap:
• Above: 119400 / 120090 / 122174
• Below: 117095 / 116060 / 115484
Short term range ~117400-119255. Price will swing in between till break one way or another.
Most probable bounce target is re-test of zone above 120k which correlates with Wednesday NY low and developing quarter VAH.
If there will be another dip, nearest liquidity pool is within 115485-116060 zone.
⏰ TG alarms set for: 122092 (Tokyo low), 120066 (week open), 117400 (LTF range low), dev Quarter VWAP & VAH & Day 20-sma

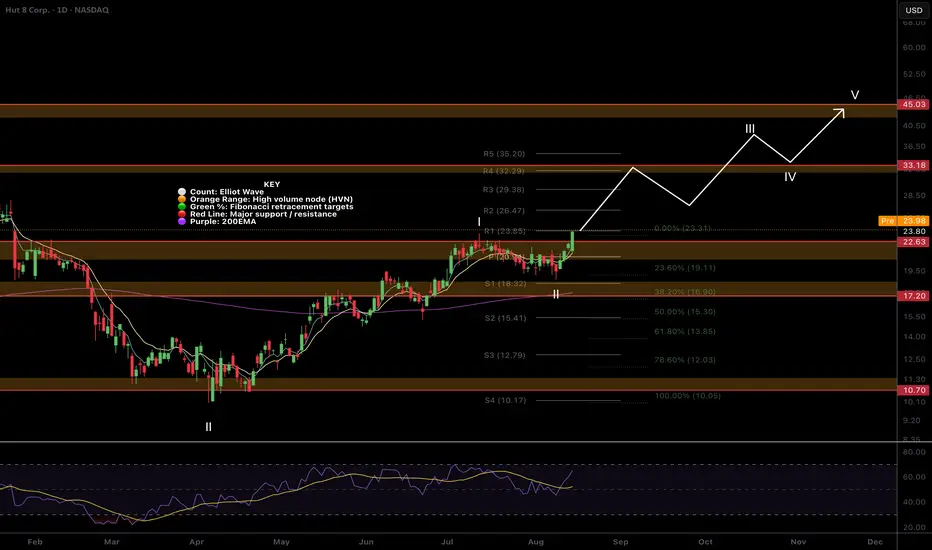
$HUT is Blasting Off Again!NASDAQ:HUT pull backs continue to be shallow making an accurate Elliot wave count difficult but this is a characteristic of a strong wave 3.
The next target is $33 major High Volume Node resistance at the R4 daily pivot.
RSI is printing daily bearish divergence but this will be offset soon if price continues upwards.
Safe trading
$BTC Bearish divergence + Bearish Engulfing daily candle!Bitcoin CRYPTOCAP:BTC has printed bearish divergence on the daily RSI with the recent push above all time high followed by a bearish engulfing candle often signalling a short term trend change! The candle engulfed the previous 2 days price action.
Traders should be cautious going long at these levels as we have a psychological trap set up for newbies with each push into all time high and rejection.
It appears wave 1 of III has completed and wave 2 has an expected pullback to the .618 Fibonacci retracement at $110k which may take a few week to play out but may give alt-coins time to continue their respective moves upwards. Wave 3 of III will be the strongest move of this wave and will likely end near the cycle top.
Analysis is invalidated if we continue into all time high.
Safe trading
For those interested in Trading signals / trading & diary management check out the Substack:
✅ Bitcoin hit take profit #2 for 2.59RR
✅AAVE (DEMA) hit take profit #1 for 1.45RR
✅New signal added for ONDO (DEMA percentage Band Rule)
✅Updated parameters on NEAR and STRK
✅No stops or invalidations this week

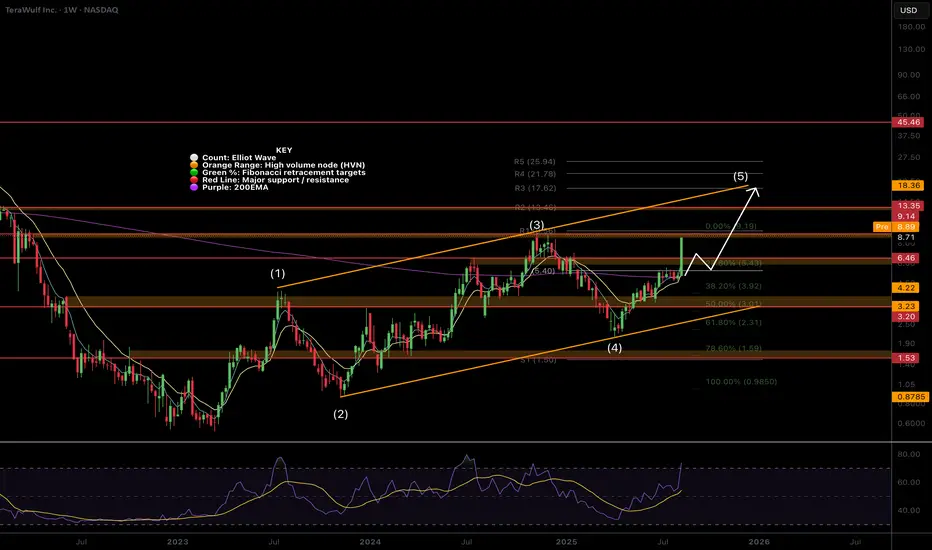
$WULF Continues the path with a 59% candle in one day!NASDAQ:WULF is still locked into the Elliot Wave leading diagonal channel having printed wave 1-4 and now in wave (3) of 5. Leading and ending diagonals do not obey the rules that 'wave 4 can not dip into wave 1'.
Price blasted through the weekly 200EMA and pivot point validating my count. Target remains the R3 weekly pivot at the top of the channel line around $17-18.
Weekly RSI has entered the overbought territory but this is a lagging indicator and price can stay in the upper bullish range for months!
I will be leaving this trade open and letting it run.
Updated signal service 15/08/25:
✅ Bitcoin hit take profit #2 for 2.59RR
✅AAVE (DEMA) hit take profit #1 for 1.45RR
✅New signal added for ONDO (DEMA percentage Band Rule)
✅Updated parameters on NEAR and STRK
✅No stops or invalidations this week
Safe trading
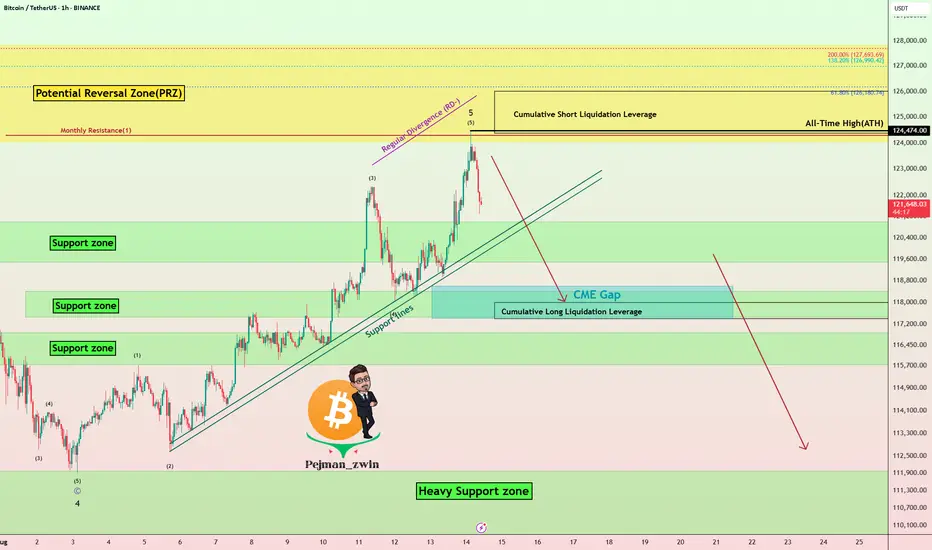
Bitcoin Hits New ATH – Is This the Final Pump Before a Crash?Bitcoin ( BINANCE:BTCUSDT ) reacted well to the Potential Reversal Zone(PRZ) that I told you about in the previous idea and started to decline, but Bitcoin managed to create a new All-Time High(ATH=$124,474) in this rally.
Do you think Bitcoin can create a new All-Time High(ATH) again in the coming hours or should we wait for a main correction?
In terms of Elliott Wave theory , Bitcoin appears to have completed the main wave 5 in the Potential Reversal Zone(PRZ) , and we should expect corrective waves .
Also, we can see the Regular Divergence(RD-) between Consecutive Peaks .
Looking at the USDT.D% ( CRYPTOCAP:USDT.D ) chart, it also seems that with the breaking of the upper line of the descending channel, we can expect an increase in USDT.D% , which could cause a decrease in the price of Bitcoin .
I expect Bitcoin to at least move towards filling the CME Gap($118,600-$117,425) AFTER breaking the Support lines .
Cumulative Short Liquidation Leverage: $126,000-$124,367
Cumulative Long Liquidation Leverage: $118,000-$117,400
Note: Stop Loss(SL): $126,123
Please respect each other's ideas and express them politely if you agree or disagree.
Bitcoin Analyze (BTCUSDT), 1-hour time frame.
Be sure to follow the updated ideas.
Do not forget to put a Stop loss for your positions (For every position you want to open).
Please follow your strategy and updates; this is just my Idea, and I will gladly see your ideas in this post.
Please do not forget the ✅' like '✅ button 🙏😊 & Share it with your friends; thanks, and Trade safe.
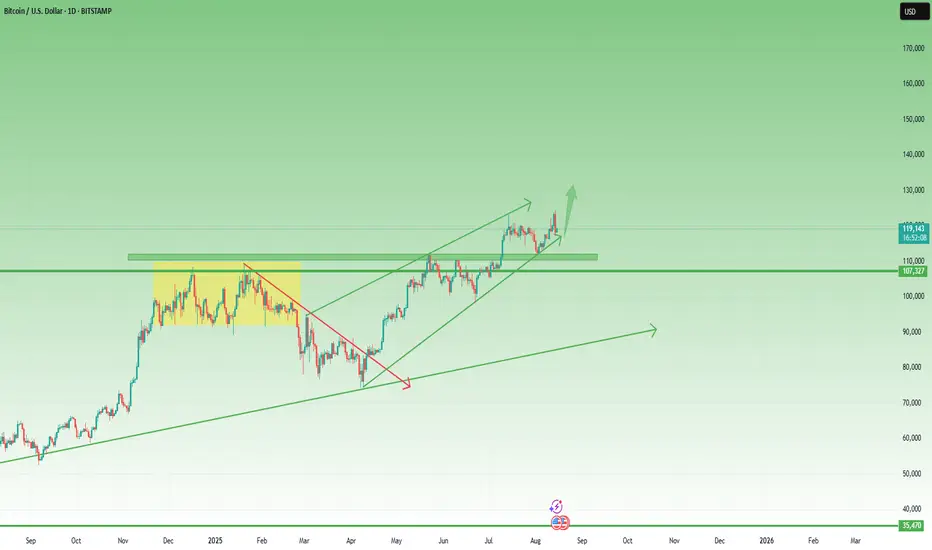
This BTC Pullback Doesn’t Break the Bullish StructureYesterday, BTC dropped around 5% from its freshly printed intraday ATH, reaching a low of 117,300. Should bulls be worried?
In my view, this drop can’t be seen as more than just a correction — while it was indeed quite deep, the overall structure remains fully intact.
Price is still comfortably above the ascending trendline that started in April, and even higher than the nearest horizontal support.
Bottom line: As long as BTC stays above the 110–112k zone, there’s no real reason for concern.
For short-term traders, this dip could even be seen as a buying opportunity — anticipating a push towards a new ATH above 125k. 🚀
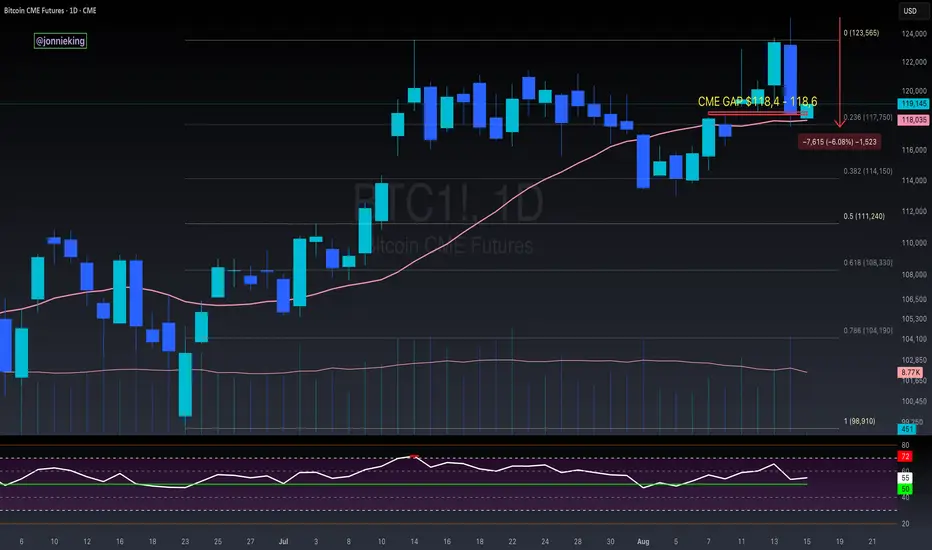
$BTC Bearish Engulfing Candle AlertGOOD NEWS:
-CME Gap was completely filled.
-PA is still above the 20DMA.
BAD NEWS:
-Very concerning Bearish Engulfing candle on the Daily Close.
-Volume confirms the change in trend.
MY TAKE: I wouldn't be surprised to see the market rally into a low liquidity weekend and dump hard on Monday.
Bitcoin \ Probably Nothing ! Bitcoin broke through the trend that had been continuing since 2017 and had remained unbroken for years in the past few weeks, and a retest was performed.

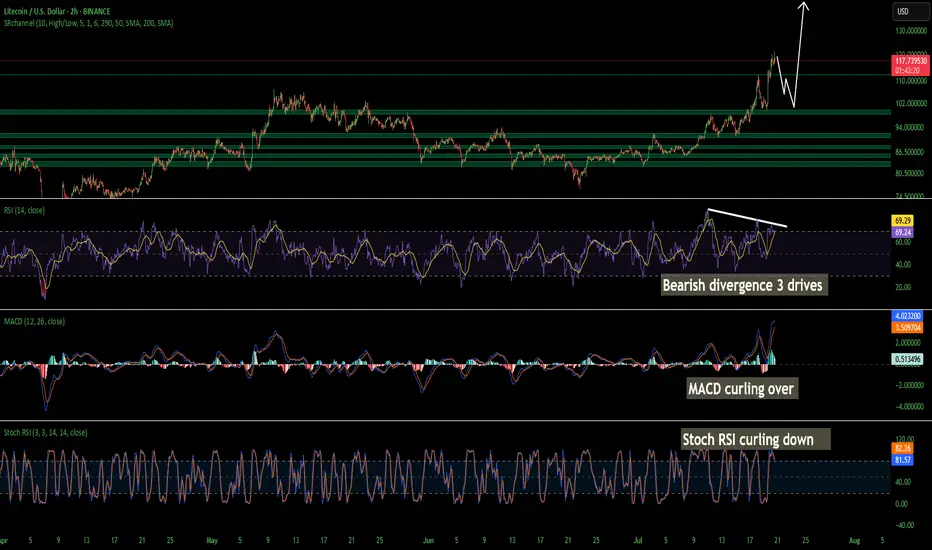
LTC Litecoin Short Term Pull Back Quick and SharpI believe Litecoin Is topping out on the 2 hour. Looks like we may come back down and tap support at around 104 but I wouldn't be surprised a wick hits 100. I have buy orders around 103-106. I am not super confident on a deeper pullback so thats why my buys are there is so i don't miss the dip. Id rather make a little less money than miss a buy in trying to nail the bottom. Litecoin is starting its breakout from a 7 year consolidation and accumulation phase. This should be pretty massive. Litecoin is going to benefit considerably from these new bills that are being signed and many of the favorites in the top 100 will soon disappear!
The time for Litecoin to shine as I have been talking about for years is now. I am almost certain that this is that time. My predictions all still hold if you would like to go read them. I was just off on timing. Timing is the hardest thing to predict especially with how wild this planet has been lately. None of this is financial advice its just my opinion.
#BITCOIN - What to Expect After the DUMP?The massive correction happened.
Why? Because of the PPI data rose to 3.3% — higher than expected. Typically, this news would not trigger such a massive sell-off.
However, people had grown accustomed to the bullish market and opened a ton of LONG positions with high leverage. As the result, a massive cascade of liquidations occured and drove the dump crazy.
TALKING ABOUT FURTHER POSSIBILITIES: We are still in the bullish market, but the next few days will determine the future of this cycle (at least for the next 1-2 months) . Bitcoin is now back inside the $116,500 - $119,500 consolidation range.
If we see some strong positive movements on Altcoins & Bitcoin this week, it will show that the real demand (whales & funds) are interested in pushing the price higher. However , if Altcoins & Bitcoin are weak, then most likely the TOP of this cycle was marked at $124,000.

BTC Daily Recap & Game Plan 14.08.2025BTC Daily Recap & Game Plan 14.08.2025
📊 Market Sentiment
Overall sentiment remains bullish, supported by expectations of a 0.25% rate cut in the upcoming FOMC meeting. A weakening USD and increasing global risk appetite are providing favorable conditions for further upside in crypto assets.
📈 Technical Analysis
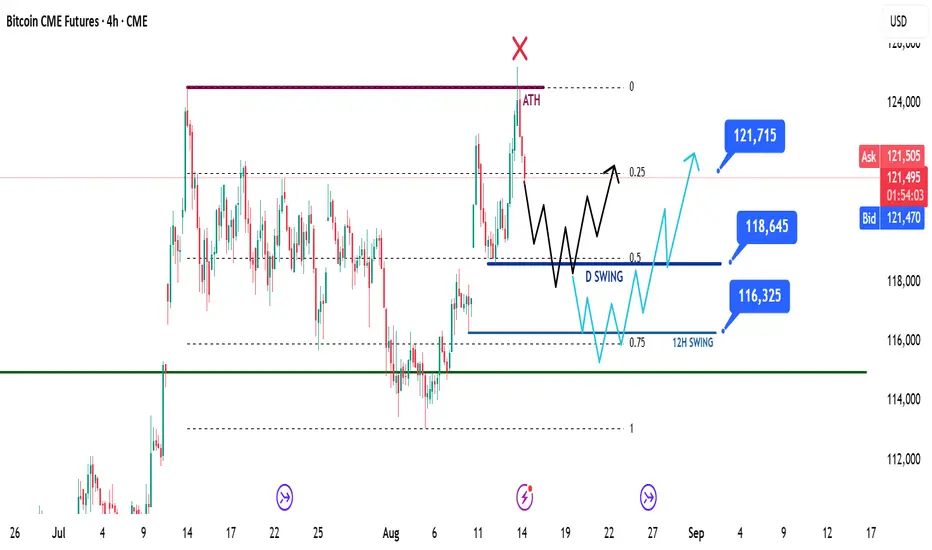
Price ran to all-time highs and faced rejection there.
The close below the all-time high level indicates that price may now seek opposite-side liquidity (buyers).
Historically, Bitcoin often consolidates within a range after running all-time highs, collecting more liquidity before continuing upward.
📌 Game Plan
I expect two possible scenarios:
1️⃣ Run the daily swing low and hit the equilibrium of the range at $118,645, then bounce and move up towards $121,750.
2️⃣ Run the 12H swing low and hit the 0.75 level of the max discount range at $116,325, then bounce and move up.
🎯 Setup Trigger
I will be watching for a 4H break of structure when either scenario occurs.
📋 Trade Management
Stop-loss: Below the 4H swing low that confirms the break of structure.
Target: TP1 at $121,750 and possible new highs. Targets will be updated depending on structure.
💬 Like, follow, and comment if you find this setup valuable!
Disclaimer: This is not financial advice. The content is for informational and educational purposes only and reflects personal opinions.
BITCOIN BULLS ARE GONNA DO THIS NOW!!!! (Fakeout Wick) Yello Paradisers! In this video, I've been updating Bitcoin price action and the Elliot Wave theory. I've been doing lots of advanced technical stuff. We've been going through channeling and updating ourselves about the most important support and resistance levels. We've been taking a look at the MACD histogram, the RSI, and the stochastic RSI. We've been professionally analyzing the volume; we've understood who is in power right now and what's going to happen next with the highest probability.
We've also been taking a look at what kind of confirmations we are waiting for in order for us to be able to open long or short positions.
Paradisers, make sure that you are trading with a professional trading strategy. Wait for confirmations, play tactically, and focus on long-term profitability, not on getting rich quick.
Remember, don’t trade without confirmations. Wait for them before creating a trade. Be disciplined, patient, and emotionally controlled. Only trade the highest probability setups with the greatest risk to reward ratio. This will ensure that you become a long-term profitable professional trader.
Don't be a gambler. Don't try to get rich quick. Make sure that your trading is professionally based on proper strategies and trade tactics.

Monthly chart bullflag has a breakout target around 115kIhave arbitrarily placed the measured move line for the bullflag breakout in the month of October but there’s always a chance it stays in the flag longer than that, in which case the measured move line would get moved over to the right and slightly lower each time it does. If it breaks up by october and validates that breakout the measured move target will be around 115k. *not financial advice*

ETH ROAD TO 20K+ plan BAs far as we are getting closer to the final accumulation stage on ETH we can see a potential shape of huge channel in log scale but even bigger I posted previous time due to price action and ETH going better I thought.
Still after forming median of the channel I would like to see a big and fast correction from here towards 2900 support which must hold imo.
Top of that channel depends on timing so the later the better I guess.

$BTC New Reaches ATH - Next Target $131kBANG!
CRYPTOCAP:BTC REACHES NEW ATH AT ~$124K 🥳
Next target $131k
Told ya this 3 days ago.
Can't believe some of ya'll are still fading me 🤗
