BTCUSDT.P - November 22, 2025Bitcoin is in a pronounced downtrend, with price action consistently making lower highs under the descending trendline and currently trading below both resistance levels at 86,313 and 88,214. Recent momentum remains bearish, with sellers actively defending rallies and price targeting the marked support band near 78,800–79,000; unless price recovers above 86,313 resistance, expect further weakness and trend continuation.
Btc-bitcoin

Will this date come true?This is not fundamentally unbelievable, especially with the manipulation of governments in the crypto market
What is completely clear to us activists is the manipulation of absurd markets with great temptation by the yellow-haired doll and the child politicians and child killers around him.
Although I am not active in this market, I feel sorry for you, despite this cesspool soaked in the blood and hearts of the people of the world!
These numbers may not be realized, but the much blood that has been spilled on the ground will rise and the consequences will drown it.
The freedmen will definitely win.
And I must say, this analysis may expire after a while:
Good luck
MJ.REZAEI

Bitcoin dropped as planned. Wait for a new range to take SHORTBitcoin dropped as planned. Wait for a new range to take SHORT
global trnedi si still down
at this moment big liqudation had happend that's why price could create a range before new down move

Bitcoin Next Move ? 108KWhy BTC Could Push Toward / Above $108K
Technical Setup
BTC is trading in a relatively tight range below the $107,500–$108,000 resistance.
Cycle & On-Chain Dynamics
Historically, Bitcoin bull cycles don’t peak immediately after a halving — this could mean room to run. Some analysts think we haven’t hit the top yet.
Some bullish chartists (e.g., “Titan of Crypto”) project a parabolic run if BTC clears $108K.
Is $108K A Realistic Next Move? Yes,

Bitcoin VS bearish crossAfter the bearish cross on the daily chart for Bitcoin, 75% of the time it has led to a bounce lasting 3–5 months, which triggers a rally in altcoins. This time we will probably see a nice altcoin rally until March 2026, IMO.

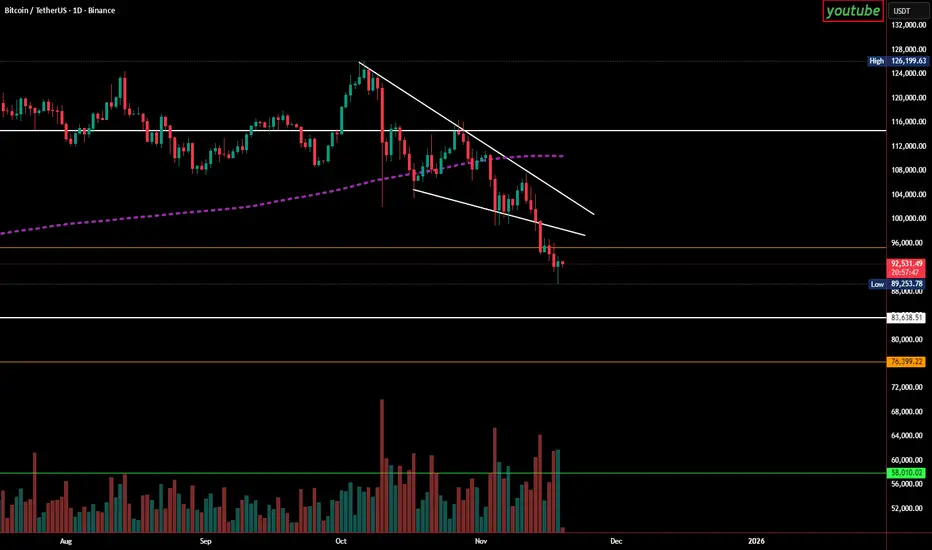
USDT-DOM- As usual, the charts tell the story very simply, watch the USDT triple top and the RSI divergence for clues.
- At times, tracking USDT trends gives clearer signals than watching BTC price alone.
- It’s an odd moment in the market, no real FUD, constant talk about crypto, yet price movements are surprisingly muted.
- Some major players are trying to shake out weak hands and buy your crypto lower. Stay focused: HODL and accumulate.
Time your entries and DCA, be a trader, not a victim of the cycle.
Happy Tr4Ding !

BITCOIN CRASH! TIME TO BUY?I hope you guys enjoyed the video! If you have any questions or comments; feel free to comment down below

BTCUSDT.P - November 21, 2025Price is in a short‑term downtrend, with a series of lower highs and lower lows after rejecting the highlighted resistance area near 92,300–92,500 and breaking back below intraday consolidation. Loss of upside momentum and a rotation from a prior minor rally confirming sellers’ control and opening the door for continuation toward the marked support area around 88,800–89,200.

Bitcoin Roadmap: Is This the Beginning of the Short-Term Rally?Today I want to share with you the Bitcoin ( BINANCE:BTCUSDT ) chart on the 15-minute time frame. This analysis is in line with the previous analysis (still valid) .
These days, considering that Bitcoin is facing many parameters to analyze. One of the most important parameters is the SPX500 index ( SP:SPX ). I am long on the SPX500 index.
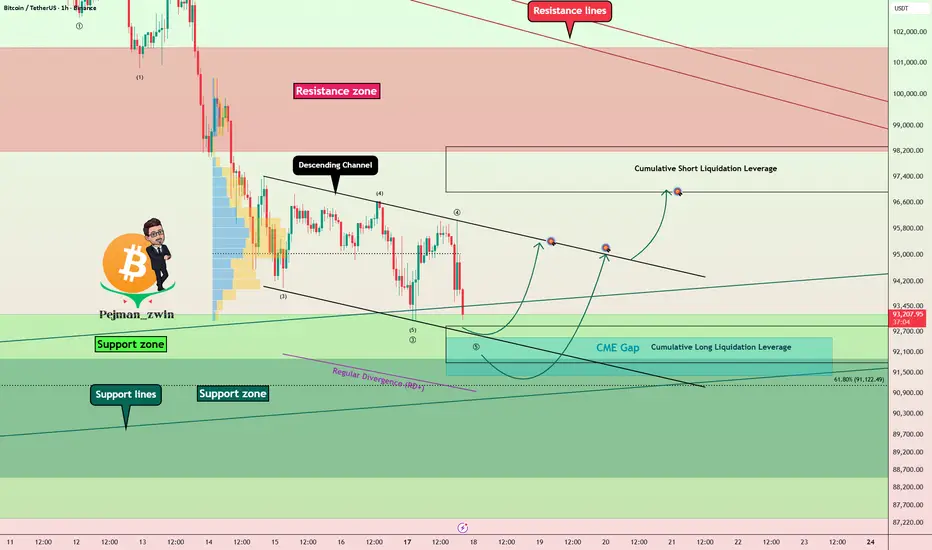
Bitcoin is currently moving in the Support zone($91,900-$88,400) and near the Support lines and Cumulative Long Liquidation Leverage($91,131-$90,477) .
In terms of Elliott Wave theory, it seems that Bitcoin completed wave 5 with an Expanding Ending Diagonal , and we can now expect the start of the bullish waves , at least in the short term .
I expect Bitcoin to start rising from the Support zone($91,900-$88,400) and at least attack the Resistance lines . If the Resistance lines and the $95,700 level are broken with high momentum, we can expect further growth of Bitcoin.
First Target: $93,921
Second Target: $95,273
Third Target: $97,477
Stop Loss(SL): $89,537
Points may shift as the market evolves
Cumulative Long Liquidation Leverage: $88,570-$87,227
Cumulative Short Liquidation Leverage: $94,500-$93,785
Where do you think Bitcoin’s correction will go?
Please respect each other's ideas and express them politely if you agree or disagree.
Bitcoin Analysis (BTCUSDT), 15-minute time frame.
Be sure to follow the updated ideas.
Do not forget to put a Stop loss for your positions (For every position you want to open).
Please follow your strategy and updates; this is just my Idea, and I will gladly see your ideas in this post.
Please do not forget the ✅' like '✅ button 🙏😊 & Share it with your friends; thanks, and Trade safe.

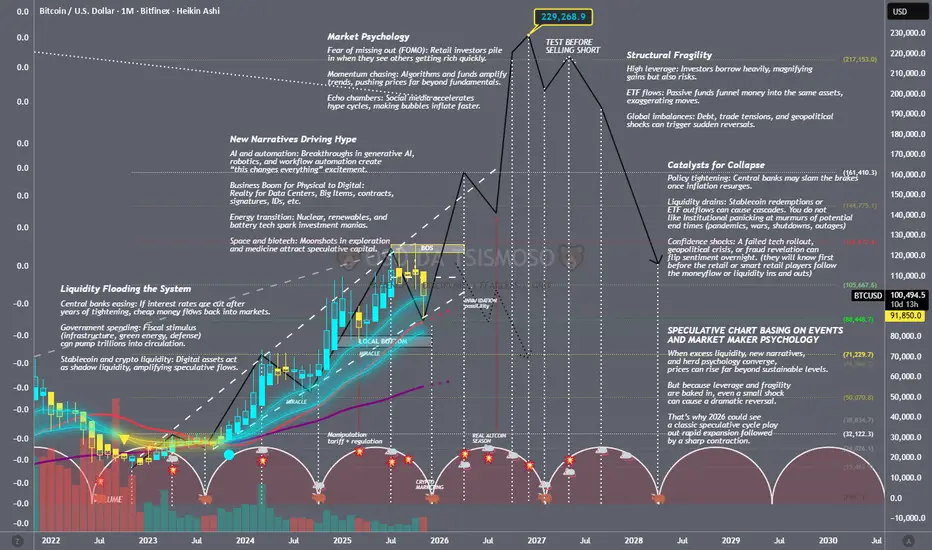
SPECULATIVE CHART (EVENTS AND MARKET MAKER PSYCHOLOGY FOR BTC)📘 Bitcoin Speculative Cycle (2026 Potential move I see)
1. Recognize the Setup
Liquidity conditions: Track central bank easing, stablecoin issuance, and ETF inflows. These are the fuel.
Narratives: Watch for hype drivers (AI + blockchain, tokenized real‑world assets, sovereign adoption).
Sentiment signals: Social media buzz, Google Trends, and retail inflows often spike before parabolic moves.
2. Identify the Expansion Phase
Price action: BTC breaks prior cycle highs with strong volume.
On‑chain metrics: Rising active addresses, increasing exchange inflows, and high leverage in futures.
ETF/Institutional flows: Monitor daily net inflows into Bitcoin ETFs — they magnify moves.
3. Ride the Momentum
Entry strategy: Scale in during confirmed uptrend (higher highs, higher lows).
Risk management: Use stop‑losses or hedge with stablecoins; never go all‑in.
Position sizing: Keep leverage modest speculative cycles punish overexposure.
4. Spot the Peak
Excessive leverage: Funding rates go extreme, perpetual swaps show unsustainable longs.
Retail mania: Everyone is talking about BTC, mainstream media runs “get rich quick” stories.
On‑chain warnings: Whales start sending coins to exchanges, signaling distribution.
5. Prepare for the Collapse
Exit strategy: Scale out when parabolic moves stall; don’t wait for the top tick.
Liquidity drains: Watch stablecoin redemptions and ETF outflows they trigger cascades.
Policy shocks: Rate hikes or regulatory crackdowns can flip sentiment instantly.
6. Survive and Reset
Capital preservation: Rotate into cash or defensive assets once the downtrend is confirmed.
Audit your trades: Document entries/exits to refine your playbook for the next cycle.
Re‑accumulate: Buy back BTC only after capitulation signs (low volume, despair, long consolidation).
🛠 Tools I used to track this;
On‑chain dashboards: Glassnode, CryptoQuant (free tiers give useful signals).
ETF flow trackers: Daily inflows/outflows for spot BTC ETFs.
Stablecoin supply charts: USDT/USDC issuance as shadow liquidity indicators.
Funding rate monitors: Binance, Bybit, Deribit for leverage extremes.
Bitcoin Downtrend UpdateAlright friends, Bitcoin has confirmed its intention to move toward 86,000 and lower.
My previous forecast with the invalidation zone at 96,600 is still valid, but I decided to make a fresh post.
At the moment, my new invalidation level is 96,012.5.
From a broader perspective, I’m still expecting Bitcoin to reach 83,000.
But as I mentioned earlier, we first need to see 86,000 tested — because once that level is hit, Bitcoin may go into a correction before continuing toward 83,000 and below.
Yes-yes, I do expect it even lower, but more on that in the upcoming updates.
Make sure to follow so you don’t miss them

What A Shocker That Would Be Huh?Blackrock, Saylor and gang are in for some big gains. As for most of you who sold you're in for a rude awakening!
BTCUSDT.P - November 20, 2025The chart shows a clear downtrend marked by descending highs and lows, with price currently heading near a key horizontal support around the 88,000 level. A descending trendline acts as overhead resistance, while the shaded area near 92,000 represents a notable resistance zone. Price action suggests two possible outcomes: a bearish breakdown below support could extend the decline toward 85,000, while a successful breakout above the trendline may trigger a reversal toward 92,000 resistance. Momentum currently favors the bears as the market retests support after sustained selling pressure.

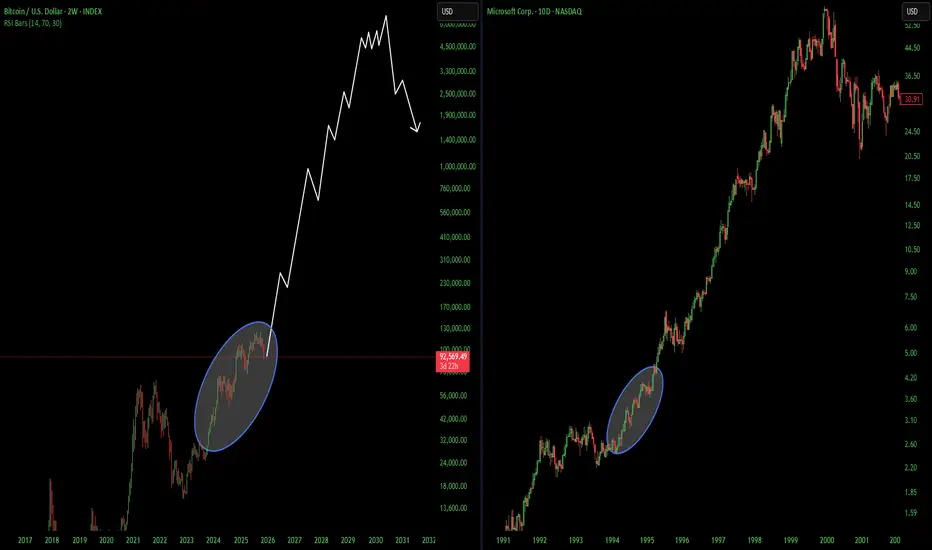
BTC At Sub 80k? The Structure Says It’s PossibleBTC has followed one pattern for two years.
Every major pullback reset 33–34% before the next leg up.
Look at the last cycles:
• 2024 dropped 34% from January to December
• Oct 2024 → Jan 2025: new highs, then a 33% retrace across four months
• Apr 2025 → Oct 2025: price ran from 74k → 125k, then stalled
• Every breakout in this range ended with the same size correction
The structure didn’t change. The market behaved the same every time.
From the 125k top, BTC still has room to drop 10–15%.
If the cycle repeats, the retracement lands near 80k before the next push.
History doesn’t repeat perfectly, but BTC has been consistent with this pattern.
I’m watching the range. My shorts stay open.

BITCOIN SIGNAL: NOBODY COUNTS ON THIS!!! (scary)Yello Paradisers! Enjoy the video!
And Paradisers! Keep in mind to trade only with a proper professional trading strategy. Wait for confirmations. Play with tactics. This is the only way you can be long-term profitable.
Remember, don’t trade without confirmations. Wait for them before creating a trade. Be disciplined, patient, and emotionally controlled. Only trade the highest probability setups with the greatest risk to reward ratio. This will ensure that you become a long-term profitable professional trader.
Don't be a gambler. Don't try to get rich quick. Make sure that your trading is professionally based on proper strategies and trade tactics.

BTC Bearish Scenario This idea is comes from a place purely of pattern recognition, I believe BTC still has more to give this cycle but I have noticed similarities between the "Trump pump" top and the most recent top/ price action:
Both tops feature a wick into the diagonal resistance, followed by a slightly larger wick making a new high before selling off.
After the highs in January BTC sold off back towards the trend support level, could BTC follow this pattern this time around too? So far they are tracking very closely, the beginning of November would be the bottom at trend channel support if this was to play out.
For me $108,000 is the key S/R level in this idea, a break below it would definitely open Bitcoin to the possibility, all the time price stays above it does look significantly stronger.

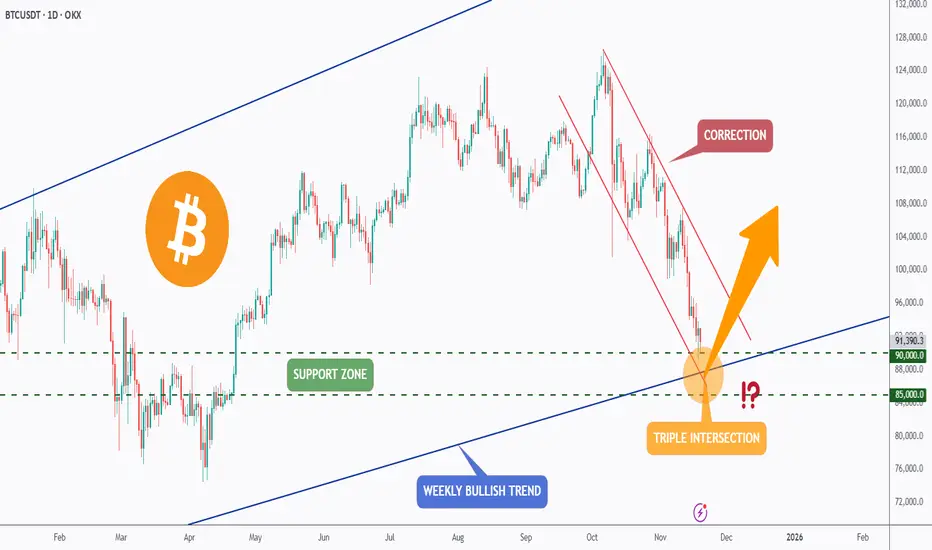
BTC - Triple Intersection… Now or Never for the Bulls?Bitcoin has been in a steep correction for weeks, sliding inside a clear falling channel. Despite the heavy sell-off, price is now approaching one of the strongest confluence zones on the entire chart, a triple intersection.
This key level combines:
1- The major weekly bullish trendline
2- The horizontal support between $85,000–$90,000
3- And the lower boundary of the falling corrective channel
This kind of alignment doesn’t happen often. It’s the area where long-term bulls typically show up.
As long as BTC holds above $85,000–$90,000, the macro bullish structure remains intact. A strong reaction here could trigger a reversal and kick off the next impulsive wave upward. However, if this triple confluence fails, the market may face a deeper correction before stabilising.
We’re standing at a decisive moment… will this zone ignite the next bullish leg or break down into another wave of fear? 🤔
⚠️ Disclaimer: This is not financial advice. Always do your own research and manage risk properly.
📚 Stick to your trading plan regarding entries, risk, and management.
Good luck! 🍀
All Strategies Are Good; If Managed Properly!
~Richard Nasr.
Bitcoin Hit $126,199 I Warned It Was the Top While Others Call..When Bitcoin surged to $126,199, nearly every major voice on social media was calling for the next leg up toward $200,000. I wasn’t one of them. While the hype machine kept pushing bullish narratives, I publicly warned that the move looked exhausted and that we were likely witnessing the cycle top.
Now, the chart is proving that call right.
Key Levels Are Breaking
Since topping out, Bitcoin has fallen below several major support levels — including the critical $95,000 zone. The technical structure has shifted decisively:
Trend has turned downward
Momentum has weakened
Sellers are dominating volume
Price continues to make lower lows
This is not what a path to $200K looks like — this is what a post-top correction looks like.
How Low I Believe Bitcoin Can Drop
Based on the current trend, market structure, and historical behavior after previous peaks, these are the realistic targets I’m watching:
$89,000 – initial support already under pressure
$83,000 – a major demand zone
$76,000 – deeper correction range
$58,000 – full cycle flush if panic accelerates
These levels aren’t guesses. They’re grounded in technical analysis and the same signals that helped me call the top at $126K.
I Went Against the Crowd — And It Paid Off
While most influencers kept telling their followers to buy, I warned that the upside was limited and that a sharp reversal was coming. The market is now validating that call.
My Outlook
Bitcoin is still the dominant asset in the crypto market, but the current pattern suggests more downward pressure before any meaningful recovery. For the trend to flip bullish again, price would need to reclaim key levels and break out of the descending structure.
Until then, the chart continues to follow exactly what I warned about:
The top was in at $126,199 — and Bitcoin was never going straight to $200K.
$BTC BOTTOM IN - Dragonfly Doji Reversal CandleBOTTOM IS IN
⚠️ Need to reclaim ~$95k within the next couple days to confirm, but I’m confident.
🐉 Printed a Dragonfly Doji Reversal candlestick with a Volume breakout to accompany.
🐉 RSI also sitting at lowest since Liberation Day.
🐉 Death Cross historically marks bottoms.
🐉 This 29% correction lines up perfectly with prior ones before next impulsive move up.

BTCUSDT.P - November 19, 2025Price is retesting the short-term resistance trendline and struggling to hold above the 93,000 area, suggesting weakening bullish momentum. A bounce toward the 94,000–95,500 resistance zone is possible, but failure to break higher may trigger a continuation of the broader downtrend toward the 89,000 support region.

BTC trend wont be your friend forever. Bitcoin just bounced off the bottom of the downward channel. Momentum is trying to shift, but trend is still bearish until bulls reclaim the $96K zone.
Key points:
• Oversold signals firing across stoch & wave-trend
• MACD curling from deep red — early reversal signs
• Volume profile shows a low-volume gap above → clean path if $96K is reclaimed
• Rejection there = continuation of the downtrend
• Break above = room toward mid-$100Ks
Relief bounce is forming, but structure hasn’t flipped yet. Eyes on the yellow level — that’s where this move gets confirmed or denied.

Bitcoin Roadmap: Major Support Ahead — Bounce or Breakdown?As expected in the previous idea , Bitcoin ( BINANCE:BTCUSDT ) has dropped to $93,040(Target done) .
The question now is whether Bitcoin will continue its downward trend or not.
Currently, Bitcoin is moving near the Support zone($93,200-$87,340) and key Support lines .
From the perspective of Elliott Wave Theory , Bitcoin seems to be completing Wave 5 , with the Wave 3 being extended .
I expect Bitcoin to start rising again by entering the Cumulative Short Liquidation Leverage($92,869-$91,763) and possibly from the lower line of the descending channel.
There is a possibility of a fake breakout , but be careful of the momentum of the decline.
First Target: $95,297(near the upper line of descending channel)
Second Target: $96,831
Stop Loss(SL): $90,727
Points may shift as the market evolves
Cumulative Long Liquidation Leverage: $98,338-$96,913
CME Gap: $92,525-$91,415
Note: Since Bitcoin has had a high correlation with the S&P 500( SP:SPX ) recently, and if the S&P 500 continues to decline, we can expect Bitcoin to follow suit.
Another important note is that rising tensions between the U.S. and Venezuela could also impact the crypto market, so we should keep that in mind.
Where do you think Bitcoin’s correction will go?
Please respect each other's ideas and express them politely if you agree or disagree.
Bitcoin Analysis (BTCUSDT), 1-hour time frame.
Be sure to follow the updated ideas.
Do not forget to put a Stop loss for your positions (For every position you want to open).
Please follow your strategy and updates; this is just my Idea, and I will gladly see your ideas in this post.
Please do not forget the ✅' like '✅ button 🙏😊 & Share it with your friends; thanks, and Trade safe.
How to build a Healthy Trading MindsetMany traders underestimate how much psychology shapes their results. This guide outlines the foundations of a strong trading mindset that supports consistent and disciplined decision-making.
1. Understand That Emotional Discipline Is a Skill
Trading naturally triggers emotions such as fear, frustration, greed, and impatience. These reactions are not weaknesses; they are human. What separates consistent traders from inconsistent ones is their ability to recognize emotions without acting on them.
A resilient mindset comes from training, not talent.
2. Create Distance Between Yourself and Your Trades
Do not tie your self-worth to the outcome of a single position. A loss does not mean you failed, and a win does not mean you are skilled. When traders begin to link identity to results, they make impulsive decisions.
Use phrases like “this trade” instead of “my trade” to remove ownership bias.
3. Focus on Process, Not Profit
Most traders sabotage themselves by obsessing over the end result. The market does not reward effort; it rewards alignment with probability.
Instead of thinking “How much can I make?”, think “Did I execute according to my plan?”
Your trading plan should define your entries, exits, risk, and market conditions. Follow it even when it feels uncomfortable.
4. Accept Uncertainty as Part of the Game
No setup is guaranteed. Every trade, no matter how perfect, carries uncertainty. Accepting this prevents you from forcing control where none exists.
When you fully accept uncertainty, you no longer fear it.
5. Build Consistency Through Routine
A stable routine reduces mental noise. Examples include:
• Reviewing your plan before each session
• Limiting how many markets you monitor
• Taking breaks after high-stress situations
• Logging your trades with honest notes
When your routine is consistent, your decisions become consistent.
6. Use Losses as Data, Not Drama
A loss is not a personal attack from the market. It is information.
Ask: “What does this loss teach me about my system or my mindset?”
If you can extract value from losses, they become opportunities instead of obstacles.
7. Master Patience
Most trading errors come from acting too soon, not too late. Patience means waiting for your setup without deviation.
If you need to be in a trade at all times, it is no longer trading; it is compulsion.
8. Protect Your Mental Capital
Mental capital is as important as financial capital. Overtrading, revenge trading, and excessive chart time drain your cognitive energy.
Stop trading when you notice fatigue, frustration, or impulsiveness. A clear mind is an advantage.
9. Develop Long-Term Thinking
Think in terms of series, not individual outcomes. A single win or loss means little. What matters is the overall direction of your equity curve.
Professional traders think in months and years. Amateurs think in minutes.
Conclusion
A powerful trading mindset is built through consistency, self-awareness, and emotional control. By focusing on process and discipline rather than short-term results, you create a stable internal environment that supports longevity in the markets.