Ethereum Game Plan - TDLRKZ MODELEthereum Game Plan - TDLRKZ MODEL
📊 Market Sentiment
On 29/10, the FED lowered rates by 25BPS, as expected. However, Powell’s comments introduced uncertainty regarding another cut in December, stating that further policy moves depend on incoming data.
Interestingly, one FED member dissented, preferring no cut this cycle — a shift from September when all members supported easing.
Following the statement, rate-cut expectations dropped from 95% to 68%, prompting traders to take profits and hedge, creating a short-term bearish sentiment across markets.
Despite this, the mid-to-long term outlook remains bullish, given the broader liquidity cycle and easing policy bias.
📈 Technical Analysis
Ethereum is currently accumulating inside a well-defined range.
Price failed to sustain above the $4950 range high and has started retracing toward the HTF bullish trendline, a potential reaction zone aligning with prior liquidity pools and confluences.
If price holds around this zone, ETH could seek the range high again once momentum returns.
📘 Model in Use – Trendline Deviation with HTF LR into Key Zone (TDLRKZ Model)
This model identifies setups where price deviates from HTF trendlines while interacting with liquidity zones and key structural levels.
The goal is to align HTF context with LTF confirmation for high-probability trend continuation setups.
Model Steps:
1️⃣ Identify the HTF trend direction and only trade in that direction.
2️⃣ Mark the HTF bullish trendline supporting price.
3️⃣ Spot HTF Key Zones likely to act as reaction areas.
4️⃣ Locate nearby liquidity pools or order concentrations.
5️⃣ Wait for confluence: when all align, confirm with a 4H market structure break for entry.
📌 Game Plan
Looking for ETH to retrace into $3350 and reject from that level.
If a 4H break of structure occurs and daily candle closes above $3350, this will trigger a long-biased setup.
🎯 Setup Trigger
→ 4H structure break after tagging $3350
→ Daily close above $3350
📋 Trade Management
→ Entry: After confirmation above $3350
→ Stop Loss: Below swing low that caused 4H break of structure
→ Targets:
TP1: $4150 (EQ)
TP2: $4550
TP3: $4950 (Range high)
→ Move SL to breakeven after TP1 is reached.
💬 Check my Substack for deeper macro and sentimental breakdowns — free subscriptions are open.
⚠️ Disclaimer: This content is for educational purposes only and does not constitute financial advice. Always DYOR before trading.
Btc-bitcoin

BTCUSDT.P - October 30, 2025BTCUSDT.P - In-depth analysis | 1D Timeframe
Trend Structure:
The market is currently consolidating after a notable uptrend that peaked near the $127,000 zone. Recent weekly candles display lower highs and moderate-bodied structures, suggesting a weakening bullish impulse. The current range is bounded by resistance at $126,200–$132,900 and support at $101,500, with a deeper structural support near $74,450.
Trend Strength:
Trend momentum is weak, indicated by a low strength reading. The loss of directional follow-through implies the market is entering a mid-cycle cooling phase or secondary correction within a broader bullish structure.
Volatility Conditions:
Volatility remains moderate, reflecting an equilibrium between buyers and sellers. This volatility profile typically precedes a breakout move after extended consolidation.
Squeeze:
Current market condition suggests energy buildup and potential for a decisive breakout in the coming weeks.
Bias:
Given the weakening trend and active squeeze near mid-range support, the near-term bias is SHORT, targeting potential tests of the $101,500 level before any renewed bullish continuation can be confirmed above $126,000.

Bitcoin is crazy volatile as rates get cutBTC reacted by selling off while the news of a 25bps interest rate cut was being released. Despite the bullish news, the market still sold; however price is still respecting the range and did not produce a lower low. These moments are designed it inflict pain and flush holders out of the market. Have strong risk management and don't risk what you are not willing to lose.

Bitcoin strong, Dominance weak.Bitcoin maintained its strength above the major uptrend and support zone, while BTC Dominance broke below the major uptrend and also received confirmation of a retest of the major resistance and major uptrend for the downside.
For altcoins, this is a trend towards the beginning of a new momentum.

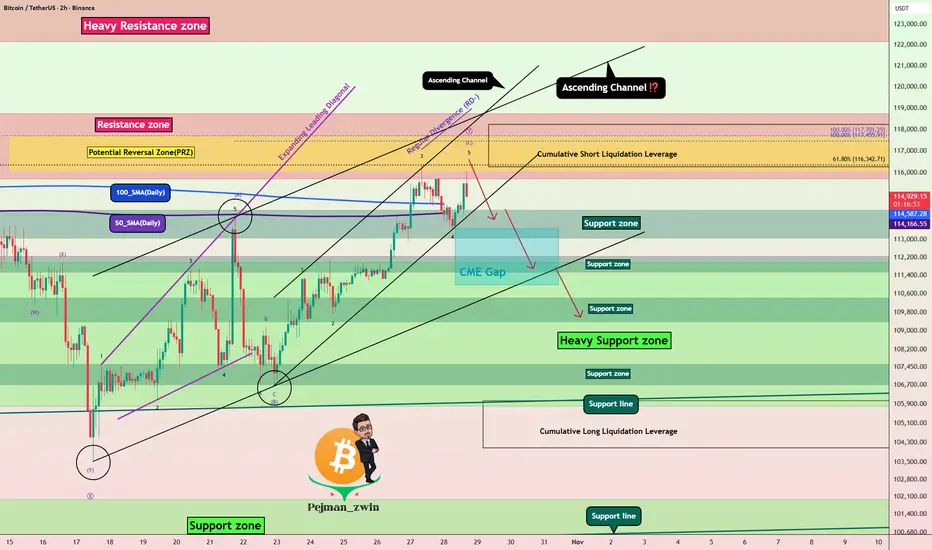
Bitcoin Hits PRZ – Time for a Correction?As I expected yesterday , Bitcoin ( BINANCE:BTCUSDT ) did drop down to the Support zone($114,300-$113,000) at the lower line of the ascending channel and then started rising again today. Both Long and Short positions basically hit their Targets .
At the moment, Bitcoin is moving near a Resistance zone($118,740-$115,740) , the Potential Reversal Zone(PRZ) , and Cumulative Short Liquidation Leverage($118,224-$116,281) .
From an Elliott Wave perspective , it seems like Bitcoin is completing the microwave 4 of the microwave C of the main wave Y . There's a noticeable Negative Regular Divergence(RD-) between the last two peaks, which suggests some weakening momentum .
I expect that Bitcoin won't break through the Resistance zone($118,740-$115,740) easily and may fall back at least to the Support zone($114,300-$113,000) . If it drops below the 100_SMA(Daily) and 50_SMA(Daily) , we could see a deeper decline and possibly the CME Gap($113,495-$110,990) being filled.
Note: Another point to mention is that although the SPX500( TVC:SPX ) has been hitting new all-time highs as the new week began, BTC has shown a bit less correlation with it in the last day. So if the S&P 500 undergoes a correction, Bitcoin might actually see a sharper pullback, which is something to watch out for as a potential negative factor for Bitcoin.
Note: Also, keep in mind that tomorrow, some important U.S. economic indices will be released, which could also influence the market. So definitely factor that into your considerations.
Note: In general, the crypto market in the past couple of weeks has been heavily influenced by news around U.S.-China tariffs. Any headline can cause Bitcoin and other tokens to swing up or down, so keep an eye on those geopolitical headlines.
Cumulative Long Liquidation Leverage: $106,033-$104,090
Please respect each other's ideas and express them politely if you agree or disagree.
Bitcoin Analysis (BTCUSDT), 2-hour time frame.
Be sure to follow the updated ideas.
Do not forget to put a Stop loss for your positions (For every position you want to open).
Please follow your strategy and updates; this is just my Idea, and I will gladly see your ideas in this post.
Please do not forget the ✅' like '✅ button 🙏😊 & Share it with your friends; thanks, and Trade safe.
BITCOIN SIGNAL: SECRET PATTERN ABOUT TO BREAKOUT (massive)!!!!!!Yello Paradisers! Enjoy the video!
And Paradisers! Keep in mind to trade only with a proper professional trading strategy. Wait for confirmations. Play with tactics. This is the only way you can be long-term profitable.
Remember, don’t trade without confirmations. Wait for them before creating a trade. Be disciplined, patient, and emotionally controlled. Only trade the highest probability setups with the greatest risk to reward ratio. This will ensure that you become a long-term profitable professional trader.
Don't be a gambler. Don't try to get rich quick. Make sure that your trading is professionally based on proper strategies and trade tactics .

$GOLD is COOKED! Rotation into $BTC Soon!!MARKETS ARE SIGNALING RISK-ON 🔥
TVC:GOLD is so unbelievably COOKED 👨🍳
3 Black Crowes printed on the Daily, with a decisive close below the 20MA 🗡️
Waiting on the final nail in the coffin to close below the DANGER ZONE ~$3,900 where we will then see GOLD retest the 50MA along with the 50% Gann retrace $~3,750 ⚠️
I very much expect the rotation into CRYPTOCAP:BTC soon 👑

Bitcoin Rally Heating Up – Watch This Zone Carefully!As the new week kicked off, Bitcoin ( BINANCE:BTCUSDT ) started to climb, fueled by a pump in the S&P500 index ( SP:SPX ) and the creation of a gap in the S&P500 index.
It seems Bitcoin has successfully broken above the 100_SMA(Daily) and 50_SMA(Daily) , as well as a Resistance zone($114,300-$113,000) .
In fact, Bitcoin has also formed a new CME Gap($113,495-$110,990) due to this S&P500 Index -driven surge.
Right now, Bitcoin is approaching the next key Resistance zone($118,740-$115,740) , Potential Reversal Zone(PRZ) , the Cumulative Short Liquidation Leverage($117,577-$116,731) , and the upper line of an ascending channel .
From an Elliott Wave perspective , by breaking this Resistance zone($114,300-$113,000) , Bitcoin has entered a new phase of wave counting. It appears to be completing microwave 4 of the main wave C . Overall, the corrective structure seems to be a Zigzag Correction(ABC/5-3-5) with an expanding leading diagonal in main wave A .
I expect that in the coming hours, after a pullback to the broken Resistance zone($114,300-$113,000) and those moving averages , Bitcoin might rise again at least up to the Potential Reversal Zone(PRZ) . There's a possibility of forming a larger ascending channel, but since we haven't confirmed a second top, we can't rely on that channel just yet.
Note: In general, the crypto market in the past couple of weeks has been heavily influenced by news around U.S.-China tariffs. Any headline can cause Bitcoin and other tokens to swing up or down, so keep an eye on those geopolitical headlines.
Cumulative Long Liquidation Leverage: $113,625-$112,175
Cumulative Long Liquidation Leverage: $106,033-$104,090
Note: If Bitcoin falls below the moving averages and the Resistance zone($114,300-$113,000) again, we can expect further declines.
Please respect each other's ideas and express them politely if you agree or disagree.
Bitcoin Analysis (BTCUSDT), 2-hour time frame.
Be sure to follow the updated ideas.
Do not forget to put a Stop loss for your positions (For every position you want to open).
Please follow your strategy and updates; this is just my Idea, and I will gladly see your ideas in this post.
Please do not forget the ✅' like '✅ button 🙏😊 & Share it with your friends; thanks, and Trade safe.

BTC Enters Breakdown Area — Volume Could Push Back Below $110KBTC Enters Breakdown Area — Volume Could Push Back Below $110K ⚠️
The previous volume that took BTC before 101K has some trends of this volume, which has a manipulation views, the volume before that did took BTC below 101K ended with a fakeout.
Bitcoin has entered the breakdown area, showing early weakness as price struggles to hold momentum near $115K.
The recent volume spike looks more like distribution pressure than accumulation, signaling that a correction phase could be forming.
📉 Current outlook:
Breakdown zone between $116.3K – $109.7K is active.
Volume is rising, but without strong upward continuation — a sign of selling absorption.
If this pattern holds, BTC could retest the $110K zone or drop slightly below in the next move.
📊 Observation:
The market is testing the upper side of the breakdown range but lacks follow-through.
A close back under $114K would confirm weakness and invite further downside momentum.
💬 Summary:
BTC is inside its breakdown area, and current volume suggests pressure may build to drive price back below $110K if buyers fail to reclaim control soon.

BITCOIN to 160kAccording to the 2 parallel long-term trend-lines , there is a chance the top one at 160k work as resistance again like 2024

Bitcoin Breakout or a Deeper Rest Ahead ?👋🏻 Hey everyone! Hope you’re doing great! Welcome to SatoshiFrame channel.
✨ Today we’re diving into the 4-Hour Bitcoin analysis. Stay tuned and follow along!
👀 We’re looking at Bitcoin on the 4-hour timeframe. Bitcoin is currently in a bullish correction and awaiting tomorrow’s news. It’s worth noting that this upward correction is happening below the key resistance level at $115,555. A breakout above this zone could allow Bitcoin to continue the bullish leg it has already started.
🧮 Looking at the RSI oscillator, Bitcoin’s momentum previously entered the overbought area but has now exited and is oscillating below the 70 zone, which now acts as the current resistance level.
✔️ Let’s pay closer attention to Bitcoin’s trading volume — as price approached its major resistance, volume increased. However, given the upcoming news, this wasn’t enough to break resistance, and Bitcoin was rejected from that zone, pulling slightly downward. This downward move isn’t very strong and is accompanied by weak corrective momentum.
✍️ The current Bitcoin scenarios have been updated — you can now focus more closely on these scenarios in the next part of the analysis.
🟢 Long position scenario: A breakout above the key resistance level at $115,555, combined with rising buy volume and an RSI swing above the 70 zone, could mark the end of the correction and continuation of the bullish move.
❤️ Disclaimer : This analysis is purely based on my personal opinion and I only trade if the stated triggers are activated .

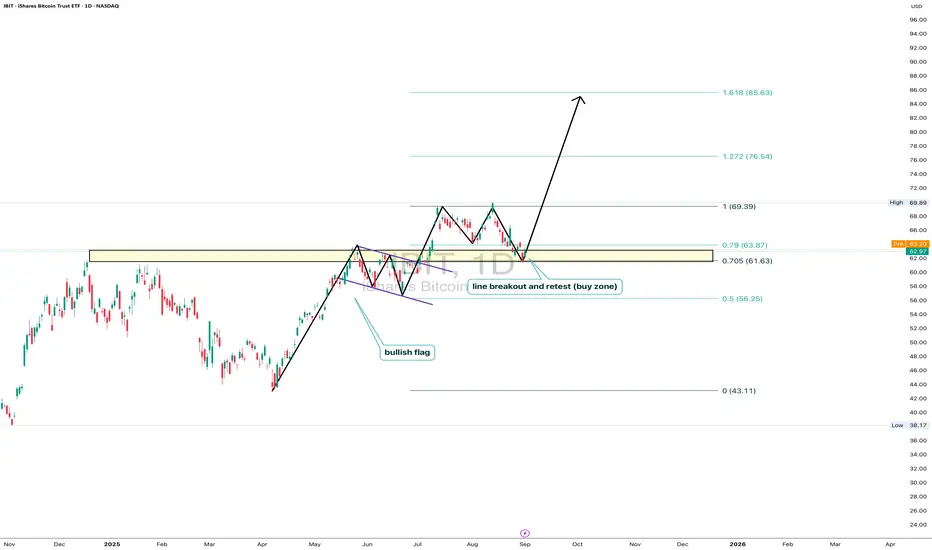
IBIT: ready for liftoffOn the daily chart, iShares Bitcoin Trust (IBIT) trades at $62.97, testing the key 0.705–0.79 Fibo zone ($61.63–63.87). This area marks a breakout and retest line, forming a clear buy zone. The technical structure remains bullish: after breaking out and pulling back, price holds potential to move toward $69.39, with Fibo extensions targeting $76.54 and $85.63. Volumes confirm buyer activity on dips, and the bullish flag pattern supports the continuation of the upward trend.
Fundamentally , the main driver is bitcoin itself, with institutional demand for BTC ETFs staying strong. Large funds continue accumulating positions, while expectations of a softer Fed tone add pressure on the dollar, fueling capital inflows into crypto. This strengthens the bullish case for IBIT.
Tactical plan: watch $61.6–63.8 as the key entry zone. Holding above opens the path toward $69.3, followed by $76.5 and $85.6. The scenario breaks only if price falls below $61.
And let’s be honest: IBIT isn’t just a ticker - it’s the “accelerate bitcoin” button for your portfolio.
BITCOIN SIGNAL: SHOCKER TARGET REVEALED!!! (warning) Yello Paradisers! Enjoy the video!
And Paradisers! Keep in mind to trade only with a proper professional trading strategy. Wait for confirmations. Play with tactics. This is the only way you can be long-term profitable.
Remember, don’t trade without confirmations. Wait for them before creating a trade. Be disciplined, patient, and emotionally controlled. Only trade the highest probability setups with the greatest risk to reward ratio. This will ensure that you become a long-term profitable professional trader.
Don't be a gambler. Don't try to get rich quick. Make sure that your trading is professionally based on proper strategies and trade tactics.

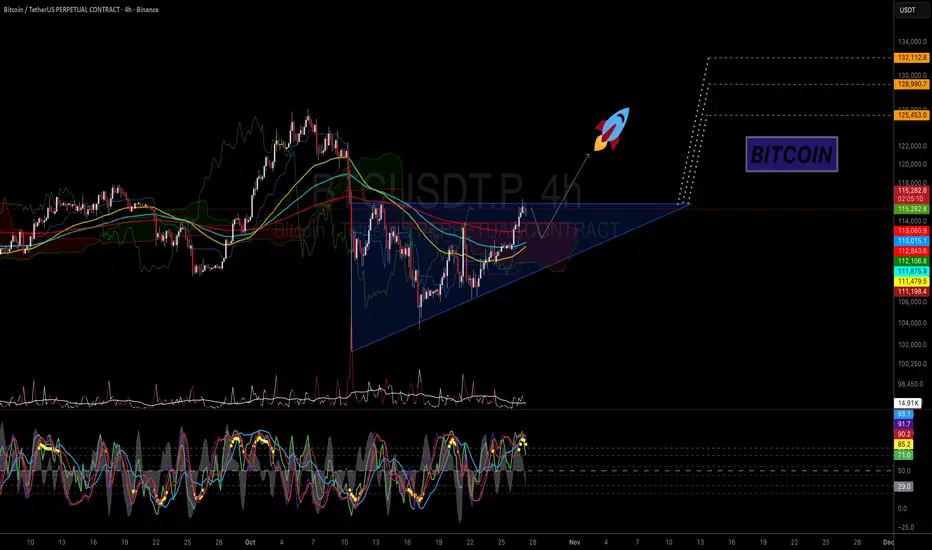
BTC - Ascending Triangle in PlayMorning fellas,
Halloween coming up and trust me, we gonna get that pump and one more leg up to ATH.
Obv you do you, its your money so its up to you the risk you take, but I am riding this like a biker riding a harley over a sunset.
Trade thirsty, my friends!
Will Bitcoin on 4H Push Higher or Take a Breath? | BTC 11👋🏻 Hey everyone! Hope you’re doing great! Welcome to SatoshiFrame channel.
✨ Today we’re diving into the 4-Hour Bitcoin analysis. Stay tuned and follow along!
👀 Looking at Bitcoin on the 4-hour timeframe, we can see that after breaking its multi-timeframe resistances, it is currently located near the price resistance of $115,793. If Bitcoin breaks this area, it can move toward its next resistance at $121,000.
🧮 Observing the RSI oscillator, we can see that it is currently in its OverBuy zone, and the important point here is to wait for it to exit the overbought area and form a new oscillation structure.
🎇 Pay attention to Bitcoin’s volume, which has been increasing up to this point. Even as it reaches the current resistance, buying volume is still rising and buyers are trying to push prices higher. But since there’s potential for selling pressure, we wait for volume to decrease a bit and allow the market to rest.
✍️ The scenario ahead for Bitcoin is independent of any trade or position, but we can use it to better understand Bitcoin’s corrective or resting behavior.
🛡 Bitcoin has just experienced a beautiful bullish leg across multi-timeframes, and the effects of this upward wave have also extended into higher timeframes such as the 4-hour and daily charts. Price, in a multi-timeframe structure, now requires a short-term correction and a pullback to fill lower buy orders. Keep in mind that traders typically take profit in such zones.
❤️ Disclaimer : This analysis is purely based on my personal opinion and I only trade if the stated triggers are activated .

27/10/25 Weekly OutlookLast weeks high: $115,481.36
Last weeks low: $106,688.94
Midpoint: $111,085.15
It's FOMC week again and with it comes speculation and volatility. With the Fed forecast to cut rates another 0.25% where does this leave Bitcoin?
After weeks of consolidation between $106,000 - $111,000 BTC broke above $112,000 resistance level suggesting that sellers have largely been absorbed and momentum is returning to the upside. Trading volume surged as BTC crossed the $112,000 threshold, indicating strong conviction from both institutional and retail participants.
Short-term volatility is expected around the FOMC announcement, I would not rule out a $112,000 retest, it would be a good indicator of just how strong this breakout move is. Macro conditions continue to favor Bitcoin’s long-term bullish case particularly if the Fed signals an eventual shift toward easing in 2026 which is already being discussed.
The next major test lies around $120,000 if weekly high resistance is flipped, but a decisive close above this threshold would likely trigger another wave of momentum buying toward $125K and beyond.
For the bear case a loss of $112,000 would mean a revisit of the same $106,000 - $111,000 range and an increasing loss of momentum for the bull run.
Good luck this week everybody!

BITCOIN This is what separates 128k from 104k.Bitcoin (BTCUSD) just broke above its 1D MA50 (blue trend-line) for the first time in 2 weeks and only days after it got rejected there. A 1D candle closing above it will be a strong bullish signal.
As BTC has been trading within a Megaphone pattern similar to the December 2024 - April 2025 one, a closing above the 1D MA50 might put the structure in a similar situation as April 17. As you can see that Megaphone also had a 1D MA50 rejection preceding the break-out and before that also, two Lower Lows near the 1W MA0 (red trend-line).
What it hasn't had (so far?) is a clear touch of the 1W MA50 (as on April 07) and a 1D MACD Higher Lows Bullish Divergence.
As a result, both scenarios are open for now. Until it closes above the 1D MA50, a 1W MA50 test remains possible around $104000. A closing above the 1D MA50 though strengthens the probability of a 1.1 Fibonacci extension rally at $128000.
What do you think is more likely to happen? Feel free to let us know in the comments section below!
-------------------------------------------------------------------------------
** Please LIKE 👍, FOLLOW ✅, SHARE 🙌 and COMMENT ✍ if you enjoy this idea! Also share your ideas and charts in the comments section below! This is best way to keep it relevant, support us, keep the content here free and allow the idea to reach as many people as possible. **
-------------------------------------------------------------------------------
💸💸💸💸💸💸
👇 👇 👇 👇 👇 👇

BTC correction complete?BTC is heading to the top of the channel once more after testing support High Volume Node, swinging below the macro trend-line and daily 200EMA before recovering.
FEAR was in hold of social media. Cycle top nonsense is a poison narrative to success
Price is above the daily pivot and 200EMA in a bull structure. RSI crossed bullishly.
Safe trading

Bitcoin back above 20MA WEEKLYAfter the strong press to the downside and bitcoin dropped about 16% , did test the 34MA on WEEKLY but now could closed the weekly candle above 20MA again last night which is a bullish sign

$BTC Reclaims 20WMA and .236 Fib on Weekly CloseSAVED BY THE BELL 🛎️
₿itcoin avoided forming a 3 Black Crowes pattern and has now reclaimed the 20WMA along with the .236 Fib, closing above the Danger Zone ⚠️
CRYPTOCAP:BTC now needs some decisive Weekly Closes above these key levels in order for the next leg up.
Don’t F this up Bulls!

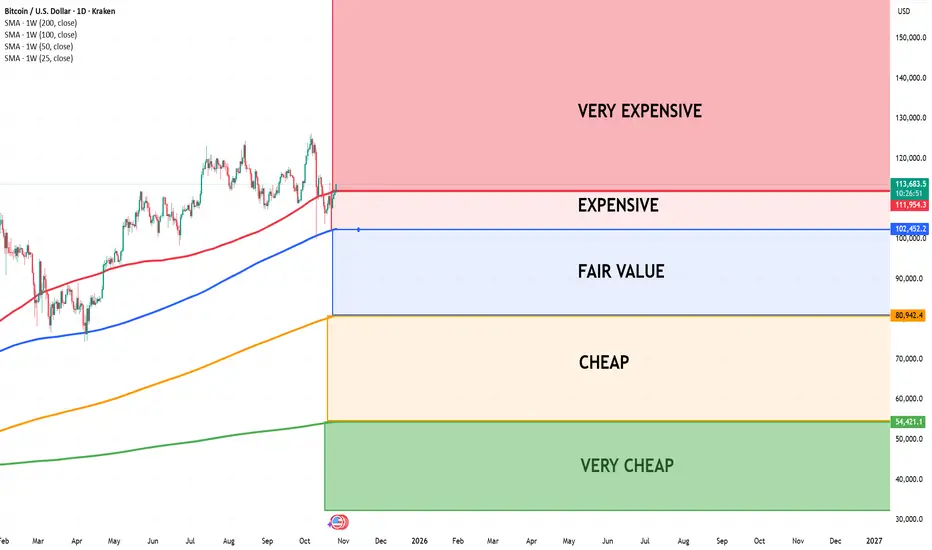
Bitcoin entering Very Expensive areaI use four key Moving Averages — the 25W, 50W, 100W, and 200W — to assess whether Bitcoin is overvalued or undervalued.
Bull Market Strategy:
When Bitcoin touches the 50-week Moving Average (50W MA) during a bull market, it often represents its fair value — typically an excellent buying opportunity.
Expensive Zone:
When Bitcoin trades above all four moving averages (25W, 50W, 100W, 200W), it enters the expensive zone. In this phase, we can usually expect a short-term continuation upward, followed by a pullback to retest or cross below some of the averages.
Bear Market Strategy:
During bearish periods, patience is key. The best long-term entry opportunities often occur when Bitcoin drops below the 200-week Moving Average (200W MA) — historically marking undervalued territory.
Based on current cycles, this scenario may unfold again around 2026.
Bitcoin Roadmap– Next Move Down Incoming?As I expected yesterday , Bitcoin ( BINANCE:BTCUSDT ) started rising from the Support zone($107,580-$106,700) and has now hit its Target at the Resistance zone($110,430-$109,380) .
Now the question is: will Bitcoin continue its short-term uptrend in the next few hours, or is it going to drop again? Stay with me to find out.
Bitcoin is trading near the Resistance zone($110,430-$109,380) , Potential Reversal Zone(PRZ) , and Cumulative Short Liquidation Leverage($111,613-$110,542) .
From an Elliott Wave perspective , it seems that Bitcoin is completing the wave C of an Expanding Flat Corrective Pattern(ABC/3-3-5) .
Given that the S&P 500 ( SP:SPX ) ( which has recently been correlated with Bitcoin ) is likely to drop when the U.S. market opens , I expect Bitcoin to resume its decline . This next drop might be the final push to break the Heavy Support zone($111,980-$105,820) .
What do you think? Can Bitcoin break that Heavy Support zone($111,980-$105,820) in the end or not? Let me know your thoughts!
Cumulative Long Liquidation Leverage: $106,606-$105,463
Please respect each other's ideas and express them politely if you agree or disagree.
Bitcoin Analysis (BTCUSDT), 15-minute time frame.
Be sure to follow the updated ideas.
Do not forget to put a Stop loss for your positions (For every position you want to open).
Please follow your strategy and updates; this is just my Idea, and I will gladly see your ideas in this post.
Please do not forget the ✅' like '✅ button 🙏😊 & Share it with your friends; thanks, and Trade safe.

Bitcoin Game Plan – RAKZ ModelBitcoin Game Plan – RAKZ Model
📊 Market Sentiment
Bitcoin’s sentiment is currently volatile but shifting bullish due to macroeconomic and geopolitical factors.
The U.S. is entering a quantitative easing (QE) phase, which historically channels liquidity toward risk assets.
After a softer CPI print on 24/10, the FED is expected to cut rates twice (total 50 BPS) this year.
Meanwhile, improving relations between the U.S. and China ease global trade concerns, reducing macro risks.
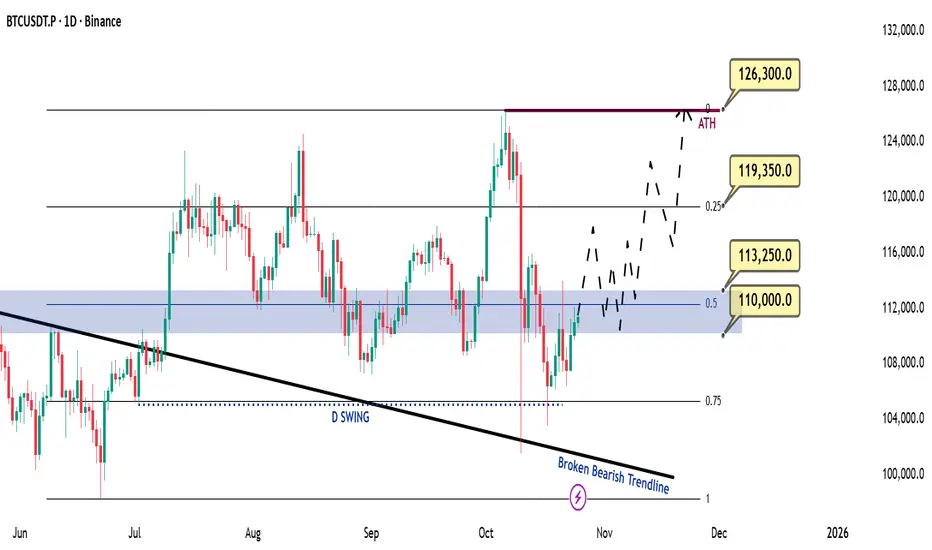
📈 Technical Analysis
Bitcoin is currently trading within a defined range.
Price recently retraced to the bearish trendline, ran Daily Swing Liquidity, and rejected from a Higher Timeframe Demand Zone — all within the 0.75 max discount zone.
This setup suggests a potential range accumulation phase before a bullish expansion.
I’m monitoring price action closely as it consolidates, building momentum for a possible breakout.
📘 Model in Use – Range Accumulation with HTF Key Zone (RAKZ Model)
This model identifies price accumulation inside higher timeframe zones and aims to capture continuation moves once structure confirms strength.
Model Steps:
1️⃣ Identify range accumulation on HTF.
2️⃣ Wait for price to tap EQ or 0.75 zone.
3️⃣ Confirm daily close above EQ or key zone.
4️⃣ Enter on breakout or retest of the key zone.
5️⃣ Validate with LTF market structure confirmation before entry.
📌 Game Plan
Wait for a daily close above $113,250, the confluence of both the EQ of the range and a HTF Key Zone.
That daily confirmation will signal bullish continuation.
🎯 Setup Trigger
→ Daily break and close above $113,250
→ 4H structure shift on retest of $113,250
📋 Trade Management
→ Stop Loss: Daily close below $110,000
→ Targets: TP1: $119,350 TP2: $126,300 (ATH)
→ Move SL to breakeven after TP1 is reached.
💬 If this analysis helps your trading, leave a comment or follow for more detailed model-based setups every week!
⚠️ Disclaimer: This content is for educational purposes only and does not constitute financial advice. Always conduct your own research before trading.