BTCUSDT: Pullback Toward Demand ZoneHi!
Bitcoin is showing short-term weakness after failing to hold above the recent high. Price is currently trading below the local resistance area, suggesting a corrective pullback rather than continuation.
The highlighted demand zone around 90.4K–90.9K is a key area to watch. This level previously acted as resistance and was later flipped into support.
Key Levels:
• Resistance: 93.1K–94.4K
• Demand / Support: 90.4K–90.9K
Downside Target:
• 90,500 (primary demand zone)
As long as price remains below resistance, a deeper retracement into demand is likely. Reaction at support will determine the next directional move.
BTC-D

BTC: The Premium Zone Trap (4H vs 1H)Bitcoin is at a decisive junction. We are trading in the Premium Zone ($93,700+) with a clear conflict between timeframes. The 4H screams exhaustion (RSI 70.7 + Low Volume), while the 1H structure remains stubbornly bullish, holding above the $92,102 demand zone. The structure is intact, but the conviction is missing.
1. THE TECHNICAL REALITY (4H + 1H)
📉 We are seeing a divergence between price action and momentum:
• The Trap (4H): Price is in the Premium sell zone. RSI is overbought (70.7) and volume is down 41% at these highs. This is classic "divergence" behavior, price grinding up while participation drops.
• The Floor (1H): Despite the macro exhaustion, the 1H timeframe has cooled off (RSI 42.9) and is respecting the Ascending Support Trendline ($92,306).
• The Magnet: We have a bearish OB supply overhead at $94,760, but a juicy unfilled FVG sitting below at $90,189. Price hates leaving these gaps open.
2. THE CONFLICT: MOMENTUM VS. STRUCTURE ⚖️
Bearish Case (The Exhaustion):
• Volume has collapsed 66% on the 1H timeframe.
• MACD is printing bearish divergence on the 4H.
• 14.1% wick rejection at the $94,760 local top suggests sellers are active.
Bullish Case (The Trend):
• CHoCH and BOS are both confirmed bullish.
• Price is holding above all major EMAs (20/50/200).
• Buyers are defending the $92,102 Order Block.
3. THE TRADE SETUP 🎯
We play the reaction, not the prediction. Here are the two probability paths:
🔴 Scenario A: The Premium Rejection (Higher Probability) If volume fails to return, gravity takes over.
• Trigger: Loss of the 1H support trendline ($92,300)
• Target 1: $90,189 (Filling the 4H FVG)
• Target 2: $86,760 (Major Swing Low)
• Invalidation: 4H Close above $94,760
🟢 Scenario B: The Demand Reclaim If the 1H structure holds, we squeeze the shorts.
• Trigger: Bounce from $92,102 (Bullish OB) with increasing volume
• Target: $94,760 (Range High) → $96,000 Extension
• Stop: Tight below $91,900
MY VERDICT Short-term structure is bullish, but the "fuel" (volume) is empty. I am leaning 68% bearish (expecting a sweep of the $90k FVG) unless we see a massive volume injection above $94k. Patience is the play, let the $92,100 level dictate the next move.
MARKET ROTATION WATCHLIST
📋 While Bitcoin consolidates in this premium zone, liquidity often rotates into specific altcoin setups that are lagging behind.
I am updating my watchlist today for coins that are showing cleaner structure than BTC.

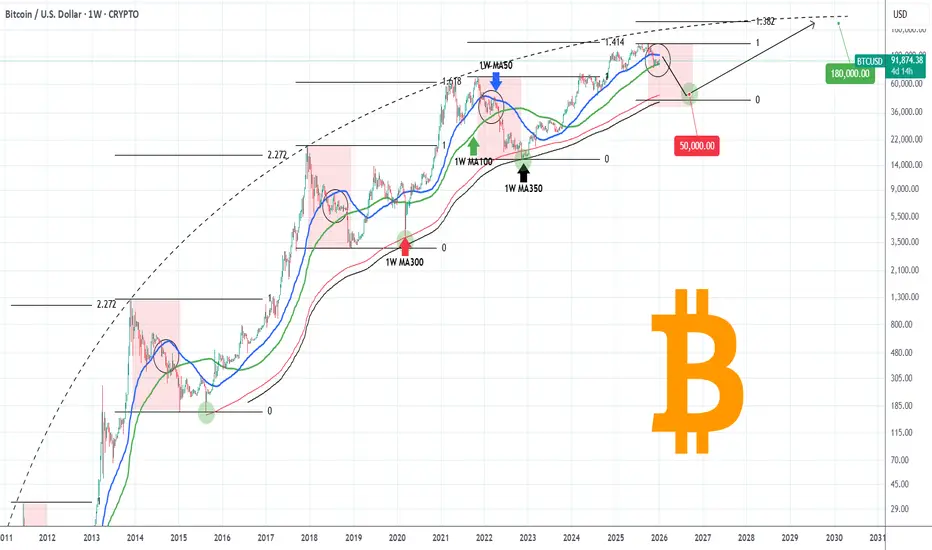
BITCOIN Can it reach $50000 during this Bear Cycle?Bitcoin (BTCUSD) has already started its new Bear Cycle since its October All Time High (ATH). We're past that, we've covered this extensively during the past 3 months. What's more important now is to cover the next stages, which is something we've started doing recently, in order to get a better understanding of the potential course of this Bear Cycle.
Right now BTC is consolidating within its 1W MA50 (blue trend-line) and 1W MA100 (green trend-line), which is a familiar pattern during all prior Bear Cycle, where after a 1W MA50 rejection, it starts Stage 2 of the Cycle.
The last Bear Cycle bottomed exactly on the 1W MA350 (black trend-line). The two before it, hit the 1W MA300 (red trend-line) before rebounding (and it was a secondary Low). As a result the 1W MA300-350 form a strong Support Zone and is the strongest candidate for the new bottom as well. Contact with the 1W MA350 (based on its current trajectory) should be made around $50000. A 45-50k potential Buy Zone would be more fair.
In any case, based on BTC's parabolic growth curve and the diminishing Fibonacci extension on each Bull Cycle Top, we expect the next ATH to be on its 1.382 Fib extension, i.e. around $180000.
Is that a trading plan you would follow if you were a long-term investor? Feel free to let us know in the comments section below!
---
** Please LIKE 👍, FOLLOW ✅, SHARE 🙌 and COMMENT ✍ if you enjoy this idea! Also share your ideas and charts in the comments section below! This is best way to keep it relevant, support us, keep the content here free and allow the idea to reach as many people as possible. **
---
💸💸💸💸💸💸
👇 👇 👇 👇 👇 👇
DOGEUSDT - Consolidation after growth is a positive signBINANCE:DOGEUSDT is testing resistance, but the coin is not going to reverse yet. Focus on the current consolidation at 0.145 - 0.1534. A long squeeze or a breakout of resistance could trigger growth.
Bitcoin has been growing throughout the week, forming a retest of resistance. If the growth continues, it could support a bullish run in altcoins.
After the rally, DOGE moved into consolidation at 0.145 - 0.1533. The market is showing positive dynamics. The altcoin may test the consolidation support before growing. However, a breakout of the 0.1533 resistance and a close above the level could trigger an early rise.
Resistance levels: 0.1534, 0.1648
Support levels: 0.145, 0.139
Regarding the current consolidation in the trading range format, I highlight two levels: 0.1534 and 0.145. If the overall positive background persists, a false breakdown of support at 0.145 or a breakout of resistance at 0.1534 with the price closing above the level could trigger further growth towards the local zone of interest at 0.165.
Best regards, R. Linda!

ETH/USDT | new ATH ahead in 6 Months! (READ THE CAPTION)Ethereum rallied to $3,300 and is currently attempting to hold above this level. If price stabilizes above $3,300 within the next 24 hours, the next short-term targets are $3,450 and $3,620. A clean break above $3,620 could accelerate momentum toward $3,850 and $4,000. The $2,100–$2,700 demand zone remains a strong institutional support, and as long as Ethereum stays above it, the medium-term outlook remains bullish with a high probability of reaching a new all-time high in the first half of the year.
Please support me with your likes and comments to motivate me to share more analysis with you and share your opinion about the possible trend of this chart with me !
Best Regards , Arman Shaban

BTC/USDT | More Bullish Move Ahead ? Let's See!By analyzing the CRYPTOCAP:BTC chart on the Daily timeframe, we can now confirm a powerful breakout above previous resistance. Bitcoin surged to $94,800 and is currently trading around $92,500.
If price manages to sustain above the key $90,000 level, the bullish scenario strengthens, and we may see an extension toward higher targets. The next key resistance zones to watch are $97,000, $99,000, $101,400, and $104,000.
The bias has shifted from bearish to bullish, but only if $90K holds as new support. Momentum remains in buyers’ hands as long as structure and volume confirm this shift.
Please support me with your likes and comments to motivate me to share more analysis with you and share your opinion about the possible trend of this chart with me !
Best Regards , Arman Shaban

Bitcoin Pumps With Gold & S&P — But Is a Pullback Coming First?Bitcoin ( BINANCE:BTCUSDT ) started the new week with bullish momentum, pumping alongside Gold( OANDA:XAUUSD ) and the SPX500 Index( SP:SPX ).
At the moment, Bitcoin is trading within a resistance zone($94,840-$93,020), close to the upper line of the ascending channel, while also moving around the Cumulative Short Liquidation Leverage($94,970-$94,300).
From an Elliott Wave perspective, it appears that Bitcoin is in the process of completing microwave 4 of the main wave C.
My expectation is a minimum pullback toward the Cumulative Long Liquidation Leverage($92,190-$91,610) and the nearby support zone($90,960-$90,090). From that support zone($90,960-$90,090), we can look for a potential renewed bullish move.
Note: If geopolitical tensions in the Middle East escalate, a sudden and sharp drop in Bitcoin is possible.
Note: If Bitcoin breaks and holds below the support zone($90,960-$90,090), we should be prepared for a deeper downside continuation.
Cumulative Long Liquidation Leverage: $87,140-$86,210
Cumulative Short Liquidation Leverage: $98,480-$96,970
CME Gap: $91,595-$90,530
CME Gap: $88,720-$88,120
First Target: $90,029
Second Target: $90,867
Stop Loss(SL): $96,223(Worst)
Points may shift as the market evolves
💡 Please respect each other's opinions and express agreement or disagreement politely.
📌Bitcoin Analysis (BTCUSDT), 1-hour time frame.
🛑 Always set a Stop Loss(SL) for every position you open.
✅ This is just my idea; I’d love to see your thoughts too!
🔥 If you find it helpful, please BOOST this post and share it with your friends.

Bitcoin - time to take 100k Bitcoin - time to take 100k
Price is at VAH with rising open interest
all other coins are pumping
That's why I think BTC cna take that zone
after we`ll se what's next - big drop or break above VWAP

Bitcoin closes 3 months red—relief rally now! Altcoins updateThe relief rally is on! Bitcoin closed three months red and this is now confirmed and this does two things: (1) A relief rally is now guaranteed but (2) also a bearish continuation long-term.
Let's see what we can expect on this relief rally.
Without a shadow of doubt; with 100% certainty, we get January 2026 green. That is an entire month of bullish action.
Based on past history, a relief rally lasts always two months minimum but it can be more. This means that February 2026 we also get green but there can be some variations, let's look at those.
February will be bullish but reaching the end of the month prices can start to drop. Think of this, Bitcoin goes high up and while the month closes green a decline is present on the daily timeframe before the month closes and then we get red in March. This is the standard relief rally.
The second variation goes like this: Bitcoin rises and produces a strong close in February, in March 2026 we get additional growth also until the first half and after the first half the market turns red and starts dropping.
The bearish trend is already confirmed by three months red. Bitcoin never closed three consecutive months red since the peak in 2021. This means that we have these two months to make the most out of Bitcoin but, what about the altcoins?
The altcoins will be mixed growing super strong. The altcoins vs bitcoin trading pairs will do awesome and many can even grow while Bitcoin goes down. The market is big and will continue to grow. There will be endless opportunities while Bitcoin cements its bottom.
The altcoins that we are reading as bullish can follow Bitcoin the first few weeks or an entire month when Bitcoin start to decline and then detach and move ahead. Many of these projects that we are seeing as bullish long-term can falter by producing strong volatility, big red candles followed by a strong reversal. There will be projects growing, many of them, while some of the big ones go down.
Just know: Just as the bull market can never be cancelled or nullified, it happens like clockwork, it is the same for the bearish wave. The good news is that a big portion of the bearish action is already in and we have plenty of time to adapt and prepare. In fact, we can even profit from the bearish cycle if we plan ahead of time.
Thank you.
Namaste.

Bitcoin is completing a bullish triangle (12H)Since we marked the red arrow on the chart the price has entered a bearish phase
This phase appears to be a complex correction likely a double structure as we can observe an ABC plus X wave followed by a triangle formation
We are currently at the end of the second corrective wave with only one wave Wave E of this triangle remaining Once Wave E completes within the green zone the price may enter a bullish phase
In this scenario the recovery will only begin after the completion of Wave E This means that all movements from the current low until now have been part of corrective action and the bearish phase Therefore we can anticipate Bitcoins recovery target to reach around 106000 dollars
It is expected that the price will find support moving from the red zone toward the green zone after which stronger bullish movements could follow
Targets have been clearly marked on the chart for reference
Important A daily candle close below the invalidation level will negate this analysis and suggest a different market scenario
If you have a coin or altcoin you want analyzed, first hit the like button and then comment its name so I can review it for you.
This is not a trade setup, as it has no precise stop-loss, stop, or target. I do not publish my trade setups here.

BTCUSD(bitcoin): Double Bottom Breakout ScenarioHi!
Bitcoin is forming a double bottom structure after a prolonged downtrend. The descending trendline has been broken, indicating a potential shift in market structure.
Price is currently approaching a key resistance zone around 99,000. A confirmed breakout above this level would validate the double bottom and open the door for further upside.
• Support: 93,000–94,000
• Resistance: 99,000
Targets (if resistance breaks):
• Target 1: 99,000 (retest/confirmation)
• Target 2: 103,500 (measured move of the double bottom)
As long as price holds above support, the bias remains bullish, with continuation dependent on a clean break above resistance.
Disclaimer: As part of ThinkMarkets’ Influencer Program, I am sponsored to share and publish their charts in my analysis.

Bitcoin CME Gaps (1H)Bitcoin currently has two unfilled CME gaps located in the lower price regions. Historically, CME gaps tend to act as strong magnets for price, as Bitcoin often revisits these areas to fill the gaps before resuming its primary trend. While this behavior is not guaranteed, it has occurred frequently enough to be considered an important factor in technical analysis.
At the moment, the first CME gap is positioned in the 91K–90K zone, which represents a relatively shallow pullback area and could be tested during a normal corrective move. If selling pressure increases or the market enters a deeper retracement phase, the second CME gap located around 88K may come into play as a stronger downside target.
These levels should be monitored closely, as price reactions around CME gaps can provide valuable insight into market strength, liquidity absorption, and potential trend continuation. A clean fill followed by strong bullish confirmation could indicate that the market is preparing for the next leg higher. Conversely, failure to reclaim these levels may suggest extended consolidation or deeper correction.
As always, CME gaps should be analyzed in confluence with other technical tools such as market structure, support and resistance zones, volume behavior, and momentum indicators. They are not standalone signals, but when combined with broader market context, they can significantly improve trade planning and risk management.
If you have a coin or altcoin you want analyzed, first hit the like button and then comment its name so I can review it for you.
This is not a trade setup, as it has no precise stop-loss, stop, or target. I do not publish my trade setups here.

ADA/USDT | $ADA Demand Zone Played Out Perfectly – 33% Surge!CRYPTOCAP:ADA dropped into the $0.32–$0.36 demand zone exactly as forecasted. Once it hit the zone, strong buying pressure kicked in, launching the price above $0.43 and delivering a sharp 33% rally. The main analysis remains valid. As long as price holds above $0.38–$0.40, new bullish targets are $0.46, $0.50, and potentially $0.54.
Please support me with your likes and comments to motivate me to share more analysis with you and share your opinion about the possible trend of this chart with me !
Best Regards , Arman Shaban

EURUSD Compressing Into a Triangle — Volatility ExpansionEURUSD on H1 is currently trading within a symmetrical triangle, reflecting a clear contraction phase after the prior bearish move. The market is no longer trending impulsively; instead, price is compressing between descending resistance and ascending support, signaling indecision and energy build-up.
Structurally, sellers remain in control below the descending trendline, while buyers are gradually stepping in at higher lows. Price is trading below the EMA 50, which continues to act as dynamic resistance and reinforces the corrective nature of the current price action rather than a confirmed trend reversal.
A key supply / reaction zone around 1.1700–1.1710 has already caused multiple rejections. This area is critical for short-term direction, as acceptance above it would signal a shift in momentum, while rejection keeps the compression bearish-neutral.
At the same time, the rising trendline support is holding, preventing immediate continuation to the downside. This confirms that the market is waiting for a break-and-confirm before committing to the next directional move.
Bullish scenario: A clean breakout above the descending trendline, followed by acceptance above 1.1710, would confirm bullish continuation toward 1.1750 and potentially 1.1780.
Bearish scenario: Failure to break resistance and a confirmed breakdown below the ascending support would expose downside targets toward 1.1680, with extension risk toward 1.1650.
Until a breakout occurs, entries inside the triangle carry elevated risk. Patience is key — the best opportunities will come after confirmation, not while price remains compressed within the structure.

BTC: Looking for one last leg down toward 78k?The General Outlook It looks like Bitcoin might be in the final stages of this corrective move. Before we see a real reversal, the market likely needs to complete the structure with one more push lower.
There are two main ways this could play out. We might see a direct, sharp drop where support levels break relatively quickly. Alternatively, it could turn into a "diagonal" style move—this would be choppier and slower, with lots of overlapping bounces, but the destination would likely be the same.
The Key Level The bears seem to be in control as long as the price stays below the recent high of $94,800. If we get a sustained break above that level, this immediate bearish setup is probably invalid.
First Target: Watch for a reaction around $85,500.
Second Target: A sweep of the lows near $80,300.
Final Target: The move could potentially finish somewhere in the $76,000 – $78,000 zone.
Just my thoughts on the chart

ETHEREUM - Consolidation near 3150 ahead of rallyBINANCE:ETHUSDT.P is rising after breaking through trend resistance and consolidating. The main trend remains bearish, but there are local indications of bullish support. The 3150 trigger is ahead.
Bitcoin is strengthening amid geopolitical nuances, acting as a hedging factor (locally). A rise in the leading cryptocurrency could support Ethereum, which, in turn, could trigger a breakout of 3150 and a subsequent rally.
Ethereum is consolidating near 3150, forming resistance (a trigger). Technically, consolidation continues, and the coin may test local lows at 3120-3100 before retesting 3150 and continuing the rally.
Resistance levels: 3150, 3200, 3270
Support levels: 3120, 3100, 3077
If the pullback is not deep and the price quickly returns to retest 3150, then we can continue to monitor the coin, waiting for a signal to long...
If the bulls hold the price above resistance after breaking through 3150, this move could trigger continued growth toward 3200-3270.
Sincerely, R. Linda!

BTC Best Case Scenario. 137.4k/146k is next Target May 2026 Here alot of noice for BTC
I would be carefull after 19 jan potential bulltrap (110-112k). Down close to 80k begin feb.
Im ultra bullisch for April/May.
nothing will happen in feb/march no new ath till mid/end april.
but recovery will start after 2 feb in a vshape. Top will be last week of may. 137.4k-146k.
When altseason?. From bottom to top begun feb till first days of june.
Some alts will top with btc end may some will top 8-14 june. (After btc cooldown).
Lets see how this play out.
its crypto you never know, if this happens will be a blessing for us let see.

BTC on US open and US ISM ServicesWatching US Open and the US #ISM services data closely...
Expecting that New York fakedumps towards ~$91k, and 30 minutes later US ISM services slightly miss (lower then expected) and pumps up the market...
Patience is key...
#Trading #Bitcoin #CryptoMarket #StockMarket

#EURJPY , Gonna be Nice with us ?📊 Morning Market Brief | London Session Prep
🔎 Instrument Focus: #EURJPY
⚠️ Risk Environment: High
📈 Technical Overview:
By having a Momentum Structure , it could be a nice QuickScalp Setup
🚀 Trading Plan:
• Wait for Momentum around key levels
• LTF ENTRY NEEDED
• Manage risk aggressively, protect capital first
🧠 Stay updated with real time news and macro events, visit 👉 @News_Ash_TheTrader_Bot
#Ash_TheTrader #Forex #EURUSD #MarketInsight #PriceAction #TradingPlan #RiskManagement #LondonSession #Scalping #Futures #NQ #Gold

TradeCityPro | Bitcoin Daily Analysis #257👋 Welcome to TradeCityPro!
Let’s move on to Bitcoin analysis. The strong bullish trend of Bitcoin is still continuing.
⏳ 1-hour timeframe
Bitcoin is still continuing its bullish trend, and yesterday, after breaking 93,149, it continued its move up to 94,478.
🔔 At the moment, after a pullback to the 93,149 area, Bitcoin is once again moving toward 94,478.
📊 Buy volume has not increased significantly yet, and in my opinion, if the price is going to break 94,478, buy volume also needs to increase.
🧮 For now, we can consider the break of 94,478 as a trigger for opening a long position. In my opinion, as long as the price stays above 93,149, this trigger is a very good one for long positions.
⛏ However, if the price consolidates below 93,149, we will get confirmation of the end of the bullish wave, and in that case, Bitcoin can correct down to lower areas such as 91,585 and 91,118.
💥 For a trend change, after the price consolidates below 93,149, we can get confirmation of a bearish trend in Bitcoin by forming lower highs and lower lows based on Dow Theory.
❌ Disclaimer ❌
Trading futures is highly risky and dangerous. If you're not an expert, these triggers may not be suitable for you. You should first learn risk and capital management. You can also use the educational content from this channel.
Finally, these triggers reflect my personal opinions on price action, and the market may move completely against this analysis. So, do your own research before opening any position.

#USDJPY , Would you give us a QuickScalp ?📊 Morning Market Brief | London Session Prep
🔎 Instrument Focus: #USDJPY
⚠️ Risk Environment: High
📈 Technical Overview:
We could have a trade on xJPYs by these kinda structure . on EJ nor UJ . both are in watchlist .
🚀 Trading Plan:
• Wait for Momentum around key levels
• LTF ENTRY NEEDED
• Manage risk aggressively, protect capital first
🧠 Stay updated with real time news and macro events, visit 👉 @News_Ash_TheTrader_Bot
#Ash_TheTrader #Forex #EURUSD #MarketInsight #PriceAction #TradingPlan #RiskManagement #LondonSession #Scalping #Futures #NQ #Gold

#BTC/USDT - Where the 2026 Bottom Might Actually Form ( Short) #BTC
The price is moving in a descending channel on the 1-hour timeframe. It has reached the upper limit and is heading towards breaking it. A retest of the upper limit is expected.
We have an upward trend on the RSI indicator, which has reached near the upper limit. A downward reversal is expected.
There is a key support zone in green at 944650. The price has bounced from this zone multiple times and is expected to bounce again.
We have a trend of consolidation above the 100-period moving average, as we are moving close to it. This supports a downward move towards touching this level.
Entry price: 93500
First target: 93006
Second target: 92509
Third target: 91866
Stop loss: Above the support zone in green.
Don't forget a simple thing: capital management.
For inquiries, please leave a comment.
Thank you.

Bitcoin BTC Update: Waiting for Trend Confirmation | Key Levels I’m currently watching Bitcoin (BTC) closely — and right now, it’s sitting in no man’s land. We’ve had a bullish break, but a full trend reversal isn’t confirmed yet. For that, we need to see BTC break the most recent highs and retest the level successfully, holding above it to confirm a proper bullish shift.
At the moment, BTC is trading between a major institutional support zone and strong resistance. How it reacts at these key levels will determine the next move.
Here’s my plan:
Buy Opportunity: If BTC breaks above the recent highs and holds, I’ll be looking for a long entry.
Sell Opportunity: If BTC breaks below support, I may look for a short position.
There’s no confirmed trend yet, so patience is key. I focus on institutional levels, market structure, and price action to identify trade opportunities.
⚠️ Risk Management Reminder: Always protect your capital, scale out partial profits where possible, and adjust your stop loss to minimize risk.
❗ Not financial advice: This content is for educational purposes only and reflects my personal market analysis.
