BTCUSDT 4-Hour Chart Analysis. BTCUSDT 4-Hour Chart Analysis.
Current Pattern: BTC is in a falling wedge, with price making lower highs and lower lows, yet approaching the wedge’s support alongside the green demand zone ($102,000–$104,000).
Downside risk remains until the green zone ($104,000 area) is tested; strong support is expected there.
Resistance is at the upper falling trendline; a confirmed breakout above this would be bullish, with an upside target near $114,000–$123,000.
The chart projection suggests some more downside or sideways action, then a strong reversal if the green support holds.
If BTC loses the green zone, expect further weakness, but if price rebounds, a significant rally could follow.
DYOR | NFA
BTC-D

$BTC BEARISH CROSS on the 20 / 200 DMA We had a similar setup at the end of September of 2021 where CRYPTOCAP:BTC then rallied a week later ~75% over the next few weeks.
However, every other time this bearish cross occurred in the past, ₿itcoin has spent at least a couple months trying to reclaim the 200DMA.
Currently PA has closed the Day below the 200DMA.
Bulls CANNOT afford a Weekly close below $106k, which is well outside the DANGER ZONE and .382 Fib
GOOD NEWS: An Inverse Head & Shoulders pattern has formed.
Bulls need some big volume days to come reverse the localized downtrend ASAP.
If not, the 50WMA will be tested ~$103k.
If that happens, Bulls must not show any weakness nor allow Weekly Closes below it.

Example of a Trading Style
Hello?
Hello, fellow traders.
Follow me to get the latest information quickly.
Have a great day.
-------------------------------------
While it's ideal to always close a trade in profit, this isn't always the case.
Therefore, you should maintain your trade by locking in profits through fractional trading.
Based on the trading information provided by the exchange, once a trade has turned into a loss, it's likely to take a considerable amount of time to turn into a profit again.
Therefore, you should trade at different buy and sell prices.
However, this is a rather tedious process, so it's not usually done that way.
-
If you were to buy near the area shown on the chart, the estimated average purchase price would be significantly higher than the current price.
Therefore, you wouldn't be able to proceed with the trade.
Therefore, we must trade by purchase price.
The purchase prices for positions 1 and 2 are quite high, so we don't pay attention to them.
Since the current price is near the purchase price for position 3, if it turns into a profit, you can sell the amount you purchased near position 3 to lock in the profit.
By subtracting this profit from the purchase price for positions 1 and 2, you can minimize your losses.
This trading method is possible because the coin market allows trading in decimals.
The key here is to trade by purchase price.
You should not trade in units of the number of coins you purchased.
For example, if you purchased $100 at point 3 (106431.68), you should sell $100 when the price rises.
Trading this way will allow you to quickly recover from losses and even generate profits even during losses.
-
You can profit whenever volatility occurs, regardless of whether the asset (coin or token) you're trading is in a loss or a profit.
You should avoid increasing the number of assets (coins or tokens) you're trading without managing them.
------------------------------------------------
To do this,
1. Mark support and resistance points on the 1M, 1W, and 1D charts.
2. Develop a basic trading strategy using these support and resistance points.
3. Avoid greed and execute split trades according to your trading strategy.
-
Thank you for reading to the end. I wish you successful trading.
--------------------------------------------------

Volatility Period: Up to November 10th
Hello, traders!
Follow us to get the latest information quickly.
Have a great day!
-------------------------------------
(BTCUSDT 1D chart)
This volatility period is expected to last from November 3rd to 9th.
First, we need to check the movement between November 3rd and 5th.
While the key question is whether the price can rise after finding support at the important support and resistance level of 104463.99-108353.0, it's crucial to check for support around 106431.68 within that range.
This is because the 106431.68 point is the DOM(-60) level.
-
The DOM indicator is a comprehensive evaluation of the DMI, OBV, and MOMENTUM indicators.
DOM(-60) indicates that all three indicators have reached their lows.
Therefore, support is necessary to confirm the possibility of a bullish reversal.
If the price rises after the DOM(-60) indicator first appears and then touches the DOM(-60) indicator again, it is highly likely that the price will fall without finding support.
If the price rises after finding support at the DOM(-60) indicator, it should follow a period of sideways movement to confirm support.
-
Therefore, what we can do now is take the time to determine which direction the price deviates from the 106431.68-108353.0 range and where it encounters support and resistance.
You need your own basic trading strategy to execute your trades.
No one else can do this for you.
This is because you need to tailor your trading strategy to your investment style to avoid regrets.
My basic trading strategy is to buy in the DOM(-60) ~ HA-Low range and sell in the HA-High ~ DOM(60) range.
However, if the price rises in the HA-High ~ DOM(60) range, a step-up trend is likely, while if the price falls in the DOM(-60) ~ HA-Low range, a step-down trend is likely.
Therefore, a split trading strategy is required.
-
The formation of the DOM(-60) indicator indicates a buying opportunity. However, as previously mentioned, this is the second time the indicator has fallen below the DOM(-60) level since its formation, increasing the likelihood of further declines.
If the price falls below 104463.99 and continues to decline, it is expected to meet the M-Signal indicator on the 1M chart and re-establish the trend.
At this point, the key area to consider is support, particularly around the left Fibonacci level of 2.618 (87814.27) to the left Fibonacci level of 3.14 (93570.28).
If the price declines and a new HA-Low indicator is formed, support around that level is crucial.
-
You can profit by trading whether the price is in an uptrend or a downtrend.
However, the trading period may vary depending on the trend.
Therefore, you should check the flow of funds and determine whether trading is possible based on the support and resistance levels currently established.
To continue the uptrend by breaking above a key point or range,
1. The StochRSI indicator must be trending upward. If possible, it should not have entered an overbought zone.
2. The TC (Trend Check) indicator must be trending upward. If possible, it should remain above the zero level.
3. The On-By-Sign-Operative (OBV) indicator must be trending upward. If possible, it should remain above the High Line.
When all three indicators above are met, an uptrend is highly likely.
Currently, the On-By-Sign-Operative (OBV) indicator is located near the Low Line, following the EMA 3 > EMA 2 > EMA 1 > OBV.
Therefore, we can see that selling pressure is dominant.
However, since it's located near the HA-Low indicator, you should pay close attention to the situation.
If it finds support in the DOM(-60) ~ HA-Low range according to the basic trading strategy, it's a good time to buy.
-
Thank you for reading to the end.
I wish you successful trading.
--------------------------------------------------
- Here's an explanation of the big picture.
(3-year bull market, 1-year bear market pattern)
I'll explain more in detail when the bear market begins.
------------------------------------------------------

Bitcoin BTC Bears Regain Control: Watching for a Short Setup 📊 Bitcoin Analysis (BTCUSD)
Currently, Bitcoin is showing clear bearish intent on the higher timeframes 🧭. After an extended period of range-bound price action, we’ve now seen a decisive displacement to the downside 💥 — a strong signal that sellers are taking control.
From here, I’ll be watching for a retracement back into equilibrium ⚖️ — the 50% level of the most recent swing — and will then look for signs of rotation and a break of structure 🧩 on the 30-minute chart to confirm a potential short setup 📉.
Patience is key here 🕰️ — I want to see price react efficiently to that retracement before considering entries.
⚠️ Disclaimer: This is not financial advice. Always conduct your own analysis before taking any trade.

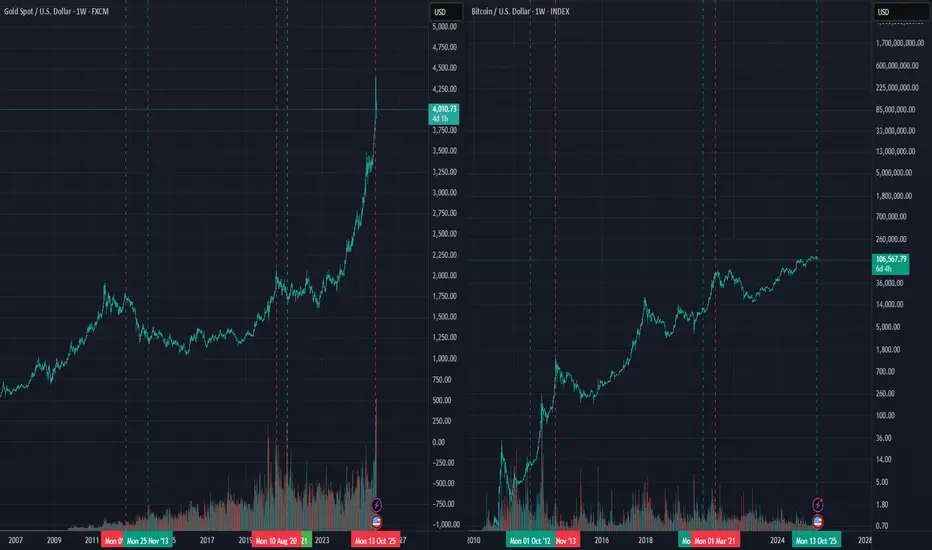
The correlation between gold and Bitcoin
I've observed an inverse correlation between gold and Bitcoin, as detailed below:
October 1, 2012: Gold was overbought, leading to a notable increase in Bitcoin.
November 25, 2013: Bitcoin hit its peak while gold fell to a low point.
August 10, 2020: Gold reached a peak, which was followed by a substantial rise in Bitcoin.
March 1, 2021: Bitcoin peaked while gold hit a trough.
October 13, 2025: Gold reached a peak (according to my analysis, it appears gold is overbought and has met its targets).
Historical data shows that gold has consistently formed peaks around these times, coinciding with Bitcoin's surges.
Consequently, I believe this remains an optimal accumulation period, with the indicators aligning favorably.
BTC 5D-W TABTC 5D-W. From the perspective of the Ichimoku cloud, everything is looking great, support on weekly is 75K and 90-95K on 5D chart. On macro chart is drawing classic bullish flag, similar we had in the beginning of the year, descending wedge and bounce from the Base of Ichimoku line. When Base line of ichimoku goes flat - expect the price to retorn to it about the time, when it hits the cloud. Two fibbs stretches, from candles and wicks to designate GP area - 92-96K , Just under the Ichimoku base line, and still above the cloud. 102-103K is the area of confluence: S/R of ranges, VAH of prev range and VAL of current range. Im more positive, that price will hit 100K psychological number and will be broken, just because there is a huge low leverage liquidity amd market makers dont care about the chart anymore, All liquidity is at 92K zone. Where 92K is still keeping bullish structure on higher frames, is inside ichimoku cloud on 5D and above weekly, in confluence with GP of the yearly move. So 90-92 would be perfect spooky move to reset sentiments and funding rates.

Why is crypto dumping? Bitcoin, Ether, and other cryptocurrencies extended their losses on Monday, even as stocks traded mostly higher.
Bitcoin hovers near $106,980, down about 3% in 24 hours, while Ethereum fell roughly 7% to around $3,642. Most major altcoins mirrored the decline (but more pronounced), reflecting a broader pullback in market sentiment.
Investors may have turned cautious after U.S. Treasury Secretary Scott Bessent suggested that the Federal Reserve’s interest rate policy may have already pushed parts of the economy (particularly housing) into recession.

TradeCityPro | Bitcoin Daily Analysis #209👋 Welcome to TradeCity Pro!
Let's dive into the Bitcoin analysis. The market momentum is bearish, so it's better we make a proper price analysis together.
⏳ 1-Hour Timeframe
Yesterday, Bitcoin made a downward move and was rejected from the peak it created at the 111,365 zone.
📈 The long trigger we had at 111,365 didn’t get activated, and now the price has started its downward movement after breaking the 108,844 level.
🔔 The support level that the price has reacted to is 105,780. The price has hit this level with a very large volume and is reacting to it.
💥 If this level breaks, a huge sell volume will enter the market, and a new downward wave could start.
✨ We will confirm the start of this new wave with a break below the 104,488 level. We can also use the 105,780 and 104,488 triggers as entry points for positions.
✔️ As for a long position, I am currently waiting for this bearish momentum to dissipate before looking for a long trigger.
❌ Disclaimer ❌
Trading futures is highly risky and dangerous. If you're not an expert, these triggers may not be suitable for you. You should first learn risk and capital management. You can also use the educational content from this channel.
Finally, these triggers reflect my personal opinions on price action, and the market may move completely against this analysis. So, do your own research before opening any position.

BITCOIN SIGNAL: BIGGEST MOVE YET TO COME!!!? (scary)Yello Paradisers, enjoy the video!
And Paradisers! Keep in mind to trade only with a proper professional trading strategy. Wait for confirmations. Play with tactics. This is the only way you can be long-term profitable.
Remember, don’t trade without confirmations. Wait for them before creating a trade. Be disciplined, patient, and emotionally controlled. Only trade the highest probability setups with the greatest risk to reward ratio. This will ensure that you become a long-term profitable professional trader.
Don't be a gambler. Don't try to get rich quick. Make sure that your trading is professionally based on proper strategies and trade tactics.

$BTC capitulation low?BTC looks like it's bottomed here. Everyone is looking for $98-100k, but I don't think we get it yet.
I think it's likely that we bounce towards the upper resistances from here, potentially even seeing a new high up at $126k, or revisiting the $122k region.
Let's see how it plays out from here.

BITCOIN – LONG - 105K SWEEP BEFORE WE LEAPTraders,
In my latest analysis I said that Bitcoin will reach 117.000-117.500 before a bigger dump. Price didn't reach those levels yet, and dumped instantly instead.
However, the main thesis still stands: price is likely to reach that zone (117.000-117.500) before a larger reversal down. But before that, I expect a short squeeze beginning at $105.000.
Why I Expect a Squeeze
During the Asia session, new leveraged short exposure was built. Open Interest (OI) increased while Net Shorts rose, showing that traders were adding fresh short positions.
Around 107,000–107,500, both Spot CVD and Coin-Margined CVD are showing bullish divergence. Sellers are active, but price is holding, which indicates absorption.
Stablecoin-Margined CVD in the same range shows exhaustion, suggesting selling pressure is fading.
At New York open, OI continued to rise together with Net Longs, meaning aggressive longs are now fading into the short exposure created during Asia.
What This Means
Historically, the London and New York sessions tend to sweep Asia’s positioning. When Asia builds short exposure, the later sessions often push price higher to liquidate those shorts. This often results in a short squeeze, which aligns with what we may be seeing now.
Determining the Next Move Down
Before deciding if price extends lower first, we must identify the variables of probability (VOP) — the “magnets” that increase the likelihood of a lower sweep.
1. Weak Thursday Low
There is a weak low that has not been properly tested. In TPO (Time Price Opportunity) terms, a weak low forms when price finds temporary support without strong buying response. Such levels often get revisited.
2. Unswept Sunday 19 Oct Low
There is also an unswept Sunday low from 19 October. Sunday lows are often swept because weekend liquidity is thin and order books are shallow. When liquidity returns during the week, those inefficient areas tend to get filled.
Imbalances and Volume Gaps Below
Next we look for gaps, imbalances, or LVNs (Low Volume Nodes) — areas where trading activity was limited or one-sided. These zones often attract price because markets seek balance.
Many traders identify “fair value gaps” by looking at candles, but that only shows part of the picture. To locate the real inefficiency, we need to look inside the candles using order flow or a Fixed Range Volume Profile (FRVP) to find the exact levels of bid-ask imbalance.
Volume Profile and Fibonacci Confluence
Drawing the Fixed Range Volume Profile from the impulse move below the Sunday 19 Oct low shows a clear imbalance at 105,070.
Checking confluences:
The 0.786 Fibonacci retracement (low to high) aligns exactly with 105,070
The 0.886 retracement (higher low to high) also aligns exactly with 105,070
Fibonacci extensions (1.113 and 1.272) both target around 105,000
The 0.618 extension also lands near 105,000
Thesis Summary
Based on all data and confluence:
Price likely dips to sweep the weak 30 Oct low and the 19 Oct Sunday low
Target zone: LVN / imbalance near 105,000
Expect a liquidity grab that traps late shorts and shakes out weak longs
After that, expect a reversal toward 117,000–117,500, where the next major liquidity pool lies
Why a Lower Sweep Is Expected
The Asia session built significant short exposure
There is an inefficiency and low-volume magnet around 105k
Weak lows provide clear liquidity targets
Once those areas are cleared, market structure favors a strong reversal upward
In summary:
Bitcoin is likely to make one more sweep toward the 105,000 zone to clear liquidity before expanding upward into the 117,000–117,500 area, where a larger reversal setup is likely to form. Of course, price can always move up or down without perfectly respecting these levels — the market does not owe us precision. These levels simply represent the highest-probability areas based on current data and confluence.

$IREN – First 20 SMA Retest + Flag Breakout SetupIris Energy ( NASDAQ:IREN ) is setting up a powerful flag breakout after its first real pullback of this entire move — and it’s happening right as crypto momentum heats up again.
🔹 The Setup:
After a strong rally from $50 → $75, NASDAQ:IREN pulled back in a controlled, low-volume correction.
Price undercut the 20 SMA, quickly reclaimed it, and now sits back above the 9 EMA — a perfect base reset.
Tight flag pattern forming, primed for expansion once momentum kicks in.
🔹 Crypto Sector Strength:
CRYPTOCAP:BTC and CRYPTOCAP:ETH both popped this weekend — that’s classic risk-on behavior.
The entire crypto stock basket is running hot, with leaders like NASDAQ:CIFR and NASDAQ:IREN showing clean technical setups.
This is the first 20 SMA test of the move — historically the most powerful retest in trending names, as late buyers finally get their chance to enter.
🔹 My Trade Plan:
1️⃣ Entry Zone: Watching dips Monday or Tuesday to build a position near the 9 EMA / 20 SMA zone.
2️⃣ If It Gaps Up: I’ll skip swing entries and just day trade the strength — no chasing.
3️⃣ Stop: Below the 20 SMA — tight, logical risk level.
Why I Like This Setup:
First 20 SMA test after a big run = high probability continuation.
Crypto momentum is back — strong sector correlation.
Technical structure is perfect: shallow pullback, rising EMAs, and a clear trigger.

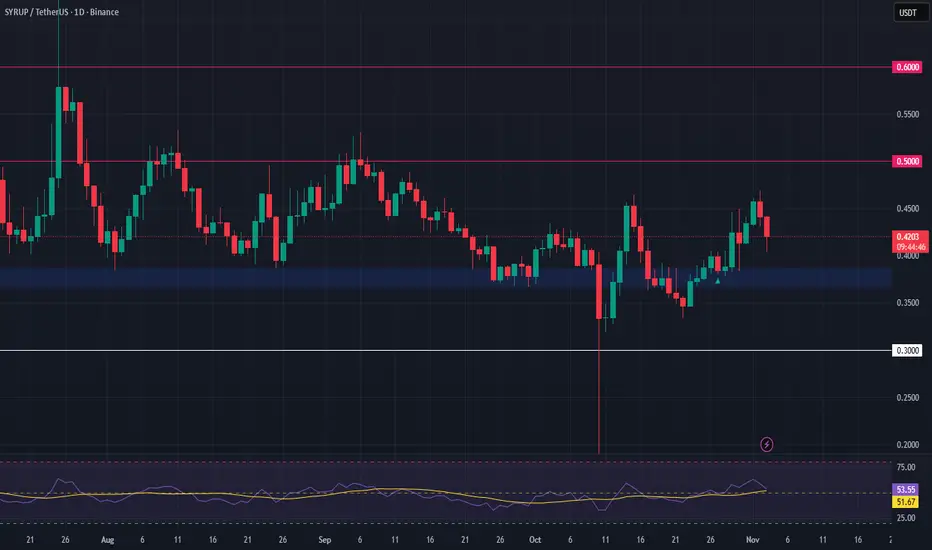
SYRUPUSDT – Watching for Pullback OpportunityAfter a strong 24% surge since our last analysis, SYRUP is starting to show signs of a potential retracement. This could be a healthy move, offering a chance to reset before a possible continuation higher on the higher time frames.
We’re now closely monitoring the $0.37 support zone, a level that aligns with previous consolidation and demand. If price pulls back and holds this zone, we may see a bullish reversal setup forming—a potential entry point for a spot long trade. Confirmation from candlestick structure or volume would strengthen the case.
📈 Trade Plan:
Entry Zone: $0.37
Take Profit Targets: $0.50, $0.60
Stop Loss: $0.30
Each time, they said, "Maybe it's over."It's not over this time either, but maybe CRYPTOCAP:BTC is starting again...
Each time, they said, "Maybe it's over."
But each time, Bitcoin found strength in the same demand zone, and the momentum supported this
This time, the place where everyone said "it's over" could be the beginning of a new peak.

BTCUSDT.P - November 3, 2025BTCUSDT.P is forming a potential lower-high structure within a broader corrective phase, suggesting renewed bearish momentum. The setup plans a sell short limit order at $116,380, targeting a move down toward the profit level at $100,904, with a stop level positioned at $131,811 for risk management. The structure favors a downside continuation as long as price remains below the $116,380 resistance zone. A break above the stop region would invalidate the bearish bias and shift momentum back to buyers.
Risk Assessment: Medium risk — while the market structure supports a bearish setup, the wide range and volatility around the $110,000–$120,000 zone introduce potential fluctuations before confirmation.

03/11/25 Weekly OutlookLast weeks high: $116,415.75
Last weeks low: $106,320.38
Midpoint: $111,368.06
This week will be the third week in a row where ~$116,000 is acting as weekly high and a major resistance level. Last weeks price action was clear, the bulls are incapable of flipping that level and making it new support. As a result the bulls retreated back towards strong support at weekly low ~106,000 completing the SFP. Also this pattern is a mirror image of the previous weekly outlooks price action. No clear trend bias at all here but what is obvious is bull market momentum is dying out.
Bitcoin has always been hyper sensitive to liquidity, as always month end window dressing by the banks have a negative effect on liquidity, it usually takes a few days to get over this and resume normal levels again. The Government shutdown in the US does not help this as spending from the Treasury General Account has stopped with approximately $150Bn coming out of the market in October alone as a result.
Should Bitcoin push higher it can only do so once Government operations resume IMO. FOMC resulted in a 25bps cut and QT (Quantitative tightening) is ending on 1st December, all bullish signs for the future but currently and for this week I think chop/ gradual drawdown continues.
Good luck this week everybody!

BITCOIN 's worst Uptober in 11 years. Will selling continue?Bitcoin (BTCUSD) just closed October on a -3.89% loss, marking only the second red October since 2018 (-3.83%) and the worst since 2014 (-12.95%). This comes against the popularized 'Uptober' moniker, which relates to BTC's historically strong gains for this month.
So what's next? Things may get even worse if BTC repeats the Jan - Feb 2025 fractal and breaks below its current Higher Lows trend-line. As you can see, since the August 14 2025 High, the market has been on a similar pattern as December 2024 - February 2025.
Right now we are on the rejection made on the Lower Highs 2 trend-line (blue circle) on the 1D MA50 (blue trend-line) and on the 0.5 Fibonacci retracement level. With the first Lower Highs 2 rejection being similar among the two fractals (around -17%), we can expect an equally symmetrical sell-off if the Higher Lows break.
On February 24 2025, that break-out completed a -32% fall from its All Time High (ATH) just below the 2.0 Fibonacci extension. If the Higher Lows break-out does happen on the current sequence as well, we may see another -32% decline, which this time is exactly on the 2.0 Fib ext. This time we have the 1W MA100 (red trend-line) to be mindful of, where we can expect contact to be made around $87000.
Do you think BTC can dip this low? Feel free to let us know in the comments section below!
-------------------------------------------------------------------------------
** Please LIKE 👍, FOLLOW ✅, SHARE 🙌 and COMMENT ✍ if you enjoy this idea! Also share your ideas and charts in the comments section below! This is best way to keep it relevant, support us, keep the content here free and allow the idea to reach as many people as possible. **
-------------------------------------------------------------------------------
💸💸💸💸💸💸
👇 👇 👇 👇 👇 👇

BTCUSDT: Buyers Aim for Recovery Toward $115K ResistanceHello everyone, here is my breakdown of the current Bitcoin setup.
Market Analysis
Bitcoin (BTCUSDT) is showing a constructive bullish setup after rebounding from the 106,600–107,000 Support Zone. This area has consistently acted as a strong demand region, confirming buyers’ interest each time price tested the lower boundary of the Upward Channel. The market structure has remained bullish overall, characterized by a series of higher highs and higher lows since the correction phase in mid-October.After a recent fake breakout below the support line, buyers quickly regained control, pushing price back above the channel’s lower boundary. This rejection from support and recovery above 110,000 suggests renewed bullish momentum.
Currently, BTCUSDT is approaching the midline of the channel, while short-term resistance lies at 115,400 — a level that coincides with a previous fake breakout zone and horizontal supply area.
My Scenario & Strategy
As long as BTCUSDT holds above the 109,000–110,000 region, the bullish scenario remains valid. I expect the price to continue climbing toward the 113,000–115,400 Resistance Zone in the near term. A clean breakout above 115,400 could open the way for another bullish leg toward the upper boundary of the channel near 117,000–118,000.
However, a confirmed rejection from 115,400 could trigger a temporary pullback toward the support trendline before another potential push higher. In my view, Bitcoin remains in a healthy uptrend, and I prefer to look for long opportunities from dips above the support line, targeting 115,400 (TP1) and potentially 117,000 (TP2).
That's the setup I'm tracking. Thank you for your attention, and always manage your risk.

BTC Outlook after the Dip. What to expect NOW?The price is expected to drop to $102,000, followed by a bottoming phase and a renewed upward movement.

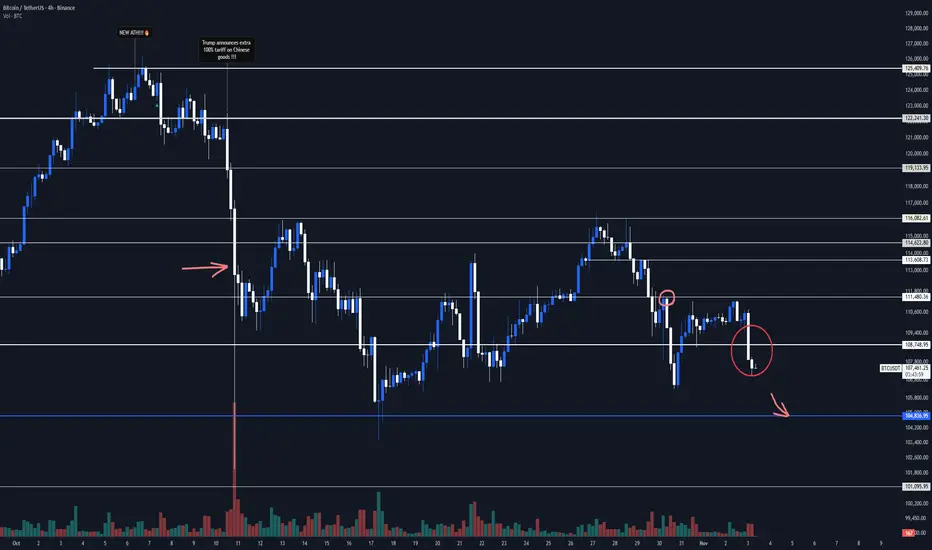
Bitcoin Daily Analysis — Why $BTC Might Rebound Soon (Nov 3)A few weeks ago, if you said you wanted to open a short position on Bitcoin, everyone would probably give you a weird look ~_~ . But after President Trump announced the 100% tariff increase, and Bitcoin alone dropped over 15%, opening shorts these days doesn't seem so strange anymore.
Buyers were hoping for interest rate cuts, but even after a sharp drop, it looks like buyers still aren't interested in jumping in, and the bearish momentum is gaining strength. Let's start with an overall view from the weekly timeframe.
Bitcoin has held its HWC uptrend for about 1,000 days now, and if you look closely, it has never really penetrated its floors, while strongly respecting this curve line—until now, when it seems to be breaking it downward.
What does this show us? There's a high probability of a short-term price correction, and if we then break the lower highs and lows, our HWC uptrend would officially change, potentially leading to a drop as low as 45k . But I see the first scenario as more likely: just a daily correction, and then we'll be back in uptrend for the next couple of months, since the interest rate news is still pending, and that's expected to cause another drop. Plus, we haven't had an altseason yet—we've seen Bitcoin's growth, and it seems like it's over (I hope I'm wrong), but altseason hasn't happened, and BTC.D is still in uptrend, sitting above 60%.
We're at a very critical point in the market, so pay close attention to these three dominance and index metrics:
And finally, pair BTC with the specific altcoin you want to buy. For example, if you're checking Ethereum, you need to look at ETH/BTC too. If it's in uptrend, that's good; if not, be sure there's a better pair where more liquidity is flowing in. This is under the condition that the market has uptrend momentum. In the current conditions, I don't recommend buying altcoins at all.
Back to Bitcoin. Today, my short trigger activated after breaking 108,748.95, but I missed it because I was asleep:) We have a lot of liquidity in the 104k to 105k area, so it's best not to miss that. If we miss it, we'll go for the first scenario I mentioned—a correction on the daily timeframe. The next support levels would be 101k, 98k, and 91k. But if we get good support at 105k, personally, I'd look for a long trigger, even with very low risk, and I'd still follow it. Probably, we'll fake out around 105k and then form resistance—definitely open a long after the break.
Another possibility is that we fake out this 108,750 support break and head back up, in which case we'd trigger with a break of resistance at 111,480.36 . I suggest you open it too, even with low risk—maybe risk 0.25% of your capital, but it's better to open because Bitcoin's uptrend rallies are usually very aggressive, and they don't give you much room for stop losses, so you get low R/R if you don't join with the first leg. So, it's better to have a position at the start of the uptrend, even with the lowest possible risk.
For shorts, there's no new trigger right now—let's wait for the market to give us a better structure.
Let's also check BTC.D:
it's in uptrend momentum, meaning as Bitcoin drops, liquidity is exiting altcoins, so altcoins are experiencing even bigger drops relative to Bitcoin. If you're looking for short triggers, altcoins are a much better option.
For longs, we need to wait and see if, with Bitcoin's rise, BTC.D also rises or not. If yes, open on Bitcoin alone; if not, split your risk between Bitcoin and an altcoin that has an uptrending BTC pair. If you think any part of what I said is unclear, raise it in the comments, and I'll explain.
Let's also take a look at Ethereum
its situation is similar to Bitcoin, with the difference that since its BTC pair(ETHBTC) is declining, it's dropped more than Bitcoin. It already passed its short trigger, but if you're really keen, if we rest a bit here for New York time, you can open a short with a break of support at 3,685.05 , but with low risk because there's a ton of buy orders below this support, and it's not certain we'll pass it easily. An increase in volume at the break could help keep you safer from fake breaks.
For longs, Bitcoin is better right now, but if the second BTC.D scenario happens—Bitcoin rises, BTC.D drops, and ETH/BTC starts printing green candles—you can split your risk between BTC and ETH. It's best to have a BTC position anyway, since it's much safer.
And again, I say we're in a crucial geographic spot in the crypto market—stay vigilant and take capital management seriously. I'm sure many got liquidated after Bitcoin's 15% drop and got wiped out of the market because they didn't manage capital and risk. I say this because the day after the drop, I lost 15 followers too :) lol :).
Alright, get outta here.
BTCUSD Rebound Setup: Buyers Target 114K Resistance ZoneHello traders, I want to share with you my opinion about Bitcoin (BTCUSD). Bitcoin continues to move within a well-defined descending channel, forming a consistent pattern of lower highs and lower lows. This confirms that the market remains under bearish control, with sellers actively defending each retest of the resistance line. The Resistance Level at 115,600 has acted as a major cap for bullish attempts, rejecting multiple upside moves over the past few weeks. Recently, BTC retested the Buyer Zone near 108,000–109,000, where strong demand emerged, preventing further downside. This level aligns with both the Support Line of the channel and the horizontal Support Level at 106,400, making it a critical zone for potential bullish reactions. At the current stage, the price is showing early signs of a corrective rebound from the Buyer Zone. I believe this recovery could push the price toward the Seller Zone and Resistance Line, with a short-term target (TP1) around 114,000. However, this move should be viewed as a correction within a broader bearish trend unless BTC manages to break and hold above the 115,600 resistance area. My scenario suggests that BTC could face selling pressure once it reaches the upper boundary of the channel, possibly leading to another bearish leg unless bulls confirm a breakout. Please share this idea with your friends and click Boost 🚀

BTC - CHANCES ON COLLAPSE ARE RAISINGMorning folks,
So, BTC has failed to start upside action as with our 4H H&S as with 30-min H&S that we mentioned last time as a tool for long entry. The last one actually has not been formed at all. So, no entry signal followed.
Now, based on 4H picture, nominally we still could believe that H&S will survive and BTC still will reverse up. We do not argue, but... this might happen only by some external driver. It will be some wild card scenario, but we can't make a bet on it. Technical picture looks weak, and suggests price return back to 105K lows.
To return back to bullish view we need to get upside jump and confirmation of validity of this H&S pattern. In this case bullish scenario will be possible.
Now we prefer to stay aside from any bullish trades.
