BTC/USDT 1H Chart Short-Term📉 Descending Channel (black lines)
The price previously moved within a clear descending channel, which was broken upward.
A breakout from the channel signals a change in the short-term trend – from supply pressure to an attempted rebound.
From a technical perspective, a breakout from a descending channel often leads to an upward correction, the extent of which is at least the midpoint of the previous downward impulse.
🔷 Triangle Formation (blue lines)
After breaking out of the channel, the price formed a symmetrical triangle (consolidation) – a sign of market indecision.
Triangles of this type are often trend continuation patterns, but in this context – after a breakout from a descending channel – an upward breakout (i.e., a further upward rebound) is more likely.
The key resistance level to watch is $111,145 – a breakout with volume confirmation would open the way to $112,320 and then $113,921.
🧭 Key Technical Levels
Resistance:
$111,145 – local resistance (upper boundary of the consolidation/triangle).
$112,320 – another strong resistance level from the previous local high.
$113,921 – major medium-term resistance.
Support:
$110,442 – lower boundary of the triangle (short-term support).
$108,793 – support after the recent bounce.
$107,285 – next demand level.
$104,969 – bulls' defensive boundary in the broader context.
📊 Stoch RSI (bottom of the chart)
The Stoch RSI oscillator is currently in a rebound phase from the neutral level (~40–60).
If the lines (blue and orange) cross upwards and enter the zone above 80, this could confirm bullish momentum and a breakout from the triangle to the upside.
However, a rejection from 60 and a further drop below 20 would signal a false breakout and a possible retest of USD 108,800.
🔎 Scenario Summary
➡️ Upside Scenario (more likely):
Breakout from the triangle to the upside (confirmed by a 1-hour candle above USD 111,150).
Potential move to USD 112,300 → USD 113,900.
Momentum indicators support a rebound if the Stoch RSI maintains its upward trend.
⬇️ Downside scenario (alternative):
Unsuccessful breakout and return below $110,400.
A correction to $108,800 can then be expected, and if this level is broken, a further decline to $107,300.
BTC-D

If $GOLD is at its peak, is $BTC next?Gold has been rejected at the 0.618 level of the Fibonacci channel on the 3M chart.
The Stoch RSI demonstrates a striking similarity to past cycles:
The bullish structure, which continued in the overbought region in October 2010, peaked 273 days later in July 2011.
Momentum, which continued in the overbought region again in October 2019, reached its peak 365 days later in October 2020.
Today, history paints a similar picture once again.
The bullish structure, which began in the overbought region in October 2024, may have reached its peak approximately one year later, in October 2025, just as in previous cycles.
Gold appears to be completing its historical rhythm once again.
Note: The Bitcoin / Gold pair is developing in the opposite direction.

TradeCityPro | Bitcoin Daily Analysis #207👋 Welcome to TradeCity Pro!
After a short break, let's get back to the daily Bitcoin analysis. The market is still in a very large range box.
⏳ 1-Hour Timeframe
Currently, Bitcoin is recovering after the drop to the 106319 level and has moved up to 110803.
✅ Today is Saturday, and as you can see, the market volume has dropped significantly. It seems that the market may range until tomorrow afternoon and won't move much upwards, with the main movement starting next week.
⚡️ The triggers we have for opening positions right now are:
For long: 110803
For short: 108844 and 106319
💥 Overall, Bitcoin is in a very large range box between 106319 and 115808, and as long as the price stays between these two levels, I will open my positions with very low risk.
❌ Disclaimer ❌
Trading futures is highly risky and dangerous. If you're not an expert, these triggers may not be suitable for you. You should first learn risk and capital management. You can also use the educational content from this channel.
Finally, these triggers reflect my personal opinions on price action, and the market may move completely against this analysis. So, do your own research before opening any position.

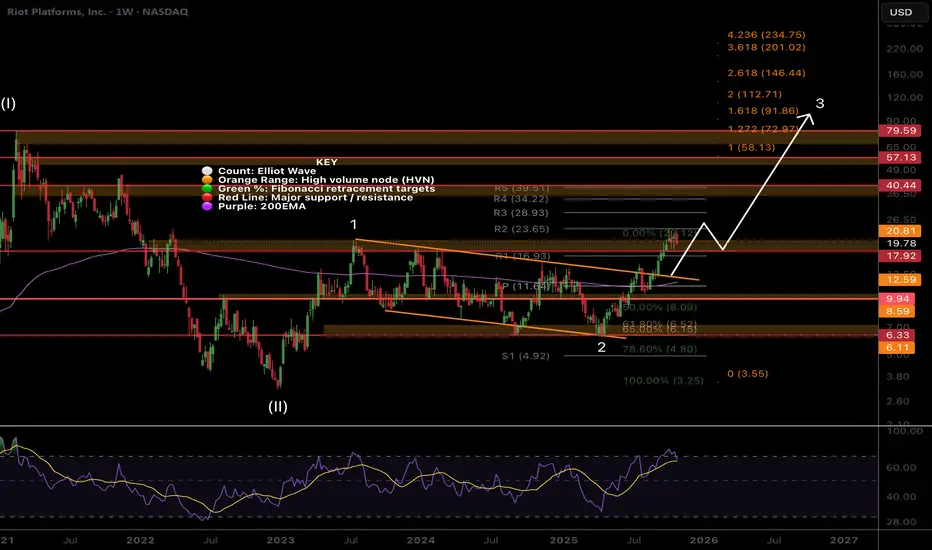
RIOT, nothing changed, Higher...Riot is another low cap volatile asset that keeps people afraid with its wild swings as I am seeing panic in my comments across platforms.
Price remains in momentum breaking out of the channel in a wave 3 with a minimum target of the 1.618 Fibonacci extension at $91, a 4x from here. Wave 2 completed at triple support- Fibonacci golden pocket, High Volume Node and channel boundary before quickly overcoming the weekly pivot and 200EMA. Breaking out above wave 1 is a show of strength.
Price should stall at the High Volume Nodes as supply comes in; $21, $40 and $57 but ultimately they should be overcome.
🎯 Terminal target for the business cycle could see prices as high as $112 based on Fibonacci extensions
📈 Weekly RSI is oversold with no divergence and can remain here for months as price keeps increasing.
👉 Analysis is invalidated if we close back below $9
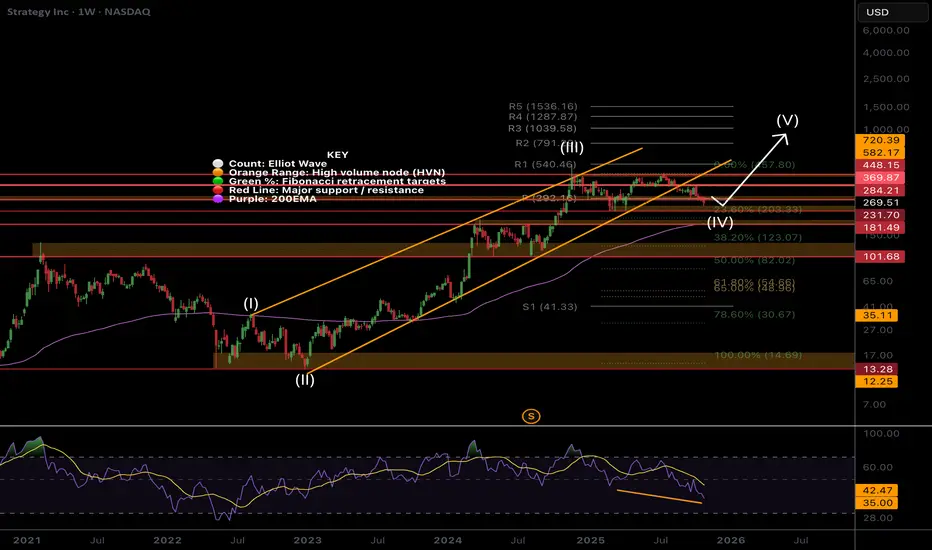
MSTR weekly bull divergence on low sentimentSentiment is low, the asset is hated and misunderstood by TradFi and retail. It’s a recipe for a bottom!
Price is still in a wave (IV) which are expected to be long and drawn out, driving investors into shallow capitulation through boredom into patient hands. I don’t expect wave (V) to kick in until Bitcoin moves. Wave (V) has an expected target of the R3 daily pivot at $1039 but will overextend if Bitcoin does.
Price has fallen out of the lower channel boundary and sitting below the weekly pivot, still above the weekly 200EMA so the outlook is bullish. Wave (4) may complete at the 0.236 Fibonacci retracement at $230. For now I am waiting to see what happens before entering. Good opportunities are setting up.
🎯 Terminal target for the business cycle could see prices as high as $1000 based on Fibonacci extensions
📈 Weekly RSI has bullish divergence
👉 Analysis is invalidated if we close back below $82
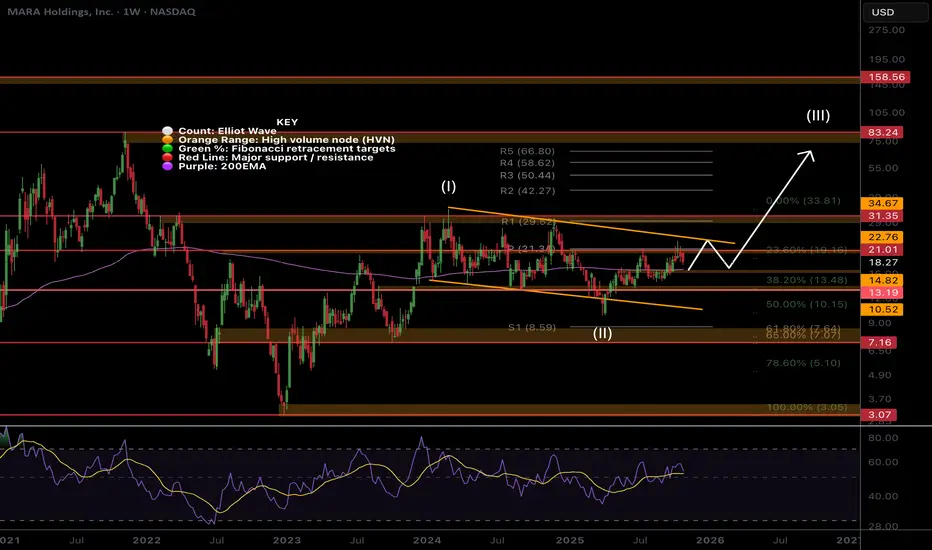
MARA boring... Investors cant waitMara has the potential for a strong move alongside Bitcoin but has ultimately been boring. Investors struggle the most with boredom and see is as negative and bearish. This is not the case and it could just be accumulating towards a strong breakout.
Price is stalling at the weekly pivot as expected but is above the 200EMA- a great buy spot. Wave (II) appears complete at the 0.5 Fibonacci retracement with a swing below the lower boundary trend-line. Wave 3 of (III) appears to be underway so I am looking for an aggressive breakout to the upside once we clear the current resistance. The R1 pivot is the first target at $30 where the last bit of major resistance is. Wave (III) has a target of $83 at the next major High Volume Node resistance, just above the R5 pivot.
🎯 Terminal target for the business cycle could see prices as high as $80 based on Fibonacci extensions and High Volume Nodes
📈 Weekly RSI is at the EQ.
👉 Analysis is invalidated if we close back below wave 2 at $9.50.
IREN ready for pullback?Price has overextended in a macro wave 3, the strongest and most powerful move described as a “wonder to behold” by Ellioticians. Novice investors are likely to get over-confident in these conditions, enter without risk management and keep chasing price upwards only to be underwater when it turns around.
Profit taking appears to be taking place, I have closed my positions waiting for re-entry. The weekly pivots have been ran.
Initial downside targets for wave (4) is the 0.236 Fib retracement at $39 followed by the 0.382, $26.43. Expect shorts to pile in adding to any downside momentum.
In the long term we have higher to go towards $100 in wave (5).
🎯 Terminal target for the business cycle could see prices as high as $100 based on Fibonacci extensions
📈 Weekly RSI is oversold with no divergence and can remain here for months as price keeps increasing.
👉 Analysis is invalidated if we close back below the weekly 200EMA

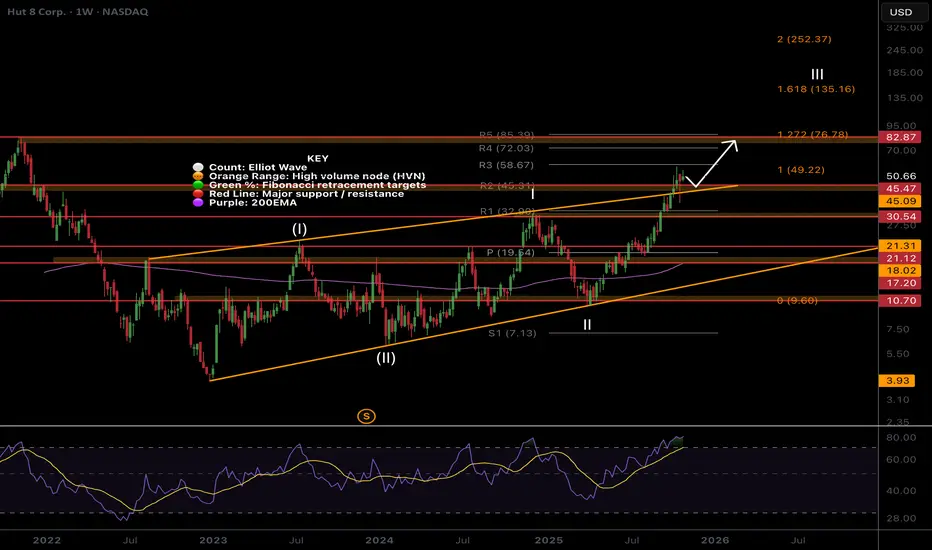
HUT, ready for more upsideHuge daily candles are perfectly normal behaviour and nothing to be afraid of, we stay zoomed out to observe the larger trend to keep our emotions check.
Price has broken out of the channel upper boundary and a test of the boundary took place as expected, quickly catching a bid. We are now looking for continuation to trigger a long.
The next target is the High Volume Node resistance at $82 just under the R5 weekly pivot. Fibonacci extension 2 has a terminal target of $252, achieved with momentum and tailwinds only.
📈 Weekly RSI is oversold with no divergence and can remain here for months as price keeps increasing.
👉 Analysis is invalidated if we close back below the weekly 200EMA
COIN Much higher to comeCoinbase had a shallow pullback in wave (II) after running 10x in wave (I). Wave (II) was expected to reach the 0.618 Fibonacci retracement but was front run above the 0.5 demonstrating long term strength.
R5 weekly pivot target is now $841 which is expected to be hit if we get tailwind momentum in wave (III). Price appears to be finding a bottom locally and preparing for the next leg up into price discovery.
RSI has plenty of room for months of overextension in price.
🎯 Terminal target for the business cycle could see prices as high as $800 based on the weekly pivots
📈 Weekly RSI is oversold with no divergence and can remain here for months as price keeps increasing.
👉 Analysis is invalidated below wave (II), $148

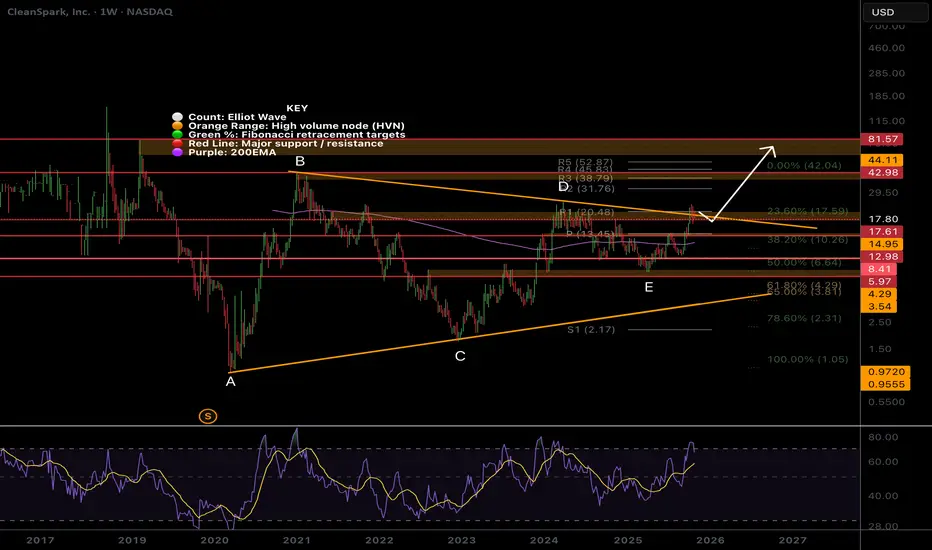
CLSK, Still much higher to goTheres a lot of fear in my comments across platforms due to the candle sizes. Participants need to understand the volatility of their holdings or face repeated mistakes and stress due to fear.
Price is attempting to breakout of the macro triangle upper boundary but was rejected. Breaking above wave D at $24 is key to trigger the next thrust I’m looking for towards $42 then $80 all time High Volume Node. Triangles are penultimate patterns found before a final strong move.
Price has momentum above the weekly pivot 200EMA but currently trapped in a High Volume Node where we expect price to stall before continuing upwards.
🎯 Terminal target for the business cycle could see prices hit $80- the all time High Volume Node
📈 Weekly RSI is oversold with no divergence and can remain here for months as price keeps increasing.
👉 Analysis is invalidated below wave E, keeping the triangle alive
BTDR Nothing changedHuge daily candles are perfectly normal behaviour and nothing to be afraid of, we stay zoomed out to observe the larger trend to keep our emotions check. It is feature of these type of assets and is why we can make so much money from them when using the right risk management strategy.
Our first profit target has been hit at $25 all time High Volume Node where price is finding a range as some exit. Price has done 10x since the 2023 bottom. Once this range has worked itself out price is expected to continue upwards into price discovery. A retracement to the weekly pivot should be expected, where I will add to my positions and look for a long.
The macro structure is bullish in an Elliot wave ABC as there are many series of 3 wave structures. Wave (3) of C of (C) is underway with a target of the 1.618 Fibonacci extension $41.17. Price can significantly overextend in volatile assets with momentum and it’s these extremities we look to take secondary profit.
🎯 Terminal target for the business cycle is still the channel upper boundary and R3 weekly pivot at $55. A break out above this would be very bullish and could see prices as high as $80+
📈 Weekly RSI has months left of upside potential.
👉 Analysis is invalidated below wave B and 200EMA, $11.

what if $BTC Bitcoin has been trading within this ascending channel for years.
It has repeatedly touched the red resistance line but has never broken through.
Now, it's quietly recovering within the lower band.
The next upward move is $200k which coincides with the red resistance line.

ATH incoming...The price will rise to $115,000 and then drop to the $103,000 range. This movement is driven by the liquidation of long and short positions. After collecting these liquidations, the price is expected to return to its previous all-time high (ATH)

Has Bitcoin already priced in its next move ? | Day 56☃️ Welcome to the cryptos winter , I hope you’ve started your day well.
⏰ We’re analyzing BTC on the 1-Day timeframe .
👀 Bitcoin on the daily timeframe. After the flash crash it experienced, Bitcoin is almost building a box with a top at $114,559 and a bottom at $106,431, which by breaking these areas, it can get out of this trading range and give us a position.
The noteworthy point in the recent days is the Monday meeting between Trump and the President of China, which can determine the destiny of the market and give it a good direction.
🧮 The RSI oscillator, two key zones have formed for us in the areas of 54.5 and 36, and by the fluctuation limit crossing these areas, the next move of Bitcoin can begin.
🕯 Bitcoin’s volume on the daily timeframe has increased sharply after recording a new all-time high, and this has been a tendency toward increasing selling pressure. In the image, it is completely clear that you can see exactly what happened to the market after the flash crash it experienced.
📈 To take a position with this structural style that we currently have, you can refer to the multi-timeframe analysis of Bitcoin and extract the long and short position triggers, and if Bitcoin gives you an entry, enter the position around the anticipated top or bottom with low risk so that later you can add more volume to your position at higher or lower levels.
❤️ Disclaimer : This analysis is purely based on my personal opinion and I only trade if the stated triggers are activated .

BTC Retracement Setup After Liquidity Sweep at Key Resistance📊 Bitcoin 4H Analysis – Bullish Momentum Meets Key Liquidity Zone
Bitcoin continues to trade within a strong bullish trend on the 4-hour timeframe. Price has now tapped into a major resistance zone — the liquidity sitting above a previous external range high. This reaction suggests we may see a corrective move before the next leg higher. 🔁💡
I’ll be waiting for price to retrace back into equilibrium of the current bullish price swing, where premium turns to discount, to look for a high-probability long setup. ✅🎯
⚠️ Not financial advice — for educational purposes only.

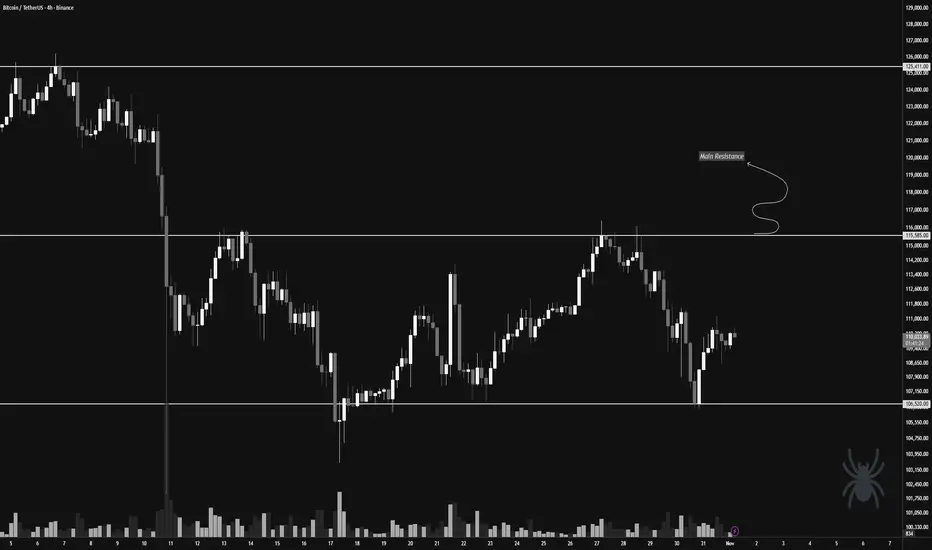
Has Bitcoin entered the distribution phase yet?👋🏻 Hey everyone! Hope you’re doing great! Welcome to SatoshiFrame channel.
✨ Today we’re diving into the 4-Hour Bitcoin analysis. Stay tuned and follow along!
👀 On the 4-hour timeframe, we can see that Bitcoin recently dropped due to the impact of the FOMC news but then rebounded from the key support level at $106,520 and is now facing its multi-timeframe resistances. Looking at the chart more broadly, we notice equal highs and lows around the $115,585 and $106,520 zones. With a breakout of either of these levels, Bitcoin could experience a sharp and significant move.
🧲 Bitcoin’s selling volume has slightly increased, and if the supports break, this selling could turn into pressure — collectively applying downward force on the market price. Then, buyers may re-enter and start buying Bitcoin again. The hypothesis of a possible distribution phase could turn into a valid theory; however, we must be cautious — if Bitcoin decides to move upward after Monday’s session, it could confirm a new all-time high and continue its upward trend.
✍️ The main scenario for Bitcoin lies around the $115,585 price zone. If this level breaks, we could enter a long position and stay with it for a potentially extended upward move. It’s worth noting that an increase in buying volume along this path could serve as a strong confirmation for our long position.
On the other hand, the short position scenario would become valid if the price breaks below the support and selling pressure intensifies, giving us a high-momentum short setup.
❤️ Disclaimer : This analysis is purely based on my personal opinion and I only trade if the stated triggers are activated .
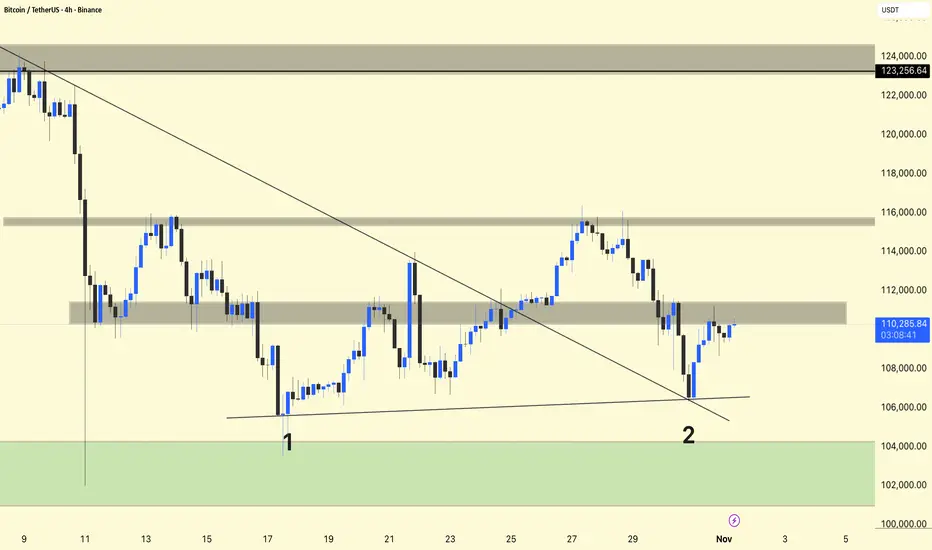
BTC/USDT 4HOUR CHART UPDATE !!BTCUSDT 4-Hour Chart Update and Analysis
Support: BTC has successfully formed two higher lows near $106,000-$107,000 (marked 1 and 2), indicating that the green area remains strong.
Resistance: The price is currently facing resistance near $111,500. This area served as previous support and could now limit short-term upside.
Trend: Price activity is showing stabilization after a pullback and is attempting to reclaim the breakdown level.
Outlook: Sustaining above the trendline and the $109,500-$110,000 range provides bullish support. If resistance is broken, a return to $113,000-$115,000 is targeted.
DYOR | NFA
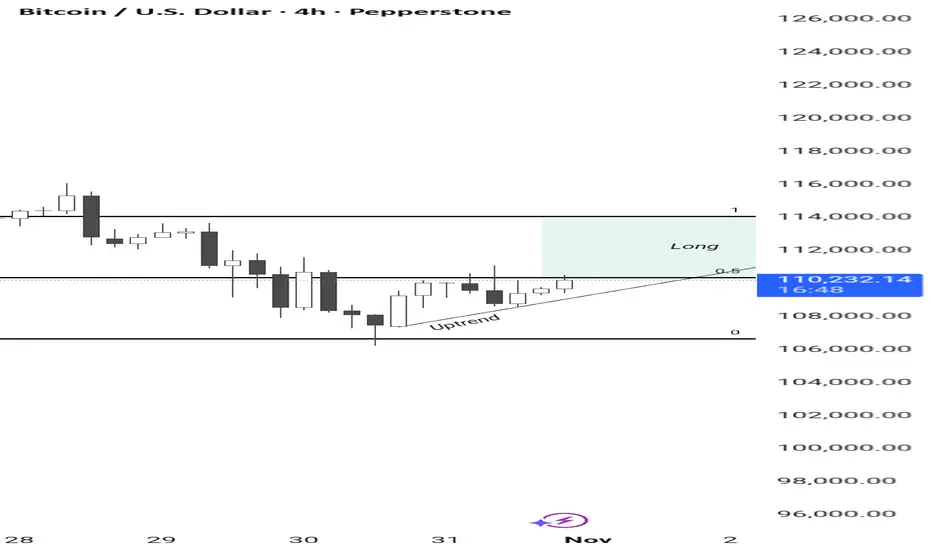
Bitcoin Bitcoin rejected the price at the support level of 107000, now in an uptrend at the 0.5 Fibonacci level, favoring a continuation of the long movement to the resistance at 114000.
BTC DominanceBitcoin Dominance gives up 1 year after each halving. You should accumulate altcoin as long as Bitcoin dominance is above 50%.

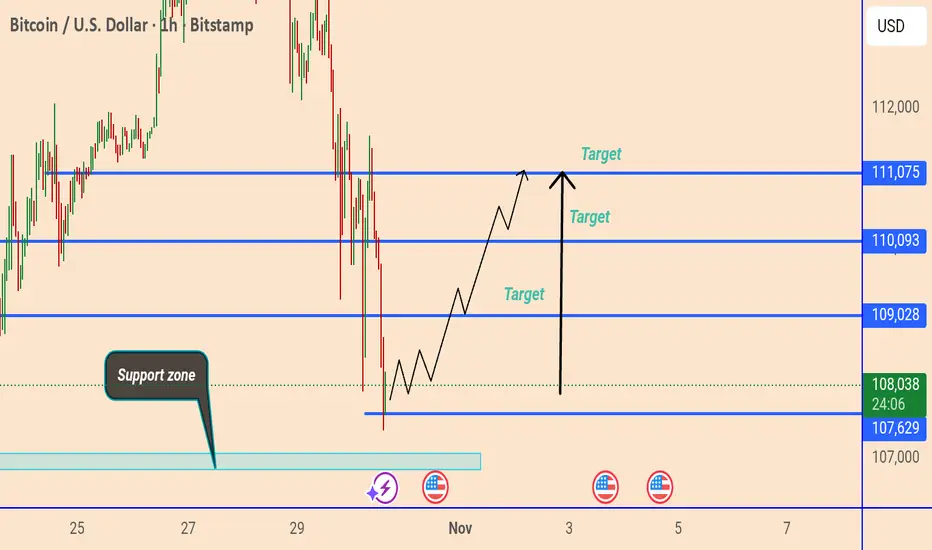
Bitcoin Price Analysis: Potential Rebound from Key Support Zone This chart shows the BTC/USD (1-hour) price action with key support and resistance levels. Bitcoin is currently trading near $107,904, slightly above a highlighted support zone around $107,629–$107,000. The analysis suggests a potential bullish reversal from this support, with projected upside targets at $109,028, $110,093, and $111,075.
LLY LOOKS BULLISH OCT 31 2025I have LLY from lower levels of 870ish which was trade 2. Trade 1 was initiated at 637. Now again it looks ready to go to 890
I am long since $815 yesterday.
Trade as per your risk management and its a current price trade so SLs would be huge. But I can understand what price is trying to do here.
LLY should breakout

BTC/USDT | Bitcoin Bounces Back — Bulls Eyeing $112K Next!By analyzing the #BTC chart on the 12-hour timeframe, we can see that after a healthy correction down to $106,350, Bitcoin has regained its footing and is once again trading near the $110,000 zone. This recovery shows that buyers are still stepping in aggressively to defend key supports and maintain bullish momentum.
As long as BTC stays above $108,600, the bullish outlook remains valid. The next upside target sits around $112,000, where we might see some short-term reaction before another potential correction — likely a setup before the next major bullish wave.

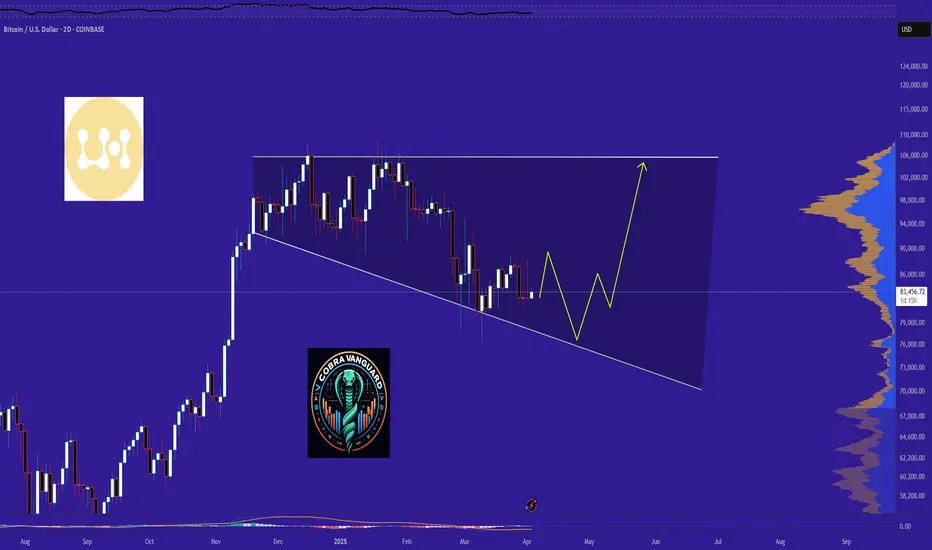
BTC Ready for PUMP or what ?The BTC will increase 20k and reach to the top of the wedge in the coming DAYS.
Give me some energy !!
✨We spend hours finding potential opportunities and writing useful ideas, we would be happy if you support us.
Best regards CobraVanguard.💚
_ _ _ _ __ _ _ _ _ _ _ _ _ _ _ _ _ _ _ _ _ _ _ _ _ _ _ _ _ _ _ _
✅Thank you, and for more ideas, hit ❤️Like❤️ and 🌟Follow🌟!
⚠️Things can change...
The markets are always changing and even with all these signals, the market changes tend to be strong and fast!!