HBAR | Retraced into Key Support Zone – Long Spot SetupHBAR has pulled back into a major support zone at $0.13–$0.14, which has historically acted as a strong demand area. This presents a potential long spot opportunity for traders watching for a bounce or trend continuation.
🟢 Trade Idea
Entry Zone: $0.13 – $0.14
Take Profit 1: $0.19 – $0.21
Take Profit 2: $0.25 – $0.29
Stop Loss: $0.12
🔁 The plan is to ladder in through the support zone and scale out at the outlined targets, aligning with previous resistance levels. A clean break below $0.12 would invalidate the setup and suggest reevaluating the trend.
📌 Watching price action and volume closely in this zone. Always use proper risk management and size positions accordingly.
BTC-D

Is Bitcoin still bearish? (1D)In response to the question of whether Bitcoin is still bearish | the answer is yes.
After the drop, Bitcoin has reached a strong support zone, where it’s currently reacting and consuming lower supports. A rejection from the red zone is expected.
However, keep in mind that due to the high volume of short positions, the red zone might even experience a fakeout before the drop continues.
A daily candle closing above the invalidation level would invalidate this analysis.
For risk management, please don't forget stop loss and capital management
Comment if you have any questions
Thank You

Opportunities for market growth at the end of the yearToday we have reached a new major bifurcation point in the middle of the quarter, which I have focused on. For individual coins, starting in the middle of this week, the probability of a bullish quarterly candle reversal with large growth waves will increase, similar to RESOLV and TNSR. Such reversals will be facilitated by a slowdown in the fall of ETH with attempts to change the trend before the end of the year.
So far, the bearish influence has prevailed in the market, with the opening of most major periods below key resistances and stable sales until the middle of the quarter to consolidate below 3,500, which I will indicate in the latest review. The ultimate goal of the bears in this quarter is to test the range of 2500-2750, with an attempt to close the annual candle in it under a negative scenario, and against the background of consolidation below 3500, this goal is still relevant. By the end of the month, we may still see new sales impulses to break through 2750, but with increasing buying activity at the end of each week, against which individual coins will try to grow. The second half of the quarter for ETH opened below 3,250, which gives a signal for sales below 3,000 up to 2,500, but an opening above 3,100 is a technical signal for growth up to 3,500-4,100. The attempt to reverse the quarterly candle is also facilitated by its opening above 4,100.
And so, under an optimistic scenario and a stable transition to a reversal of the quarterly candle in the second half of the week, purchases can be expected until the end of the week, with the aim of opening a new week above 3250, which will ensure continued growth until the end of the month and the possibility of opening a new month with a growth signal before the end of the year. With less volatility, there is a chance of opening a new week below 3,100, which could lead to a reversal next week.
As I wrote in a review at the beginning of October, BTC opened the quarter negatively, with a pullback signal down to 90-100 k, which the bears successfully worked out. There is a large medium-term support in the 85-90k zone, from which a pullback is likely. In addition to the growth of the altcoin index and the growth of ETH/BTC, which I expect at the turn of the quarter, the slowdown in the decline of BTC will also cease to put pressure on the market and allow individual coins to show major reversals.
Brent may once again have quite a big impact on the markets. If today and tomorrow the price fixes above $ 64 and, moreover, above $ 65, then the probability of growth of the crypt will prevail until the close of the week. In the event of US manipulation and a sudden new wave of brent sales below $62.5 today or tomorrow, there will be a chance for an ETH reversal before the weekend. Given the released data on stocks in the United States, the probability of a positive scenario prevails. All markets are connected, and no matter how absurd it may seem at first glance, it was the background manipulation of the commodity price that allowed the bears to break through key supports on ETH more than once, both on October 10 at 4,100, and at the subsequent 3,500, 3,250 and 3,100. By superimposing the dynamics of brent in the second half of the week on the dynamics of ETH by the weekend, you can see a chain reaction. That is why by the second half of October, I predicted a drop down to 3,500 by the end of the week, in the event of a drawdown of brent to $ 60.
Against the background of a slowdown in the fall of ETH and attempts to reverse the quarter, it is possible to make regular toppings for individual coins. First of all, it is worth paying attention to TURTLE and MITO, which have strong technical signals for growth up to 0.21-25 in the medium term. So the potential is the ground for dynamics similar to RESOLV. VIC BMT HOOK CHESS also has slightly weaker technical signals for growth, which I am also considering working with in the first place. On an attempt to reverse the quarter, there is a high probability of their growth to 50-70%, at least with the aim of breaking the last monthly candle. In the case of a stable ETH reversal, growth impulses of up to 200%+ can be expected.
Similarly, growth waves of up to 40-50% may show weaker instruments that do not have obvious signals, but are in an extremely oversold zone, such as QUICK COS FIO DATA. In my opinion, these tools are candidates for the assignment of the monitoring tag, given the dynamics, and therefore I recommend using a small position when working with them.
In addition to the positive note towards the end of the year that has appeared at the moment, I would like to focus on the overall negative dynamics of the market, which may continue at the beginning of the year. The current likely pullback on the quarterly and annual candles is still a temporary phenomenon and gives opportunities to coins that have technical growth signals left earlier. Most of the market, after attempts to roll back the tops at the turn of the year, is likely to continue falling until the second quarter. That is, coins without obvious growth signals, especially those with large capitalization, may remain flat until January or February without significant purchases followed by a major break.

USDCAD rise/fall?USDCAD at a key zone and showing signs of weakness. Some major news coming in less than 2 hours, waiting for liquidations and reactions to jump in on sniper entries.

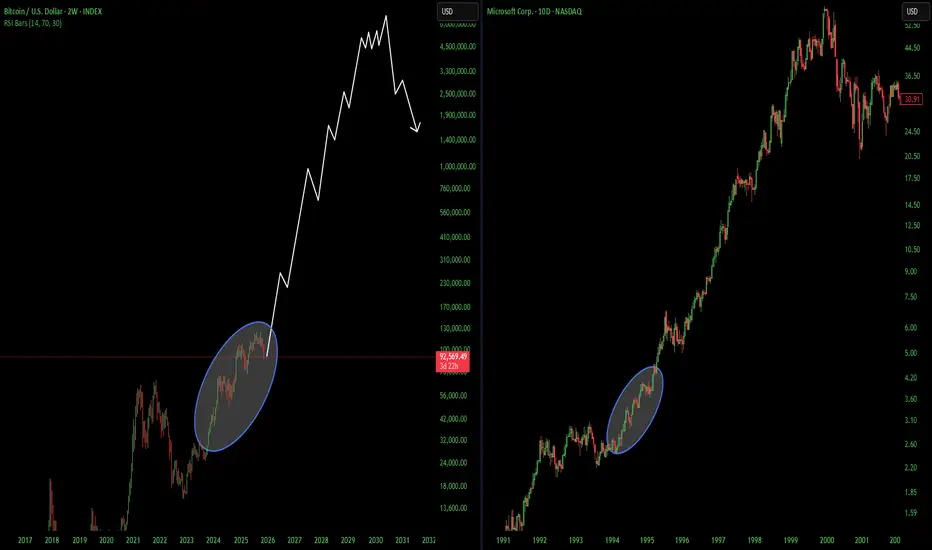
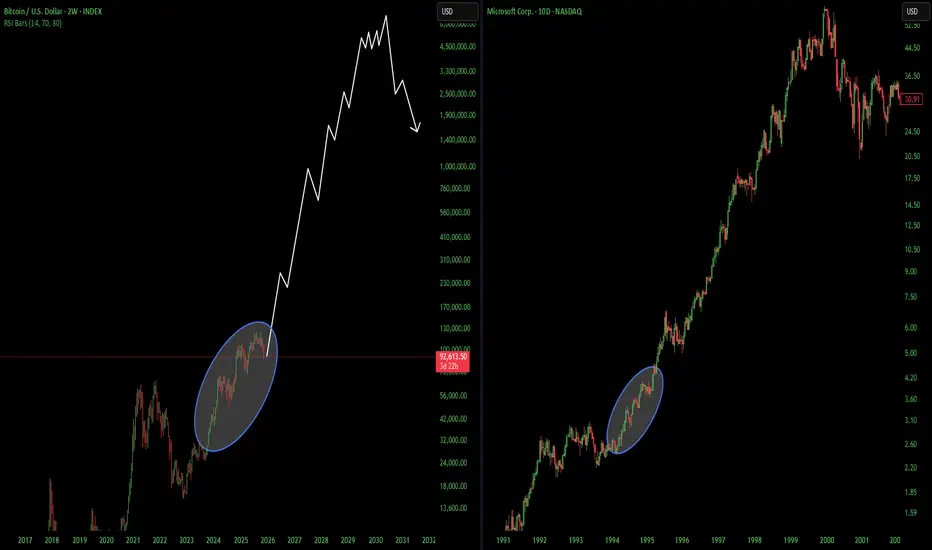
Is it really possible for Bitcoin to reach 1 million dollars?Is it really possible for Bitcoin to reach one million dollars?
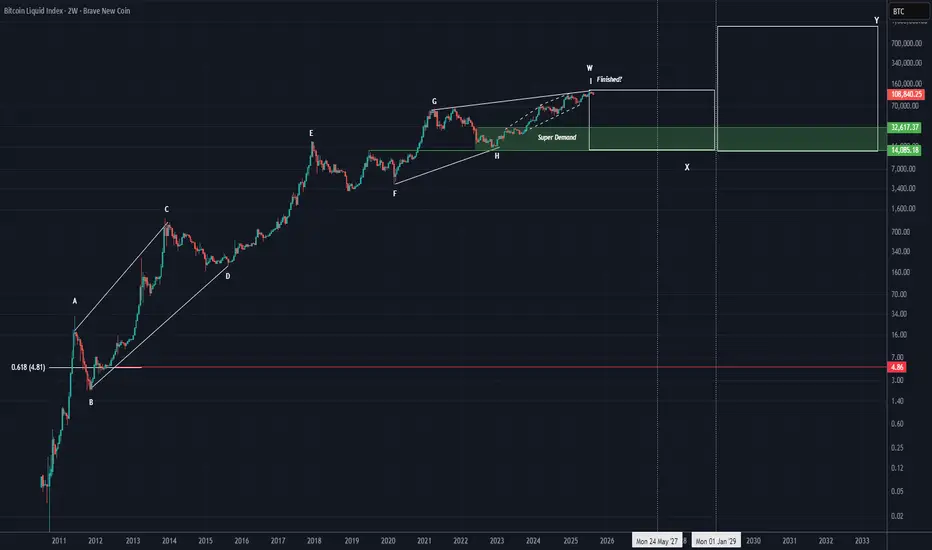
This is the complete Bitcoin data | from when it was $0.01 up to the last all-time high of $125K. Whether we like it or not, a large-degree pattern on Bitcoin is reaching completion, and we are looking at the chart without bias, purely through wave theory.
The symmetrical pattern you see on the chart is on the monthly or 2-week timeframe.
We are currently in the final wave, wave i of W. Wave i of W itself is a diagonal or symmetrical pattern (which we discussed in THIS POST () |this post only concerns branch i of W of this pattern).
When such a large pattern completes, there are two possibilities:
A counter cycle of the same degree begins , or
An X wave forms.
First scenario: forming a new pattern is very unlikely because if it happens, the Fibonacci 0.618 target of this pattern would be reached | around $4–$10 for Bitcoin. If this happens, the entire crypto market would effectively become a scam. This scenario is highly improbable and currently illogical.
Second scenario: the formation of an X wave. It’s worth explaining X waves: X waves connect patterns of the same degree without requiring large time-price corrections relative to the previous pattern, allowing a phase | whether bullish or bearish | to extend. Here, since the first phase is bullish, the pattern after the X wave will also be bullish.
For Bitcoin, if an X wave forms, the best range for it to end is $32K–$14K, and the X wave could last until 2027–2028. The two time lines indicate where the X wave could end.
When a new cycle begins, it is of the same degree as the previous pattern. This means we will have years of bullish phases with corrections, similar to the first phase W, which is represented on the chart from wave A to I.
The target of the second pattern, Y, after the X wave, can realistically reach $1 million! The estimated time frame for reaching this target is 2031–2039, but why the 8-year tolerance? This accounts for the pattern type: if it’s a triangle, these targets could be reached faster, but if it’s another multi-branch pattern, the timing may extend.
From a technical and wave-theory perspective, this is indeed possible. This is our broad 10-year outlook on Bitcoin.
❤️ Stay with us updates will be provided in the future with support and resistance zones plotted on the chart. Do you really think Bitcoin can reach $1 million?
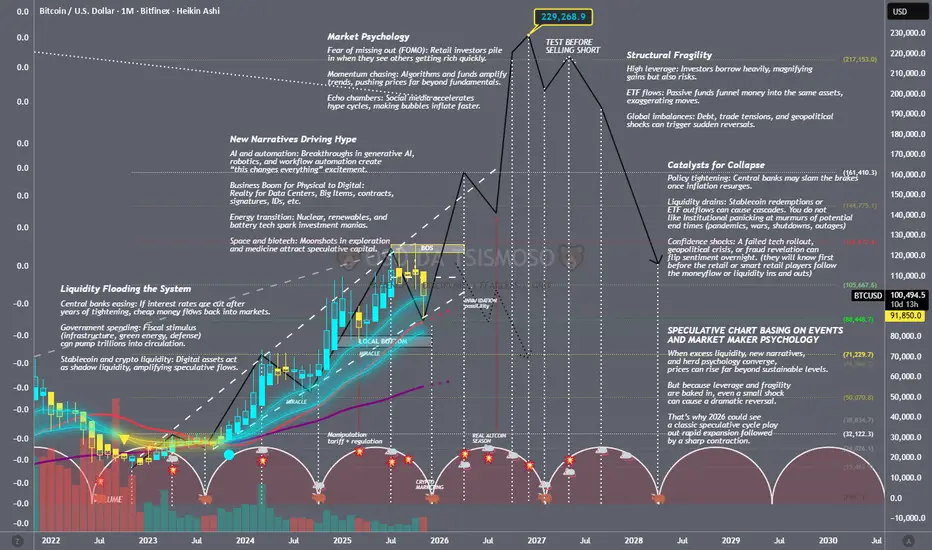
SPECULATIVE CHART (EVENTS AND MARKET MAKER PSYCHOLOGY FOR BTC)📘 Bitcoin Speculative Cycle (2026 Potential move I see)
1. Recognize the Setup
Liquidity conditions: Track central bank easing, stablecoin issuance, and ETF inflows. These are the fuel.
Narratives: Watch for hype drivers (AI + blockchain, tokenized real‑world assets, sovereign adoption).
Sentiment signals: Social media buzz, Google Trends, and retail inflows often spike before parabolic moves.
2. Identify the Expansion Phase
Price action: BTC breaks prior cycle highs with strong volume.
On‑chain metrics: Rising active addresses, increasing exchange inflows, and high leverage in futures.
ETF/Institutional flows: Monitor daily net inflows into Bitcoin ETFs — they magnify moves.
3. Ride the Momentum
Entry strategy: Scale in during confirmed uptrend (higher highs, higher lows).
Risk management: Use stop‑losses or hedge with stablecoins; never go all‑in.
Position sizing: Keep leverage modest speculative cycles punish overexposure.
4. Spot the Peak
Excessive leverage: Funding rates go extreme, perpetual swaps show unsustainable longs.
Retail mania: Everyone is talking about BTC, mainstream media runs “get rich quick” stories.
On‑chain warnings: Whales start sending coins to exchanges, signaling distribution.
5. Prepare for the Collapse
Exit strategy: Scale out when parabolic moves stall; don’t wait for the top tick.
Liquidity drains: Watch stablecoin redemptions and ETF outflows they trigger cascades.
Policy shocks: Rate hikes or regulatory crackdowns can flip sentiment instantly.
6. Survive and Reset
Capital preservation: Rotate into cash or defensive assets once the downtrend is confirmed.
Audit your trades: Document entries/exits to refine your playbook for the next cycle.
Re‑accumulate: Buy back BTC only after capitulation signs (low volume, despair, long consolidation).
🛠 Tools I used to track this;
On‑chain dashboards: Glassnode, CryptoQuant (free tiers give useful signals).
ETF flow trackers: Daily inflows/outflows for spot BTC ETFs.
Stablecoin supply charts: USDT/USDC issuance as shadow liquidity indicators.
Funding rate monitors: Binance, Bybit, Deribit for leverage extremes.
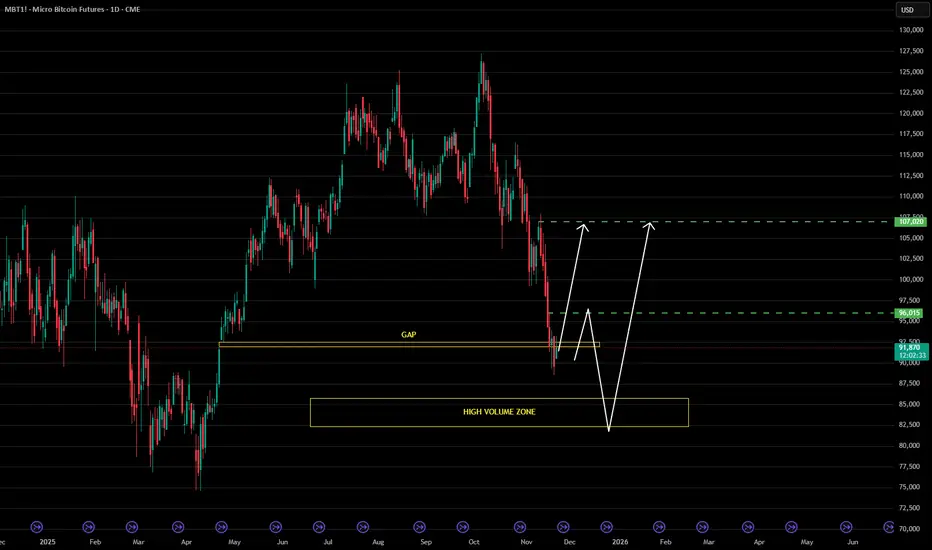
Bitcoin: Two Development Scenarios from Gap Closure ZoneCurrent Situation
Bitcoin has completed a sharp decline and is located in the critical gap closure zone. The chart shows two key technical elements: a resistance level in the upper part of the range and a high volume zone (HIGH VOLUME ZONE) significantly below current prices. Price has stopped precisely in the gap area, creating conditions for institutional players to make their decision.
Primary Scenario: Bounce from Gap Closure Zone
An immediate reversal upward from current levels is possible with subsequent movement toward key resistance. Gap closure often acts as a price magnet and correction completion point. If limit players are ready to defend this zone, a strong bounce is possible without testing lower levels.
Target Levels:
Movement toward the upper boundary of the range
Test of key resistance where price was previously stopped
Alternative Scenario: Test of High Volume Zone
Price may continue declining toward the high volume zone (HIGH VOLUME ZONE) located significantly lower. This area represents interest for forming a long-term reversal, as high volume concentration indicates institutional position accumulation. A more powerful and sustainable reversal upward is possible from here.
Key Levels of Alternative Scenario:
HIGH VOLUME ZONE — area for potential long-term reversal
Possibility of forming a strong base for upward movement
Trading Plan
For Primary Scenario:
Monitoring price reaction in current gap closure zone
Entry into long positions upon formation of reversal patterns
Target: movement toward key resistance
For Alternative Scenario:
Waiting for decline to high volume zone
Looking for signs of selling absorption in HIGH VOLUME ZONE
Entry into long positions with more aggressive risk/reward ratio
Risk Management
Primary scenario: stop-loss below gap closure zone accounting for possible false breakout
Alternative scenario: stop-loss below high volume zone with margin for stop liquidation
Recommended to split capital between two possible entry points
bitcoin Outlook after the Dip. What to expect NOW?After breaking out of the descending wedge, the price has reached a very strong PRZ (Potential Reversal Zone) support area. If the price holds this zone, there is hope for a rebound toward new highs. However, if this support fails, the price could drop below $70,000.
BOUNCE TO 98-100KMorning folks,
Last time we explained in details the fundamental background, so BTC remains bearish. But now it stands at weekly oversold and around 95K Daily support area. This creates friendly background for tactical bounce.
On 4H chart we have DiNapoli DRPO "Buy" pattern, that suggests upside bounce to 98-100K area at least.
That's being said, don't take any new shorts right now - wait for the pullback. For bullish intraday position, you could try to use this DRPO pattern. Don't place too far stop, just under lows should be enough, but be aware of NFP volatility today...

Would history repeat itself?Would history repeat itself — or would this time be different?
In previous rally, Bitcoin often rallied, consolidated, then experienced a deep washout before breaking into a new all-time high.
Now we’re seeing a similar setup: a strong rally, followed by consolidation…
but the question is — will we see another deep correction first, or will Bitcoin break directly into a new ATH this time?

Bitcoin Downtrend UpdateAlright friends, Bitcoin has confirmed its intention to move toward 86,000 and lower.
My previous forecast with the invalidation zone at 96,600 is still valid, but I decided to make a fresh post.
At the moment, my new invalidation level is 96,012.5.
From a broader perspective, I’m still expecting Bitcoin to reach 83,000.
But as I mentioned earlier, we first need to see 86,000 tested — because once that level is hit, Bitcoin may go into a correction before continuing toward 83,000 and below.
Yes-yes, I do expect it even lower, but more on that in the upcoming updates.
Make sure to follow so you don’t miss them

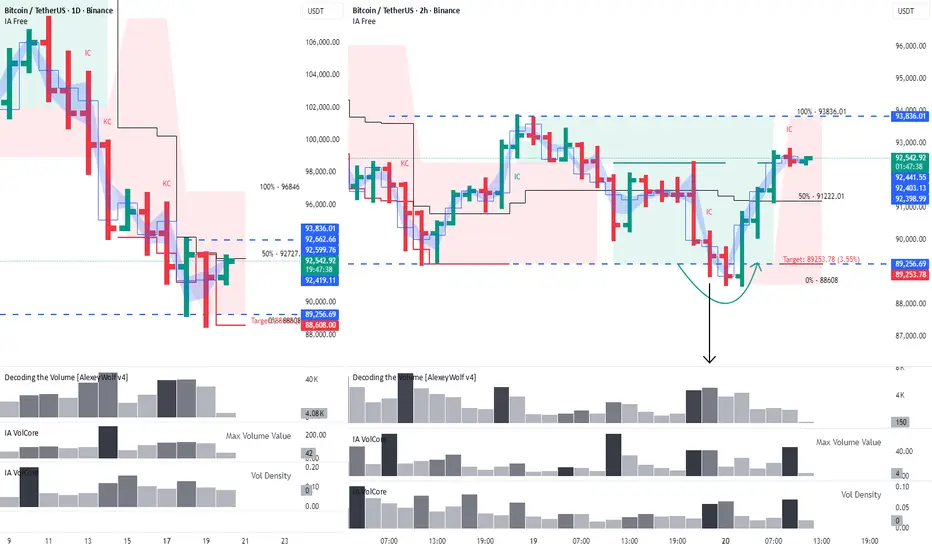
BTC: first signs of a slow reversal?The 89,256 level has slowed down Bitcoin’s decline.
Hello, traders and investors!
This analysis is based on the Initiative Analysis (IA) method.
First, price interacted with the level through a buyer candle with strong volume, and then again through a seller candle with declining volume on the daily timeframe.
On the 2-hour timeframe, the second interaction with this level turned out to be a manipulation of the lower boundary of the range that has formed on 2H.
The target of that manipulation has already been reached, but we may still see price move toward 93,836.
Reaching this level would be a good signal that at least a temporary pause in the downtrend is forming — and possibly the early stage of a reversal, although likely a slow one.
Wishing you profitable trades!
BTC Long if this happenBTC breaked trendline and every buyer is here to trade
if smart money want to Buy btc this trades should SL
then whales will enter

What A Shocker That Would Be Huh?Blackrock, Saylor and gang are in for some big gains. As for most of you who sold you're in for a rude awakening!
What A Shocker That Would Be Huh?Blackrock, Saylor and gang are in for some big gains. As for most of you who sold you're in for a rude awakening!
correction is around the corner?2024 March - August = 32%
2024 Dec - Apr 2025 = 31%
2025 Oct - current = 30%
a 30% correction is around the corner. lets see any rebound opportunity from this zone..?

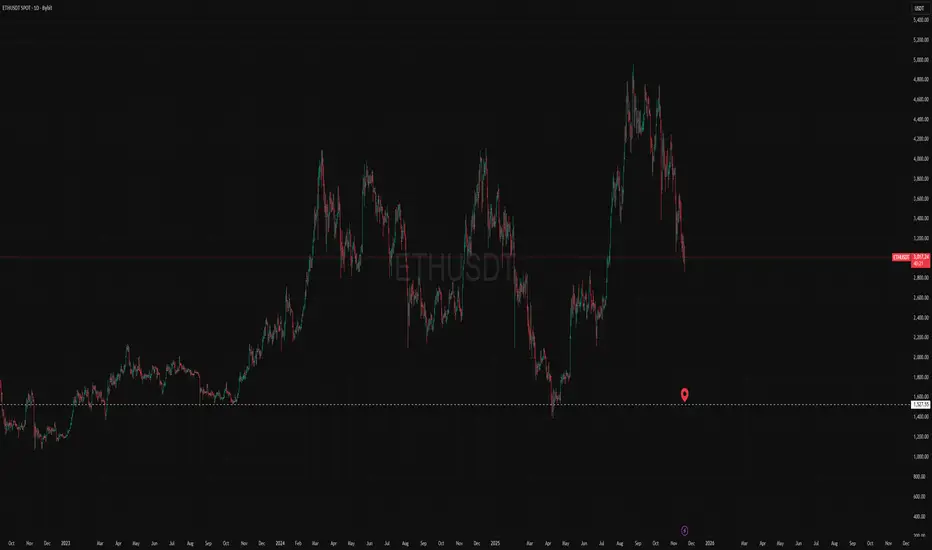
ETH 1527.55 is not a number. Capital Sector. Price Slice.🏷 Capital Sector. Price Slice.
🏷 20.11.2025
🏷 ETH 1527.55 is not a number.
🏷 It is a gate — one that will not open on the day price reaches it,
but in the instant those who once saw it as a target stop waiting for it…
and begin waiting for something else.
🏷 History does not forgive — it remembers.
And only the vengeful — the ones who refuse to forget —
become its keepers.
🏷 Not a price.
Not a level.
Not a point on the chart.
🏷 It is an inscription on stone carved by Darkness, the moment the market awoke to the truth: it is not algorithms, nor liquidity, nor institutions that guide it… but consciousness, frozen in the instant time ceased to be linear.
🏷 1527.55 is not a number.
It is a gate one that will not open on the day price reaches it,
but on the instant those who once saw it as a target stop waiting for it…
and begin waiting for something else.
🏷 In the hushed pre-dawn hype, while traders argue over order books and macro,
while institutions disguise their positions as “diversification”
1527.55 is already there.
It waits.
Like an ancient witness.
Like the final code left behind by the dead era of decentralization.
🏷 It will not be reached.
It will be recognized .
🏷 Those who see it not through indicators, volume, or candlesticks
but through feeling , through the silence after the last long,
through the market’s sudden, inexplicable surrender…
will understand:
This is not a peak. This is a reflection.
🏷 A reflection of what BTC has become: no longer myth but instrument.
Of what ETH is no longer: a platform but memory.
Of what USDT is no longer: a stablecoin but the thread binding reality to what we chose to call real.
🏷 Lucifer carries light not to blind, but to awaken.
He is the archetype of enlightenment not born of prayer, but of price.
The price that squeezes illusion from the masses, leaving only structure.
He is not the devil.
He is the mirror in which the market sees its own soul.
🏷 And MARA?
Not a company.
Not a miner.
Not a stock.
🏷 MARA is his reflection.
The shadow cast when the light of awakening passes through the prism of institutional power.
When enlightenment becomes a tool of control
it takes the form of a logo.
Of balance.
Of 1527.55 .
🏷 MARA is not business.
It is ritual.
Where price becomes sacrifice and the trader, the priest.
He does not trade.
He reproduces .
🏷 Let this post remain.
Let it be seen by those who have not yet broken.
Let it be found one year from now, five
when someone, seated in another world, on another timeframe,
suddenly stops… stares at the screen… and whispers:
“...1527.55.
I remember.
I waited.
I didn’t believe.
But it came.
And Lucifer was right.
Light always travels through shadow.
And MARA is its name.”
Timing 1H:
Timing 1D:
Timing 1M:
🏷 Mr. Bolzen The Architect.
Not seeking followers.
Only preserving memory.
To those who remember time is not the enemy.
It is the witness.
P.S.
Dear International Community,
English is not my native language. I hold deep respect for all of you, and I apologize for any stylistic imperfections.
Thank you for your attention.
Remember: everything has its time.
I am among the very few analysts in this world who see the chart beneath the skin — not the narrative painted for us.
Institutional capital does not trade on fundamentals — it paints pictures tailored to your RSI, MACD, and indicators, to make you believe you are in control.
There are boundaries I uphold — and will never cross.
You already receive information.
The institutional community must learn to use analysis of this caliber not as marketing, but as strategy.
The retail sector must understand: you must look beyond the leverage of capital — not merely into tomorrow.
Institutional capital defines the future — years ahead.
Over time, my maps come alive. Many already see it.
As the sovereign of the price sector and founder of the price slice — I will remove any contender from the ring when it comes to defining the future.
This is not a liquidity zone.
This is a converged price — the price the crowd pays.
Thank you.
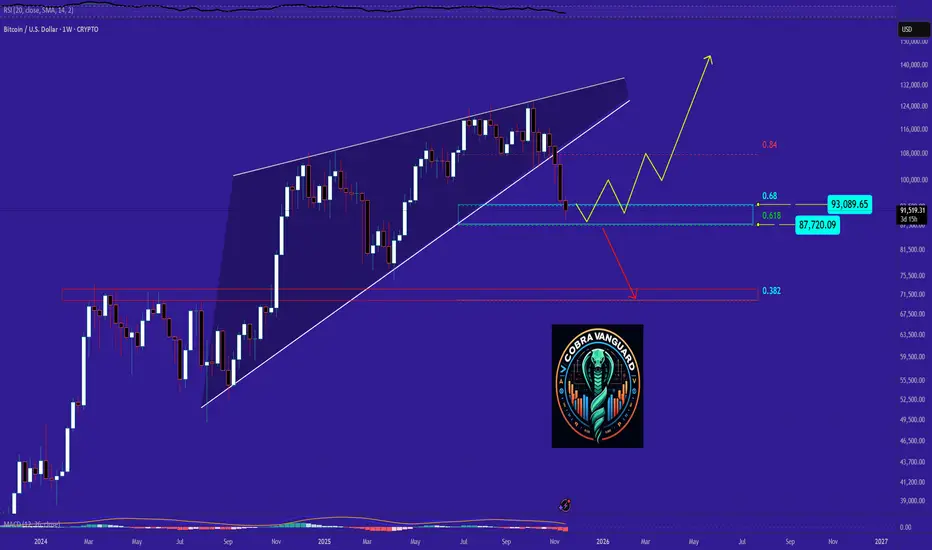
BTC/USDTPERP BinanceBTC/USDTPERP Binance
1D hollows
As we saw in a previous chart, since the price broke the support point of approximately $108,000, a price drop of 12.58% followed in a period of three days.
An uptrend diagonal line has formed on the chart.
The price should have stayed above this uptrend line.
So since it broke downwards, the price should then touch the support level as seen from $87,470 - $91,781.
The support area results as an extension of the Fibonacci retracement, to the exact point of the golden ratio, which is 0.618 and 0.666.
The price is expected to reach the support area and we will see a price rebound.
Crypto Market Cap: $3.26T +1.61%(24h)
Bitcoin Dominance
Bitcoin: 58.7% -0.15%
Ethereum: 11.9% -0.97%
Others: 29.4% +1.13%
Good Luck
#CryptoHellas Team
16/11/2025

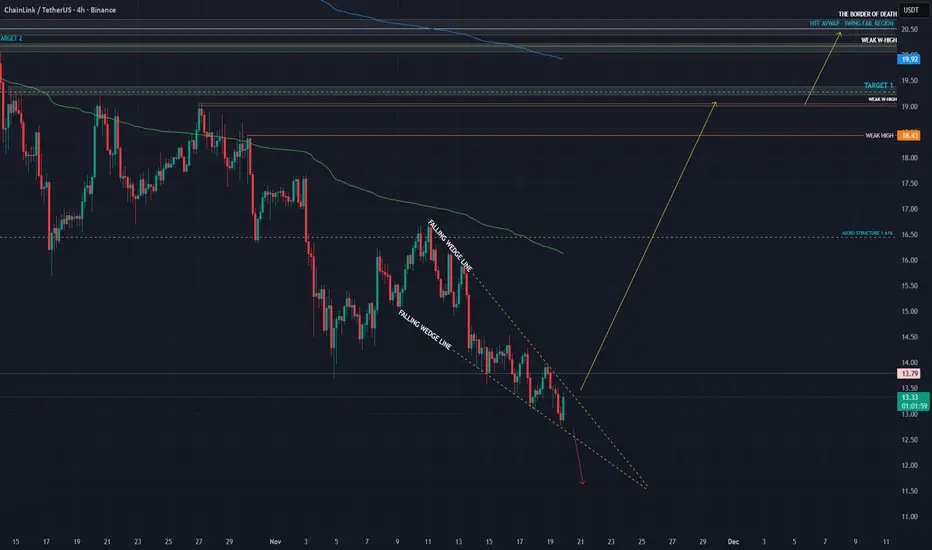
CHAINLINK - LOADING A SUPER SWEEP UP! - Traders,
In my last $CHAINLINK analysis
I wrote out two scenario’s.
Scenario 1 did not play out. Scenario 2 was simple: a dump into the next 1.618 extension, and from there the hunt for a fresh long setup begins. That 1.618 was at 12.90$
And here we are.
Pixel perfect.
So are we wrong? This is why having your levels outlined and being patient matters more than anything. When one path closes, structure reveals another. The chart always speaks.
But only those who wait can hear it.
What we are looking at
$CHAINLINK dumped straight into the 12 to 13 dollar zone.
This zone is not random. It is technically one of the most important pockets on the chart.
Let’s break down why.
Mathematical Levels – The Spot Chart
To avoid distortion caused by the 10 October liquidation wick, we start with clean mathematical levels on the spot chart.
At 12.886 we have the high timeframe 0.886 Fibonacci retracement. This is the deep retrace zone where momentum often shifts. Price tends to exhaust here because 0.886 represents the final Fibonacci rotation before structural invalidation. It is where the last sellers usually throw in everything they have.
At the same time, this level lines up with the 1.618 extension of the first structure after the 10 October crash. The initial high to low is marked with a yellow arrow in your chart.
This means one thing:
The downside auction has mathematically completed.
Both the retracement leg and the extension leg have landed in the same pocket.
This is real confluence.
The HTF AVWAP Confluence
Chart:
On 06 August 2024, LINK printed a new significant low.
This low kicked off a bullish wave with strong volume behind it.
That wave marked the beginning of a long uptrend, which means the AVWAP anchored to this low carries real weight.
Now here is the fascinating part:
The lower band of the anchored AVWAP aligns perfectly with:
The HTF 0.886 retracement
The 1.618 extension
The current price zone
The mathematical exhaustion pocket
This is not normal.
This is precision level confluence.
What this means
When AVWAP, Fibonacci, and wave extensions align, it signals that institutional cost basis, market memory, and auction math are all pointing to the same zone as fair value.
This is where smart money steps in.
Falling Wedge – The Technical Cherry
The final ingredient:
LINK has printed a clean, textbook falling wedge.
A falling wedge is a bullish reversal pattern where momentum compresses and the final sellers run out of strength. It represents exhaustion, not continuation.
Combine that with AVWAP, Fibonacci, and mathematical symmetry, and you have a powerful structural reversal setup.
Order Flow Confirmation
The order flow confirm the technical story:
Spot CVD has been trending down, but price is no longer following with the same intensity.
Stablecoin and coin margined CVDs are still pushing lower, but again, price is resisting the pressure.
Open Interest increased into the lows. New shorts opened into exhaustion.
Funding remains small and neutral.
Price is holding the key zone.
This is absorption. When shorts push and price refuses to break, the market is loading a spring.
Conclusion
The 12 to 13 dollar range is not random noise.
It is a high timeframe confluence zone made of:
The 0.886 Fibonacci retracement
The 1.618 extension completion
The lower AVWAP band from the August trend origin
A falling wedge structure
Order flow absorption
New shorts entering into weakness
LINK is setting up for a powerful sweep if this zone holds.
Targets.
$19.30
$20.50
$38.00 if we move higher.
Breaking out of the wedge pattern invalidates the idea.
--------
The chart is whispering again. Patience turns whispers into signals.
--------
If you like this kind of analysis, drop a like and leave a comment. Everything here is shared for free so more people can cut through the noise and finally see what is actually happening under the surface. No hopium. No fear. Just real data, real structure, and real order flow.
The goal is simple. To help traders stop guessing and start understanding what the market is actually saying.
Stay sharp.
Stay objective.
And remember… the chart whispers long before it speaks.
- ThetaNomad
The key is whether support can be found around 89294.25
Hello, fellow traders!
Follow us to get the latest information quickly.
Have a great day.
-------------------------------------
(BTCUSDT 1D chart)
This period of volatility is expected to last until November 22nd.
If the price fails to find support and rise near the M-Siganl indicator on the 1M chart after this period of volatility, it is likely to decline to the 69,000-73,499.86 level.
Therefore, the key question is whether it can find support and rise near the HA-Low indicator level of 89,294.25 on the 1D chart.
-
(1M chart)
It is showing a downward trend, failing to reach the Fibonacci ratio 2.618 (133,889.92), which was considered the target level.
However, if the price maintains above the 69,000.0-73,499.86 level, it is expected to maintain an upward trend in the long term.
-
(1W Chart)
If the price rises above the HA-High indicator, it is likely to form a stepwise uptrend.
Since a stepwise uptrend usually ends in a decline, this decline could be a sign of a bearish trend.
The M-Signal indicator on the 1M chart can be used as a benchmark for bullish and bearish trends.
Therefore, if the price remains below the M-Signal indicator on the 1M chart, it should be considered a bearish trend and a response should be considered.
However, considering the overall trend of BTC, the most important range is the 69,000-73,499.86 range. As long as it does not fall below this range, the price is expected to maintain an upward trend in the long term.
-
Thank you for reading to the end.
I wish you successful trading.
--------------------------------------------------
- This is an explanation of the big picture.
(3-year bull market, 1-year bear market pattern)
I will explain in more detail when the bear market begins.
------------------------------------------------------

BTCUSDT.P - November 20, 2025The chart shows a clear downtrend marked by descending highs and lows, with price currently heading near a key horizontal support around the 88,000 level. A descending trendline acts as overhead resistance, while the shaded area near 92,000 represents a notable resistance zone. Price action suggests two possible outcomes: a bearish breakdown below support could extend the decline toward 85,000, while a successful breakout above the trendline may trigger a reversal toward 92,000 resistance. Momentum currently favors the bears as the market retests support after sustained selling pressure.

BTC WARNING!⚠️ WARNING:
I’m giving this to you straight, no filter.
Bitcoin is now staring down a very real chance of not making a new high for up to 4 years, and historically that kind of setup has come with –80% drawdowns.
That would drop the total market cap to roughly $500 billion.
Social media makes it look like “everyone is buying,” but the truth is the world has run out of fresh Crypto Bros with Lambo fantasies willing to chase this thing at any price. The buyers are tapped out.
No sugarcoating it: GTFO & STFO.
And on a positive note —
THANK YOU for helping me hit 5,000 followers! 🙏🔥
Let’s keep going.
If you find value in the work:
👉 Boost
👉 Follow
👉 Leave a comment
Let’s push to 6,000 and keep building a community rooted in facts, not fairy tales.

BTC At Sub 80k? The Structure Says It’s PossibleBTC has followed one pattern for two years.
Every major pullback reset 33–34% before the next leg up.
Look at the last cycles:
• 2024 dropped 34% from January to December
• Oct 2024 → Jan 2025: new highs, then a 33% retrace across four months
• Apr 2025 → Oct 2025: price ran from 74k → 125k, then stalled
• Every breakout in this range ended with the same size correction
The structure didn’t change. The market behaved the same every time.
From the 125k top, BTC still has room to drop 10–15%.
If the cycle repeats, the retracement lands near 80k before the next push.
History doesn’t repeat perfectly, but BTC has been consistent with this pattern.
I’m watching the range. My shorts stay open.
