GUN Market Update📊 LSE:GUN Market Update
LSE:GUN trading around $0.02295 🟢
👉 Key level to watch for potential bounce and long entry 🚀
⚡ Momentum building — but wait for confirmation before entering.
⚡ Trade smarter, not hope 🔑
BTC-D

TradeCityPro | Bitcoin Daily Analysis #175👋 Welcome to TradeCity Pro!
Let’s move on to Bitcoin analysis. I haven’t posted an update for the past two days, but starting today, let’s get back to the market and see what’s ahead.
⌛️ 4-Hour Timeframe
The U.S. CPI and PPI data, two key inflation indicators, were released and came in favorably for the market. As a result, Bitcoin has moved toward 117,048.
💥 At the moment, most of the positions we’ve opened are in profit. Because of this, taking some profit could be a smart option, since Bitcoin might enter a corrective phase once it reaches the 117,048 level.
📈 For new entries, a clean breakout above 117,048 would be a valid trigger. However, the chance of breaking this zone on the first attempt is low, and there’s a strong possibility that price will wait for Powell’s upcoming speech before making its next decisive move.
📊 We can also use RSI’s move into the overbought zone as a momentum confirmation. If that happens, it could set off a powerful bullish leg to the upside.
❌ Disclaimer ❌
Trading futures is highly risky and dangerous. If you're not an expert, these triggers may not be suitable for you. You should first learn risk and capital management. You can also use the educational content from this channel.
Finally, these triggers reflect my personal opinions on price action, and the market may move completely against this analysis. So, do your own research before opening any position.

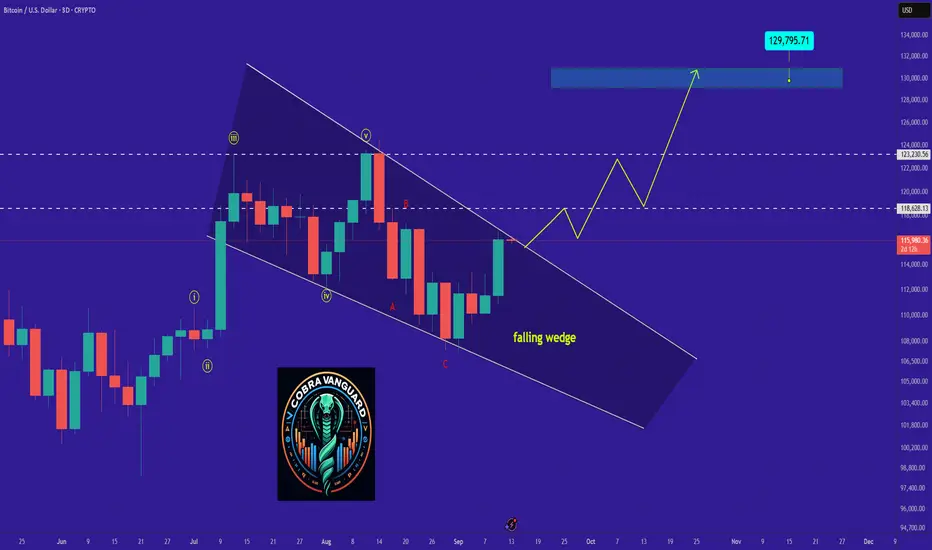
BTC is bullish now and many Traders don't see it !So if you pay attention to the BTC chart you can see that the price has formed a Ascending wedge which means it is expected to price move as equal as the measured price movement.( AB=CD )
NOTE: wait for break of the WEDGE .
Best regards CobraVanguard
AAVE Market Update📊 CRYPTOCAP:AAVE Market Update
CRYPTOCAP:AAVE trading around $303 💵
👉 If you want to enter or accumulate more, better to wait for retracement into green zone before long entry 🟢🚀
⚡ Trade smarter, not hope 🔑

BTCUSD: Consolidation will ContinueHello everyone, here is my breakdown of the current Bitcoin setup.
Market Analysis
From a broader perspective, the market for Bitcoin has shifted from a trending phase into a wide consolidation Range. This occurred after the price broke down from a prior Upward Wedge, signaling a pause in the bullish momentum and establishing the current boundaries between the 107700 Support and the 119000 Resistance.
Currently, the price has completed a full rotation from the bottom of this Range and is now approaching the major horizontal Resistance at the 119000 level. This is a historically significant area that has repeatedly capped rallies and acted as a strong barrier for buyers.
My Scenario & Strategy
I'm anticipating that the price will make a final push into the 119800 - 119000 Resistance Zone. The key signal I'm watching for is a clear rejection from this area, confirming that sellers are still in control at these prices and that another rotation downwards is likely.
Therefore, the strategy is to watch for this rejection at the top of the Range. A confirmed reversal would validate the short scenario. The primary target for this downward rotation is 111000 points, an intermediate level within the Range where a price reaction could be expected.
That's the setup I'm tracking. Thank you for your attention, and always manage your risk.

DOGE Long Idea - MemecoinDOGE Swing Long Idea
📊 Market Sentiment
Market sentiment remains strongly bullish as the FED is expected to deliver a 0.25% rate cut, with speculation building for a possible 0.5% cut in September. Monetary policy shifts are being driven by both inflation trends and weakening labor market data. The latest August and September job reports were soft, signaling that the economy is cooling rapidly. This environment continues to fuel expectations for a major bullish run in the weeks ahead.
📈 Technical Analysis
Price recently broke and closed above the bearish trendline with strong bullish candles, confirming the breakout.
This is a key technical shift that aligns with my previous outlook. (I mentioned this scenario in my last DOGE analysis — check the linked idea for more context.)
📌 Game Plan
I entered the trade at $0.24841 immediately after the breakout confirmation.
📋 Trade Management
Stoploss: $0.22900
Target: $0.28779
💬 Like, follow, and comment if you find this setup valuable!
⚠️ Disclaimer: This content is for informational and educational purposes only and does not constitute financial, investment, or trading advice. Always do your own research before making any financial decisions.

BTC – the $130K Roadmap!CRYPTOCAP:BTC is showing strong bullish structure both short-term and long-term 📈
After forming a clean inverse head & shoulders at support, price broke higher and is now trading within a rising channel.
🟢 Bullish short-term: As long as BTC holds above the $113,000 – $115,000 structure zone, buyers remain in control.
📊 Bullish long-term: Price continues to respect the major ascending channel, keeping the bigger picture bias to the upside.
🎯 Next target: If momentum continues, BTC could be on track toward the $130,000 resistance.
Patience here is key ⏳ — pullbacks into support could offer fresh continuation entries for the bulls 🐂.
⚠️ Disclaimer: This is not financial advice. Always do your own research and manage risk properly.
📚 Stick to your trading plan regarding entries, risk, and management.
Good luck!
All Strategies Are Good; If Managed Properly!
~Richard Nasr

New ATH in Short-Term?In this video, I have updated my previous daily chart #elliottwave counts on #BTC, #ETH, and #totalmarketcap, explaining why a new ATH is quite possible in the short-term.

bitcoin vs. ethereum 2017\2025Bitcoin and Ethereum literally mirrored 2017.
CRYPTOCAP:BTC to $200k \ CRYPTOCAP:ETH to $10k

Weekly Insights EUR/USD - BTC - AUD/NZD - NVDA - MSFTThe weekly video, I share my thoughts for the next week. Next week we have a highly important event which is the Federal Reserve interest rate decision. It will strongly affect the EUR/USD, S&P500, and BTC.
The common theme is that most of the assets are in the 5th Elliott wave.
Good luck to all of us.
Markets Titan

Is Btc STILL following this fractal?If Btc (on the 1 Day) is following this Eth (4 hr) fractal, then Btc may soon see a lower low.
I hope I'm wrong. But I am cautious for several reason, as also indicated in my other previously published charts.
Trade safe...

NASDAQ | H2 Double Top | GTradingMethodHello Traders! 👋
🧐 Market Overview:
CPI is out today — and it could be the spark the NASDAQ needs. Price is stalling at the previous all-time high, and that’s where I’m watching closely.
I’ve been tracking a double top on the daily for a while now, and today the H2 chart is starting to show the same structure. That kind of multi-timeframe alignment doesn’t happen often.
📊 Trade Plan:
I’ve entered a starter short on the daily structure. If the H2 confirms, I’ll scale in with a second position.
Risk/Reward:
Entry:
Stop Loss:
Take Profit 1 (50%):
Take Profit 2 (50%):
💡 GTradingMethod Tip:
Double tops work best when paired with other signals. In my system, I look for:
- RSI negative divergence
- Lower volume on the second top
- A confirmation candle close within my entry range
This reduces false signals and adds conviction.
🙏 Thanks for reading! Do you trade double tops?
📌 Disclaimer:
This is not financial advice. This content is to track my trading journey and for educational purposes only.

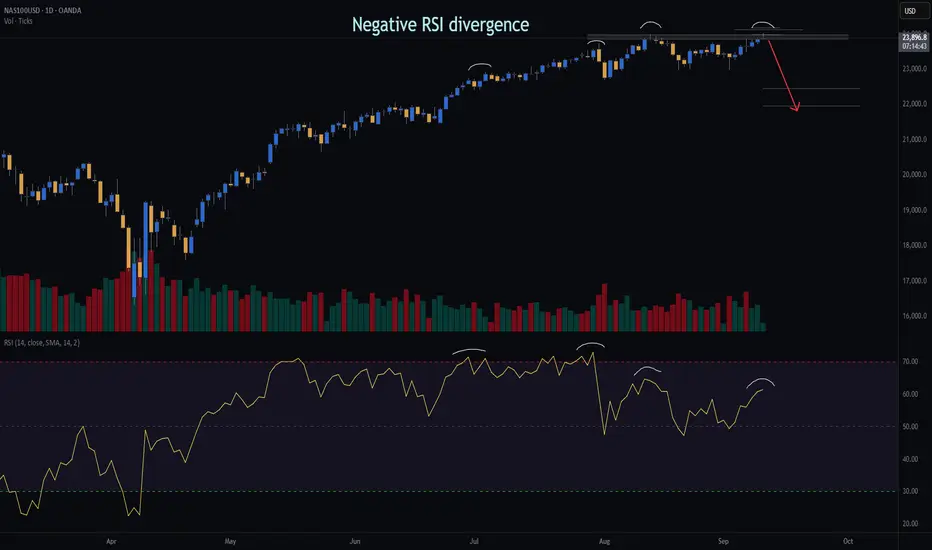
NASDAQ | Daily Double Top | GTradingMethodHello Traders 👋
🧐 Market Overview:
I’ve opened a short on the NASDAQ based on a clear double top setup that formed yesterday. Several of my key variables aligned, giving this trade a high-probability edge:
Negative RSI divergence → showing weakening buying momentum
Lower volume on the second top → indicating exhaustion
Daily candle closure within threshold → confirming structure validity
📊 Trade Plan:
RR: 9.1
Entry: 23 931
Stop Loss: 23 178
Take Profit 1 (50%): 22 453
Take Profit 2 (50%): 21 969
💡 GTradingMethod Tip:
When trading reversal patterns like double tops, I always wait for confirmation across multiple variables (momentum, volume, candle structure). This increases probability and reduces false entries.
🙏 Thanks for checking out my post!
Follow me for more setups and let me know — do you see this double top holding, or is there more upside left in the NASDAQ?
📌 Disclaimer:
This is not financial advice. This content is to track my trading journey and for educational purposes only.
$BTC – Immediate Support BINANCE:BTCUSDT | 6h
The CME gap at 116.8k has now been filled, with price stalling at 115k
At the moment, the key area I’m watching is 114k. If we can find support and bounce here, there’s room for price to make another leg higher. The first target would be a retest of 116k, but momentum could extend toward 117.3k. That 117.5k level has been the major line in the sand for some time — it’s the level that needs to be reclaimed in order to shift market structure away from the current bearish bias.
On the flip side, if price pushes into the 116–117k zone and gets rejected again, I’d like to see 112k hold firm. A solid base at 112k would provide a higher-low structure and set the stage for continuation to the upside. Losing 112k would open the door for a retracement back to 109k.

Bitcoin (BTC/USD) – Key Resistance Test AheadBTC is approaching resistance around 117,200 – 117,600 after a strong rally. A rejection from this zone may trigger a pullback into the 114,000 demand area before continuation higher.
🔑 Key Levels:
Resistance: 117,200 – 117,600
Support: 114,000 zone
Upside target: New highs if 117,600 breaks
⚠️ This is technical analysis, not financial advice. Always manage your risk accordingly.

Bitcoin will reach resistance line of channel and then dropHello traders, I want share with you my opinion about Bitcoin. The current market structure for Bitcoin is defined by a well-established upward channel that was formed after the price broke out of a prior triangle consolidation. This bullish pattern has been guiding the price action of BTC higher through a clear sequence of higher highs and higher lows between its dynamic support and resistance lines. The market has just completed another full upward rotation within this structure and is now positioned at a critical inflection point. Currently, the price is directly testing the upper boundary of the channel, which forms a powerful confluence of resistance with the horizontal 113500 - 114000 seller zone. This area has historically been a strong barrier where price has reversed on previous occasions. The primary working hypothesis is a short, rotational scenario, based on the expectation that sellers will once again defend this significant resistance confluence. A confirmed rejection from this seller zone would validate the integrity of the upward channel and likely initiate a new corrective swing to the downside, which would first need to break the current support level at 113500. Therefore, the TP is logically placed at 112400 points, a target that aligns perfectly with the ascending support line of the channel. Please share this idea with your friends and click Boost 🚀

EIGEN SHORT TERM be careful for trigger if it not triggered do not enter cause here is a bit critical under that line we may see a bearis movement Above white support eigen still chance to rise but my main target feels like a bit far so you may want to close some at tp 1
Always manage your own risks this is not a investment advise I am not responsible neither your loss nor profit.

BITCOIN PREDICTION: NEXT MASSIVE MOVE TO HERE - INCOMING!!!!!!!Yello Paradisers! In this video, we have been going through multi-time frame analysis as professional traders using Elliott Wave Theory and other advanced technical indicators and analysis techniques.
On the ultra-high time frame, we have been going through the Elliott Wave price section since 2023. We have taken a look at the Moving Average Trendline Touch, which worked perfectly, the Channel Retest that is incoming, and the Bearish Divergence with Bearish Cross.
On medium and high timeframe charts, I have been sharing with you the completed zigzag and first wave. We are currently in the secondary wave, waiting for it to finish, along with resistances and bullish and bearish divergences.Together with that, there are shooting star patterns, and on a low timeframe, I have been sharing with you the triple top reclaim and the next possible resistances, and what the next resistance and target are from a multiple timeframe perspective.
Paradisers! Keep in mind to trade only with a proper professional trading strategy. Wait for confirmations. Play with tactics. This is the only way you can be long-term profitable.
Remember, don’t trade without confirmations. Wait for them before creating a trade. Be disciplined, patient, and emotionally controlled. Only trade the highest probability setups with the greatest risk to reward ratio. This will ensure that you become a long-term profitable professional trader.
Don't be a gambler. Don't try to get rich quick. Make sure that your trading is professionally based on proper strategies and trade tactics.

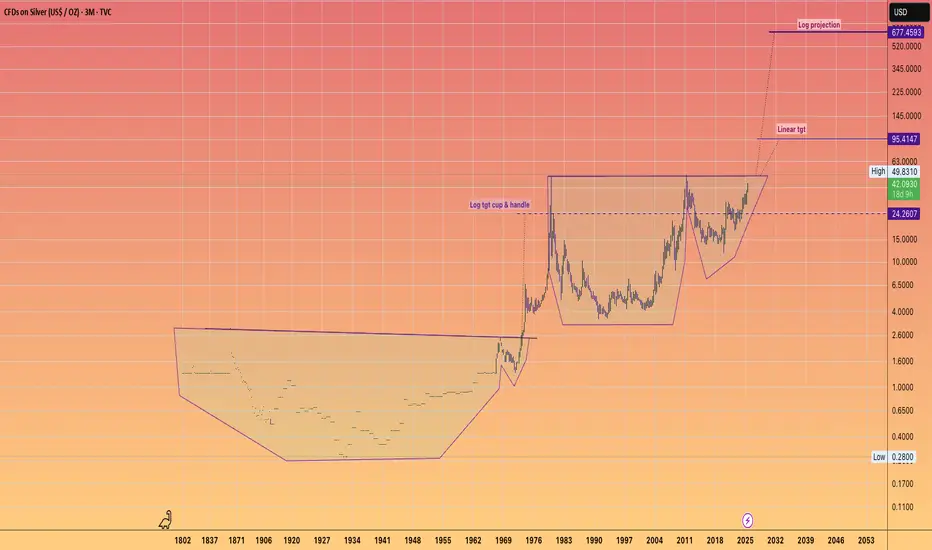
SILVER Accelerating to $95This is the full history of Silver.
With it's two GIANT Cup & Handle Patterns.
Big Patterns = Big Moves !!!
I find myself uncertain about the kind of world we would inhabit if Silver were to achieve the LOG projections in a chaotic disorderly manner.
We are undoubtedly stepping into a period of significant transformation across various sectors for global society in the coming decade or two.
Finance. Governance, Technology—let's seize the moment and take full advantage of the incredible opportunities available to us.
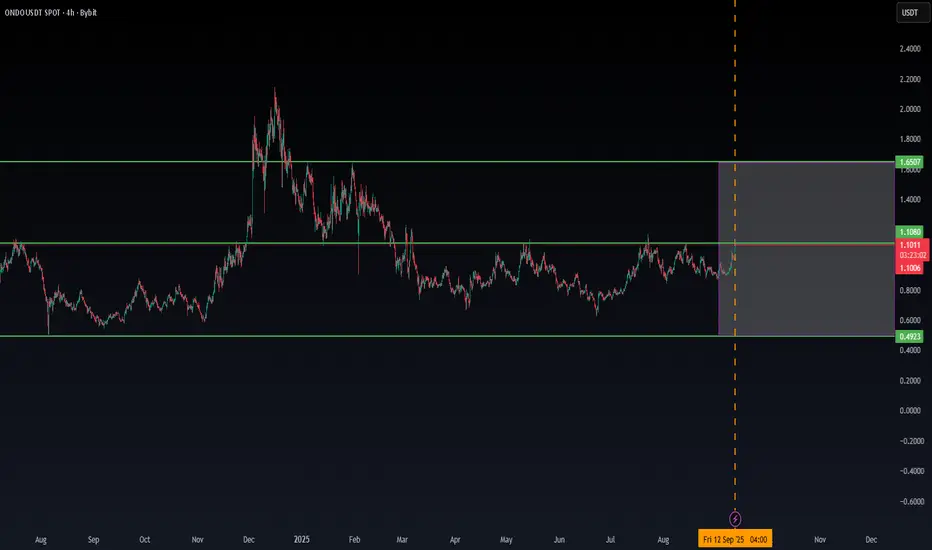
ONDO/USDT NEW INCREASE VOLUME💎Last data show that ONDO has the chance to break in the coming time on the low time frame.
We will follow up on this reason, ONDO to check for confirmations.
PPI Shock Pushes Bitcoin Higher – Fake Pump Before Drop?Bitcoin ( BINANCE:BTCUSDT ) has been making high momentum Sharpe moves over the last few days , which has made it a little difficult to trade, which is why I am still sticking to my previous analysis , and this analysis is an update of targets and even new entry points .
Bitcoin is currently moving near the Resistance zone($114,720-$113,580) , Reversal Zone(PRZ) , Cumulative Short Liquidation Leverage($114,510-$113,771) , Monthly Pivot Point , and Resistance lines = a set of Resistances
A few minutes ago, the US Core PPI m/m and PPI m/m data were released, which triggered a pump in Bitcoin . In my view, we should wait for Bitcoin to digest this shock and then continue its real trend .
Do you agree with me?
In terms of Elliott Wave theory , it seems that Bitcoin has completed microwave 5 of microwave C of the main wave Y , and we can expect a downtrend .
I expect Bitcoin to drop again to at least $111,600(First Target) .
Second Target: $110,883
Third Target: $110,000 and more dumps.
Stop Loss(SL): $114,923(Worst)
CME Gap: $117,235-$113,800
Cumulative Long Liquidation Leverage: $110,822-$109,752
Note: Be sure to follow capital management and do not take risks.
Please respect each other's ideas and express them politely if you agree or disagree.
Bitcoin Analysis (BTCUSDT), 1-hour time frame.
Be sure to follow the updated ideas.
Do not forget to put a Stop loss for your positions (For every position you want to open).
Please follow your strategy and updates; this is just my Idea, and I will gladly see your ideas in this post.
Please do not forget the ✅' like '✅ button 🙏😊 & Share it with your friends; thanks, and Trade safe.

$BTC The Correction is OVER - IH&S 50DMA Reclaim.VERY CONFIDENT THE ₿ITCOIN CORRECTION IS OVER 🤓
In other words, WE'VE SEEN THE SEPTEMBER LOWS.
Inverse Head & Shoulders reversal pattern closed outside of the Danger Zone and CRYPTOCAP:BTC reclaimed the 50DMA.

Bullish momentum to extend?The Bitcoin (BTC/USD) has bounced off the pivot which has been identified as a pullback support, and could rise to the 61.8% Fibonacci resistance.
Pivot: 113,062.07
1st Support: 110,869.14
1st Resistance: 118,296.79
Disclaimer:
The above opinions given constitute general market commentary, and do not constitute the opinion or advice of IC Markets or any form of personal or investment advice.
Any opinions, news, research, analyses, prices, other information, or links to third-party sites contained on this website are provided on an "as-is" basis, are intended only to be informative, is not an advice nor a recommendation, nor research, or a record of our trading prices, or an offer of, or solicitation for a transaction in any financial instrument and thus should not be treated as such. The information provided does not involve any specific investment objectives, financial situation and needs of any specific person who may receive it. Please be aware, that past performance is not a reliable indicator of future performance and/or results. Past Performance or Forward-looking scenarios based upon the reasonable beliefs of the third-party provider are not a guarantee of future performance. Actual results may differ materially from those anticipated in forward-looking or past performance statements. IC Markets makes no representation or warranty and assumes no liability as to the accuracy or completeness of the information provided, nor any loss arising from any investment based on a recommendation, forecast or any information supplied by any third-party.
