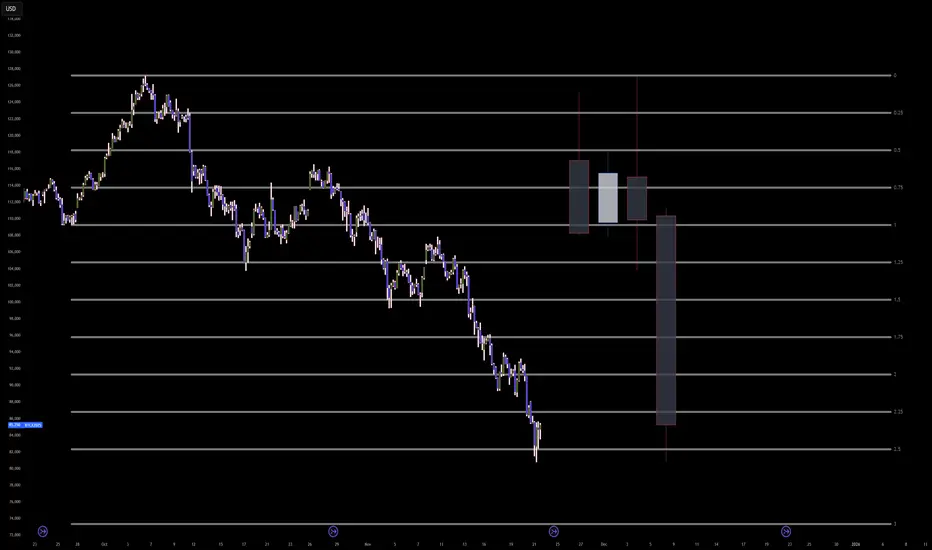
BTC = Bout To Collapse
I'm not trading bitcoin, but I trade the highly correlated stock Microstrategy. This is a pristine setup before the Asian session punishes Bitcoin for that faux breakout we saw into market close.
The downtrend on the daily chart is the dominant trend on BTC right now, and cracked the whip anytime Bitcoin even thought about crossing that downtrend.
BTC hit massive daily resistance.
Asia rarely breaks resistance overnight.
Max pain favors a move DOWN, not up.
Dealers are short gamma into the strike zone you’re playing.
Your deltas (–0.41) will explode to –0.55 to –0.70 on a gap-down.
IV crushed today → will expand tomorrow morning, benefiting you.
MSTR ALWAYS overreacts to BTC.
Strong Open Interest build at 185, 180 and 175 - temporarily OTM ;)
Max pain sits well below current price on MSTR of $186 at $175
Market Makers hedge delta, not max pain
The largest Open Interest of call options sit at $190.
My prediction for Bitcoin and MSTR for 12/5:
BTC opens below 91,400 and MSTR opens below $183
Under $183, Market Makers hedge mildly bearish
Under $181, MM's hedge strongly bearish (accelerating fall similar to what we saw today around 2-2:45pm)
Under $179, Gamma Squeeze in control - move down accelerates
Under $177, MMs forced to short to $175 (current max pain level)
Under $175, Max pain magnet realized. If we hit $175 - expect price to be pinned by MMs.
Options are pricing in a big downward movement for the overnight session pointing at a 65-70% likelihood of a big selloff.
BTC-D

BTC 4H Chart Review1. Market Structure: Rising Channel (Upward Wedge / Rising Channel)
The chart clearly shows that BTC is moving within an ascending channel, with:
the upper boundary around USD 95,000–95,500,
the lower boundary currently reaching USD 86,500–87,000.
This is a potentially exhausting formation, and lower breakouts are often dynamic.
2. Current Situation: Rebound from the upper band and Stoch RSI overbought → decline
The price has stopped exactly at the upper resistance of the channel and has begun a correction.
This is typical behavior – the market usually returns to the middle or lower edge of the channel.
Stoch RSI on 4H – has made a strong reversal from the overbought zone
→ a signal for a short-term correction has already been generated.
3. Support Levels (most important):
🔴 USD 90,500–90,000
A very important zone – previous resistance ⇒ now support.
Breakout = increased risk of a deeper breakout.
🔴 USD 88,500–88,000
A strong demand level for the 4-hour period, also aligned with the MA and local lows.
🔴 USD 86,500–87,000
The lower band of the channel – the most likely place for buyers to become active.
4. Resistance Levels:
🟢 USD 94,800
Previous local high – a breakout will be bullish.
🟢 USD 98,000–98,900
Strong resistance on the chart, likely target after a breakout of the channel to the upside.
5. Scenarios for the coming hours:
📉 Correction scenario (more likely based on the Stoch RSI)
The price could fall to one of the following zones:
92,000 → test in progress
90,500–90,000 USD → main market decision level
If it loses 90,000 → a move to 88,500–88,000 is natural.
Deeper correction: test of the lower channel line – ~86,500 USD.
In this scenario, we remain in an uptrend unless the channel breaks below.
📈 Uptrend scenario
The current decline could only be:
a local correction,
a retest of the previous demand zone.
Uptrend condition:
➡️ 4-hour candlestick retracement and close above ~94,000 USD.
Then the target:
94,800
95,500
and after the channel breakout → $98,000–$99,000

ETHEREUM → The emergence of a positive driver?BINANCE:ETHUSDT is soaring amid a news rally and testing resistance at 3230. The daily increase was almost 20%. If growth is expected, then after a slight correction...
Fundamental background: the market reacted to rumors of the replacement of the Fed chairman with Kevin Hassett, who is more “dovish” and loyal to cryptocurrencies. The market broke the local structure and updated the interim maximum from 3070 to 3230. A false breakout of resistance is forming relative to the key resistance level, and the market is entering a correction/stagnation phase.
Bitcoin, the main driver of the cryptocurrency market, faced strong resistance at 95K. The global market trend is downward, and a change in trend will require time and more confirmation...
There is a struggle for resistance in the market, and several scenarios are possible: consolidation and a breakout of resistance, or growth after correction...
Resistance levels: 3230, 3370
Support levels: 3172 (local), 3057
High probability: a false breakout of 3230 will trigger a correction to 3050 (before the news). If the bulls keep the price above 3050, growth may continue as part of the change in the fundamental background.
BUT! If buyers keep the price without correction, then the focus will be on 3230. Consolidation above this level could trigger growth to 3370 - 3620.
Best regards, R. Linda!

BTCUSD | Waiting for breakbitcoin got rejected from the red zone a few days ago. Posted that idea a while ago.
Since then it has come back and struggled a bit to break through.
If btc where to break the bottom blue line you see on the chart. I would be confident we are going to see lower prices fast.
Let me know what your analysis and outlook is for bitcoin!
Stay safe out there and do your own due diligence, this is not investment advise!

Bitcoin Pumps +10% — Bull Trap or Trend Reversal?Bitcoin( BINANCE:BTCUSDT ) has experienced over a +10% increase in the past two days, which came as a surprise to many analysts considering the previous bearish momentum. In other words, Bitcoin is on something of a roller coaster lately😂.
The question now is whether Bitcoin has started a new bullish trend or if it’s likely to see another decline.
Let’s dive into the 4-hour chart of Bitcoin. Currently, Bitcoin is approaching a resistance zone($94,850-$93,000), a Cumulative Short Liquidation Leverage($94,710-$94,063), and the monthly pivot point. This cluster of resistances, combined with the recent upward momentum, might make it challenging for Bitcoin to break through.
It’s also worth noting that the trading volume during this recent rally hasn’t been particularly high, so Bitcoin could still surprise us. This recent behavior shows that Bitcoin can move sharply both up and down, so it’s crucial to maintain proper risk management.
From an Elliott Wave perspective, considering Bitcoin’s recent decline, I initially expected that Bitcoin might at least test the low of its main wave 3 again. However, the recent rebound suggests that the main wave 5 may be truncated, and the corrective waves could still push Bitcoin lower, potentially even below $75,000.
From a classical technical analysis perspective, Bitcoin might be forming a bearish flag pattern, with the ascending channel acting as the flag’s pole.
In addition, the USDT.D%( CRYPTOCAP:USDT.D ) is still on an upward trend, which indicates that the cryptocurrency market might still face downward pressure.
Moreover, geopolitical tensions, such as those between the U.S. and Venezuela, could also act as a trigger for further Bitcoin declines if they escalate.
Lastly, the S&P 500 index( SP:SPX ), despite its recent bullish trend, doesn’t show the same positive correlation with Bitcoin. In fact, a decline in the S&P 500 could amplify Bitcoin’s downward movement.
Considering all these factors, I expect Bitcoin to continue its bearish trend and potentially test the heavy support zone. If these support levels break, we could see even more significant declines in the crypto market.
Based on the above explanation, I expect Bitcoin to have at least a correction to the targets I specified on the chart, and then depending on the momentum, we can expect a continuation of the decline or a resurgence.
Note: In general, with the opening of the US markets, financial market movements have become more intense these days than before, and it is better to be prepared for any scenario at that time.
What do you think? Do you believe Bitcoin will dip below $75,000, or will it bounce back?
Cumulative Short Liquidation Leverage: $98,591-$96,688
Cumulative Long Liquidation Leverage: $91,860-$90,960
Stop Loss(SL): $96,200
Points may shift as the market evolves
💡 Please respect each other's opinions and express agreement or disagreement politely.
📌Bitcoin Analysis (BTCUSDT), 4-hour time frame.
🛑 Always set a Stop Loss(SL) for every position you open.
✅ This is just my idea; I’d love to see your thoughts too!
🔥 If you find it helpful, please BOOST this post and share it with your friends.

BTC Short Running with 1:3RRBTC Short Running with 1:3RR
Loving this BTC Short so far. Actual target is around 74-75K.

TradeCityPro | Bitcoin Daily Analysis #240👋 Welcome to TradeCity Pro!
Let’s move on to today’s Bitcoin analysis. The market has started its correction phase today.
⏳ 1-Hour Timeframe
Yesterday, Bitcoin had a very strong bullish momentum and reached the 93,609 level.
✨ Breaking this level could have continued Bitcoin’s upward movement, but the price failed to break through and faked it, starting a correction instead.
💥 The RSI oscillator, as I mentioned before, was showing strong bullish momentum while above the 50 level. However, with the break of this level, the bullish momentum faded, and Bitcoin entered a deeper correction.
📊 During this correction, volume has decreased significantly, and the price has corrected down to 91,974.
The reaction of the price to this level is very important.
⚡️ If the price is supported at 91,974, the likelihood of breaking the resistance increases, and the price could break through this level in future attempts.
💫 However, if the price breaks 91,974 and volume increases, Bitcoin could see deeper corrections, potentially moving to 90,421 or even 88,082.
✔️ For now, I’m only looking for long positions and will open a long position if 93,609 is broken.
⭐ However, I won’t open a short position if 91,974 breaks; I’ll wait for more bearish momentum to enter the market before considering a short.
❌ Disclaimer ❌
Trading futures is highly risky and dangerous. If you're not an expert, these triggers may not be suitable for you. You should first learn risk and capital management. You can also use the educational content from this channel.
Finally, these triggers reflect my personal opinions on price action, and the market may move completely against this analysis. So, do your own research before opening any position.

$INJ – Extremely Oversold at Key Support | Long Setup PotentialInjective CRYPTOCAP:INJ is trading at an extremely oversold level, sitting directly on major horizontal support that has historically triggered strong bullish reversals. The current zone could offer a high-risk, high-reward opportunity for a long spot position.
🟢 Trade Setup
Entry Zone: $5.50 – $6.00
Targets (TP):
• TP1: $7.00 – $8.00
• TP2: $10.25 – $12.00
• TP3: $14.00 – $16.00
Stop Loss: $5.00

LINKUSDT – Pullback Opportunity Before Next Leg Up?Chainlink (LINK) has rallied strongly but is now testing resistance, where price action could stall short-term. We're watching for a healthy pullback to reload for the next bullish wave.
🔹 Entry Zone: $12.50 – $13.50
🔹 Take Profit Levels:
• TP1: $15.50 – $16.50
• TP2: $19.00 – $21.00
• TP3: $25.00 – $28.00
🔹 Stop Loss: $11.90
Key Idea: A rejection at current resistance could offer a better long entry. If price dips into the $12.50–$13.50 zone and shows strength, it may kick off the next upward move.
📌 Watching for bullish confirmation in that range. Chart structure still favors upside as long as $11.90 holds.

EDENUSDT Glory WeekEDEN tapped into raw momentum, ripping upward before cooling off into a smooth pullback. The structure still favors the bulls, and support is holding strong.
If EDEN catches fresh volume, a sharp rebound toward previous highs isn’t far. This chart looks like it wants another run.

BTC CME Futures: The Capitulation Buy SetupSimply:
The logic here is simple.
Bitcoin has dropped too far and too fast.
We are currently hitting a major mathematical exhaustion point (the 2.5 Standard Deviation line).
At the same time, we are entering that big blue support box between 78k and 82k where the massive rally started earlier this year.
This is not a crash anymore; it is a bear trap.
Retail traders are panic selling right at the bottom, which provides the liquidity for big players to buy.
We are setting a limit order to catch the final wick down before the bounce.
Entry: 81,250 (Buy Limit)
Stop Loss: 77,500 (If it goes below here, the setup is wrong)
Target: 94,000 (The bounce back to equilibrium)
Don't chase the red candles.
Let the price come to you, fill the order, and wait for the squeeze.
____
Advanced:
The algorithm is currently executing a terminal volatility expansion into the 2.5 Standard Deviation extremity to finalize the Macro Sell Model and engineer a generational Smart Money Reversal.
The present liquidation cascade is not a crash but a precise, mathematically ordained delivery of price into the deep discount 'Blue Box' accumulation array to harvest the final sell-side liquidity before the grand repricing event.
Entry: 81,250.00 (Limit Order - 4,000 points below market)
Stop loss: 77,500.00 (3,750 points)
Take profit: 94,000.00 (12,750 points)
Risk to reward ratio: 3.40R
The Opportunity
The Bitcoin algorithm has been running a high-velocity sell program from the 126,000.00 highs, systematically dismantling every bullish PD Array.
However, we have now breached the Event Horizon. The price is magnetically drawn to the confluence of the 2.5 Standard Deviation projection and the historical Accumulation Block (78k-82k) originating from the early 2025 impulse.
This zone represents the 'Algorithmic Floor'—a region of maximum discount where institutional order flow must pivot from distribution to accumulation to close massive short positions and defend the macro bull trend.
The Entry
Do not chase the current candle. The algorithm demands a touch of the 2.5 Standard Deviation level at approximately 80,800.00 - 81,200.00 to complete the fractal expansion.
We place our limit order at 81,250.00 to front-run the absolute mathematical bottom, capitalizing on the 'Capitulation Wick' that will clear the final trailing stops.
This entry is timed for the CME close/open gap or the weekend volatility injection, which often targets these extreme deviation levels to trap late bears before a violent Monday reversal.
The Invalidation
The reversal thesis is ontologically corrupted if price displaces below the 3.0 Standard Deviation level and the bottom of the accumulation block at 74,000.00.
A sustained closure below this level signifies a total failure of the macro structure and a transition into a secular bear market, invalidating the accumulation narrative.
This would shift the probability manifold to the Primary Antithetical Chain, targeting the 60,000.00 liquidity void.
Key Trajectory Waypoints
Target 1: 86,000.00 | Type: Immediate Rebalance (2.25 SD) | Probability: 90% | ETA: 24 Hours
Target 2: 90,500.00 | Type: Internal Bearish Breaker | Probability: 75% | ETA: 3-5 Days
Target 3: 94,000.00 | Type: Equilibrium / FVG Fill | Probability: 60% | ETA: 1-2 Weeks
The Shadow Reality
A 25% probability exists for the antithetical reality: The Abyss Cascade.
In this scenario, the 2.5 SD level fails to provide a reaction, and the algorithm enters a 'Free Fall' discovery mode targeting the 3.0 SD at 74,000.00 immediately.
This reality is confirmed if price slices through 80,000.00 with no wick response.
___
tags: BITSTAMP:BTCUSD COINBASE:BTCUSD INDEX:BTCUSD BINANCE:BTCUSD
BITCOIN Mayer Multiple shows the way to the Bear Cycle bottom.Bitcoin (BTCUSD) remains on a short-term rebound, as mentioned before, a standard counter-trend/ dead cat bounce during Bear Cycles.
Here you see the Mayer Multiple Bands (MMB), an indicator we've used countless times to determine tops, bottoms and general trends of a Cycle. This time we plot this simple yet powerful tool to make an early estimate on the potential bottom of this Bear Cycle.
We will keep this short as there is no reason to overcomplicate things, especially at this stage. BTC is as we said on a small rebound currently after almost testing the 2SD below (blue trend-line) of the MMB. On all previous Bear Cycles show on this chart, every time this happened, the market bounced and consolidated then.
When the 2SD below trend-line broke, the market reached the 3SD below (green trend-line) rather aggressively and quickly. In all instances, that was the Bear Cycle bottom, with the only exception being the 2022 Bear Cycle, which gave one last short-term rebound/ consolidation and bottomed when it broke below the 1W MA300 (red trend-line).
The 1W MA300 has historically had a hidden but key role on BTC Cycles. When tested, always after the initial MMB bottom, it provided a 2nd and final opportunity to enter (buy) the new Bull Cycle at such a low price.
It is possible to see something like that happen again. With its course (1W MA300), assuming the current Bear Cycle also lasts for around 52 weeks (364 days) like the previous two, we estimate it to be a little under $60000 by October 2026. The MMB 3SD below though could be by that time around $40000. It is possible of course that we breach the 1W MA300 (much) earlier thus at a lower price, meaning also potentially hitting the MMB bottom a little higher.
In any case the bottom range seems roughly by $60k - $40k. Since determining the Cycles (hence Tops - exits, Lows - entries) has always been more about timing and less about pricing, this is why we've discussed before that it would be a good idea to start buying (call it DCA if it suits you better) around $60k. As always, however, these are just the facts. The decision is yours.
So at what price do you think this Cycle will bottom? Feel free to let us know in the comments section below!
---
** Please LIKE 👍, FOLLOW ✅, SHARE 🙌 and COMMENT ✍ if you enjoy this idea! Also share your ideas and charts in the comments section below! This is best way to keep it relevant, support us, keep the content here free and allow the idea to reach as many people as possible. **
---
💸💸💸💸💸💸
👇 👇 👇 👇 👇 👇

Bitcoin new update (1D)Bitcoin has not yet fully absorbed the buy orders in the marked support zone. This time, upon tapping the support area again, we can expect the price to form a stronger bullish move, at least toward the identified supply zone.
A daily candle closing below the invalidation level will invalidate this outlook.
Do not enter the position without capital management and stop setting
Comment if you have any questions
thank you
Bitcoin Analysis (4H)Bitcoin is in a bearish phase. It appears that Wave C of the bearish phase has transformed into a dimaetric.
The price is expected to bounce back from the green zone toward the upside, and then we may see the main rejection from the red box. The bullish wave we are expecting for Bitcoin corresponds to Wave D.
Let’s see whether a double bottom forms to support the price upward or not.
A daily candle close below the invalidation level will invalidate the bullish Wave D.
For risk management, please don't forget stop loss and capital management
When we reach the first target, save some profit and then change the stop to entry
Comment if you have any questions
Thank You

BTC 90K SEEMS INTERESTING FOR ENTRYMorning folks,
So, once our bearish trade was over, market turns to AB=CD upside shape, that we intend to follow. 97K is rather strong resistance, so we consider 96.5K as the nearest upside target. BTC shows nice acceleration, so, it has not bad chances to proceed.
For entry we intend to use reverse H&S shape on 1H chart. 90K area looks interesting now for potential long entry...
NO BUYS BEFORE PRICE GO BELOW 80,500$Before any buy of CRYPTOCAP:BTC I'm awaiting that price will go lower 80,522$ after that need to wait and watch reaction OR ATH and again watch reaction

BTC Approaching Key Resistance After Trendline SupportBitcoin continues to respect the rising trendline while gradually approaching a clearly defined resistance zone. Price structure suggests a possible pause or reaction in this area.
A clean break and sustained hold above the marked level could open space for further upside, while rejection may lead to a corrective move toward lower support areas.
Market direction will become clearer after a decisive reaction at resistance.

BTC at a Crossroad: Head & Shoulders or Moonshot? Analyzing the CME Bitcoin Futures chart, we can clearly see confirmation of the price gap between $92K and $94K, which significantly increases the probability of a Head & Shoulders (H&S) formation.
✅ Key Scenarios to Watch
Scenario 1 – H&S Confirmed:
Potential retracement toward $52K–$62K based on the right shoulder's depth
Scenario 2 – Failure H&S Confirmed:
Bullish breakout could push BTC toward $140K–$150K. based on the right shoulder's depth
🔍 Technical Insight
The left shoulde r formed near the Fibonacci 0.618 / 0.382 leve ls. Based on these Fib zones, the right shoulder could develop within a similar range—critical for validating the pattern if weekly closure occurs over 94K .
Disclaimer: This analysis is for educational purposes only and does not constitute financial advice. Always do your own research and manage risk appropriately before making any trading decisions.

BTCUSD H4 | Bullish Bounce Off Pullback SupportMomentum: Bearish
The price is reacting off the buy entry, which is acting as pullback support.
Buy Entry: 92,439.84
Pullback support
Stop Loss: 89,010.49
Pullback support
50% Fibonacci retracement
Take Profit: 98,827.85
Pullback resistance
50% Fibonacci retracement
High Risk Investment Warning
Stratos Markets Limited (tradu.com ), Stratos Europe Ltd (tradu.com ):
CFDs are complex instruments and come with a high risk of losing money rapidly due to leverage. 70% of retail investor accounts lose money when trading CFDs with this provider. You should consider whether you understand how CFDs work and whether you can afford to take the high risk of losing your money.
Stratos Global LLC (tradu.com ): Losses can exceed deposits.
Please be advised that the information presented on TradingView is provided to Tradu (‘Company’, ‘we’) by a third-party provider (‘TFA Global Pte Ltd’). Please be reminded that you are solely responsible for the trading decisions on your account. Any information and/or content is intended entirely for research, educational and informational purposes only and does not constitute investment or consultation advice or investment strategy. The information is not tailored to the investment needs of any specific person and therefore does not involve a consideration of any of the investment objectives, financial situation or needs of any viewer that may receive it. Past performance is not a reliable indicator of future results. Actual results may differ materially from those anticipated in forward-looking or past performance statements. We assume no liability as to the accuracy or completeness of any of the information and/or content provided herein and the Company cannot be held responsible for any omission, mistake nor for any loss or damage including without limitation to any loss of profit which may arise from reliance on any information supplied by TFA Global Pte Ltd.

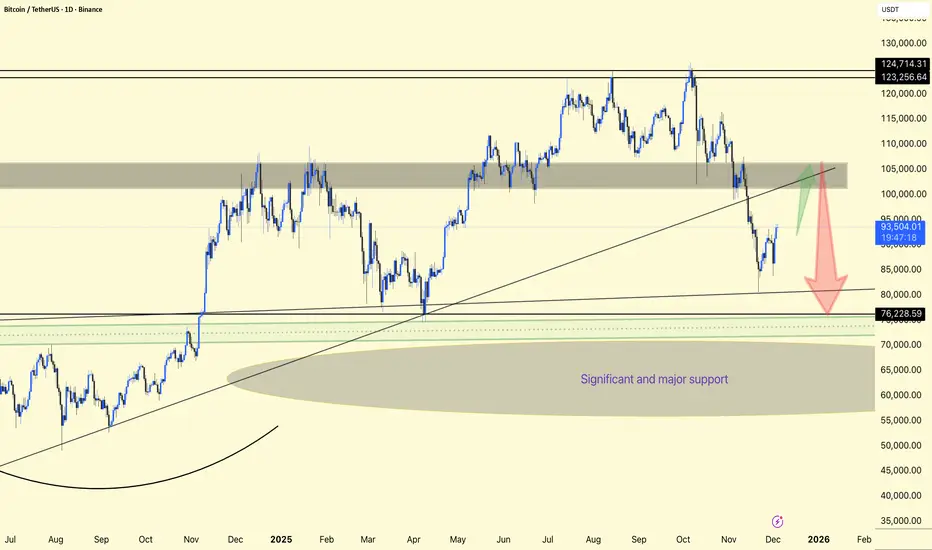
BTC/USDT 1DAY CHART ANALYSIS. Bitcoin (BTCUSDT) is in a corrective phase within a larger bullish structure, currently bouncing off support and heading back towards a large supply zone around 102,000–106,000 USDT.
The price was previously rejected from the top resistance band of 123,000–125,000 and sold off sharply, breaking mid-range support and retesting the long-term rising trendline and horizontal support around 80,000–82,000 as a key demand area.
The chart highlights a large “critical and key support” zone from around the mid-60,000s to the low-80,000s, where multiple higher-timeframe supports and rounded bases converge, making this a key zone.
After marking support, BTC has begun a relief rally towards the broken trendline and gray resistance band near 100,000–105,000; this area could serve as a decision point where either a downward continuation or a resumption of the trend is likely.
Bull Case: A strong daily close above the gray zone and reclaimed trendline would signal continuation towards 115,000 and potentially a retest of the 123,000–125,000 highs.
Bear Case: A break below 90,000 following rejection from this resistance will likely trigger another leg down towards 80,000–82,000 and, if that fails, another deep sweep into the “Significant and Major Support” region around 60,000 before a larger accumulation base can form.
DYOR | NFA
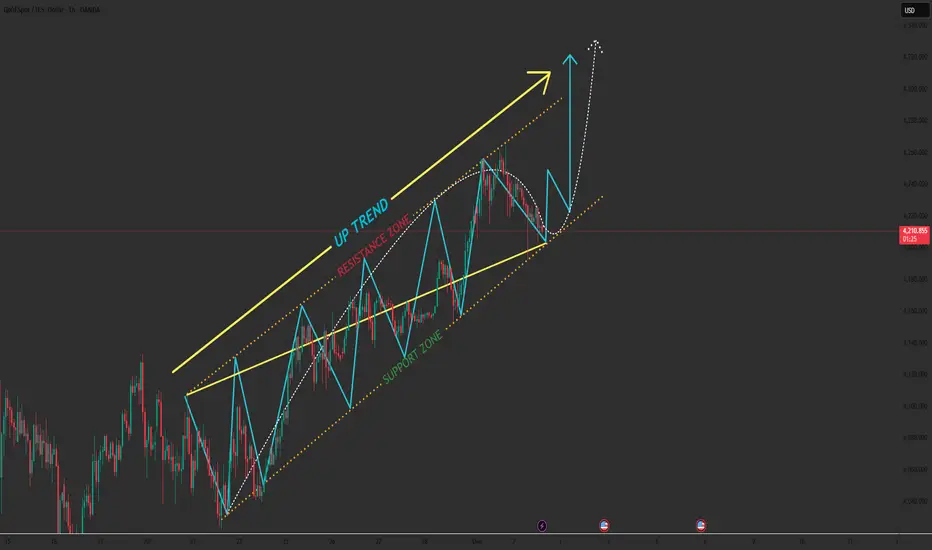
The Pullback Everyone Fears… But Smart Traders Are Waiting For1️⃣ Price Retracing Into Key Support
Gold is dipping into the support zone just below yesterday’s low.
This zone aligns with:
- The lower boundary of the short-term retracement channel
- The midline of the major ascending channel
- A liquidity pocket where buyers previously stepped in aggressively
This creates a textbook buy-the-pullback setup.
2️⃣ Trend Structure: Buyers Still in Control
Despite the temporary pullback:
- Trendline remains intact
- Momentum is still upward
- No major swing low has been broken
As long as 4,190 holds, the market favors continuation to the upside.
3️⃣ Expected Upside Rotation
If price stabilizes above 4,190–4,200 and intraday buyers return:
- Gold may begin a new bullish swing
- First target sits at 4,260
- Main target aligns with the upper boundary of the channel → 4,290
This completes the wave cycle shown in the chart (blue pattern).
4️⃣ Risk Scenario
⚠️ If Gold cleanly breaks below the channel and invalidates the trendline:
Price can correct toward 4,120 and even retest 4,100 before rebuilding bullish structure.
This does not kill the uptrend — but it delays the next bullish leg.
➡️ Primary Scenario
Pullback holds above 4,190 → bullish continuation → target 4,260 → 4,290.
⚠️ Risk Scenario
Break below the channel = short-term drop toward 4,120–4,100.
If this analysis resonates with you or if you see a different angle drop your thoughts in the comments. I’d love to hear your view!
Tired of Entering Too Late? Here’s the Setup You Shouldn’t Miss1️⃣ Key Resistance Zone Rejected
Price tapped into the resistance area around 1.1638 – 1.1652, which previously acted as a strong supply zone.
The sharp wick rejection signals that buyers were unable to maintain momentum.
This is a high-probability reversal behavior.
2️⃣ Market Structure: Rounded Top + Liquidity Grab
The rounded top formation indicates slowing bullish momentum.
The long upper wick suggests a liquidity sweep before the expected bearish leg.
This aligns with institutional behavior:
➡️ sweep liquidity → fill orders → drop.
3️⃣ Short Entry Confirmation
The chart clearly marks the ideal ENTRY SHORT as the candle rejects resistance.
Entry Zone: 1.1635 – 1.1650 (depending on spread)
Stop Loss: Above 1.1652
Take Profit: Targeting the weak support zone and then deeper into the strong support below.
4️⃣ Expected Price Path
Based on structure + support layers:
- First drop toward 1.1570 – 1.1560
- Beak of this level → continuation to the 1.1551 zone
- If momentum is strong, eventual return to the major support block
This aligns with the clean pullback–drop model typical in a trending market.
📌 Summary
This is a textbook short setup:
- Clear resistance rejection
- Liquidity sweep
- Bearish structure forming
- Targets lining up with both weak and strong support levels
High-probability trade for sellers.

GOLD SHOOK THE MARKET – STRUCTURE STILL UNBREAKABLE!📌 CURRENT MARKET UPDATE (GOLD – 4H)
The market continues to respect the wave structure exactly as projected:
- Wave (1) – (2) has already completed
- Wave (3) tapped into the Liquidity zone 4250–4260, creating a clean corrective reaction
- Price is currently in a technical retest phase, perfectly normal within a strong macro uptrend
🎯 Key Level to Watch
The Swing Zone 4147–4150 remains solid — this is the core foundation of the entire bullish structure.
- Only if this zone breaks will the trend lose strength
- EMA34 & EMA89 continue trending upward, acting as strong dynamic support
✅ Main Scenario (High Probability)
Price makes a mild correction before pushing up to complete Wave (5) of (3).
Expected pullback zones:
🔹 4210 – 4180
🔹 Reaction confirmation → bullish continuation toward:
- 4310 – 4325 (Resistance)
- 4365 – 4370 (Liquidity – Completion of Wave (C))
Current liquidity flow still favors buy setups at support retest.
⚠️ Sub-Scenario (Low Probability)
If a 4H candle closes below 4147 → deeper correction toward EMA200 (4060–4080).
↳ Currently, there is NO sign of this scenario.
✅ TODAY’S TREND SUMMARY
Trend: Corrective – Accumulation
Optimal Buy Zones: 4210 → 4180 → 4150
Targets:
- 4310 – 4325
- 4365 – 4370
Trend invalidation: Break 4147
